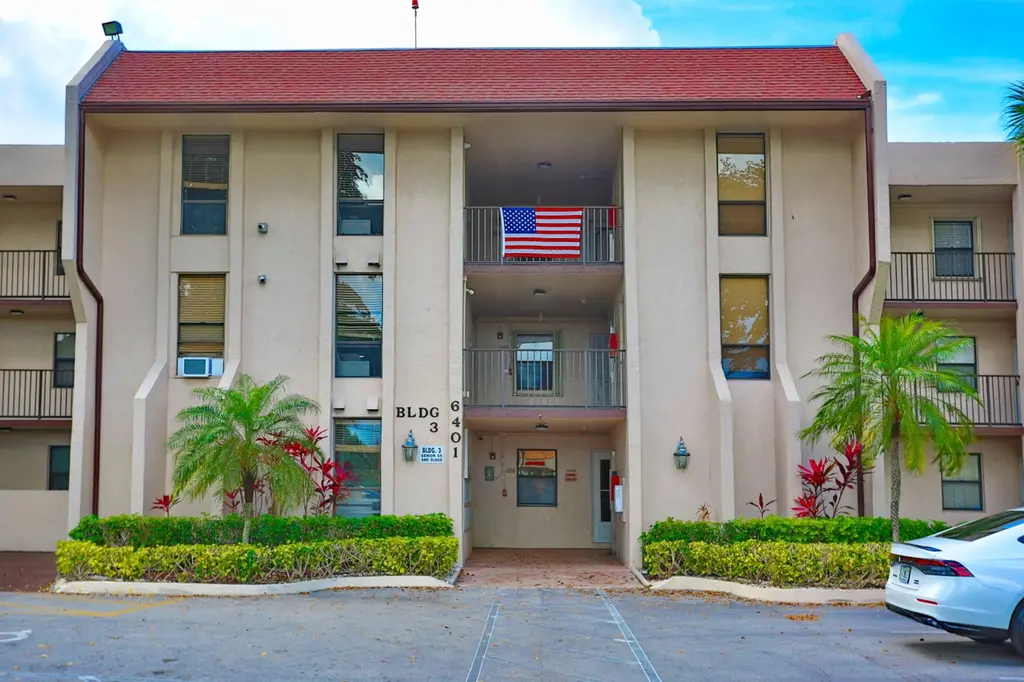
6401 N University Dr #210 · Tamarac, FL
Flood risk No data
- FEMA flood zone
- —
- Chance of flooding over 30 yrs
- —
- Est. flood insurance / yr
- —
Fire risk No data
- Est. fire insurance / yr
- —
Heat risk No data
- Hot days now (above threshold)
- —
- Hot days in 30 yrs
- —
Wind risk No data
- Chance of severe wind over 30 yrs
- —
Air-quality risk No data
- Unhealthy air days now
- —
- Unhealthy air days in 30 yrs
- —
Risk factors via First Street. Map © Google.
Why this score? — see what drove the C- grade
The composite is a weighted blend of 9 inputs, each scored 0–100. Each bar is that input's sub-score; the figure is the points it added to the 100-point composite (weight × sub-score).
- Cash flow +18.8/30.0
- 1% rule +9.1/10.0
- ARV discount +7.5/15.0
- DSCR +5.9/10.0
- Schools +4.1/10.0
- Livability +3.8/5.0
- Condition / age +2.5/5.0
- Rent growth +2.0/5.0
- Appreciation +0.0/10.0
$145,000
🖨 Deal sheet 📄 Offer letter ✓ Due diligence
Listing remarks
Looking for a cozy condo with a beautiful view? WELCOME HOME! This 2 bedroom, 2 bathroom condo in a 55+ community is the place for you. Ideally located near the elevator and directly across from the common laundry, the unit also offers washer/dryer hookups so you can install your own. Just two blocks from a pharmacy, grocery store, banks, fast food, and the hospital, with easy access to the Florida Turnpike and Sawgrass Expressway. Features include a newer A/C, no carpet, a kitchen with pass-through, and hurricane accordion shutters. Enjoy your morning coffee or evening sunsets from the spacious west-facing screened balcony overlooking the golf course and water. Community amenities include
Key facts
- Fitness center
- Community amenities
- Washer dryer hookups
Tags
Property features AI
Finance
- Other: Senior community
- Financial info: No land lease; Property is resale
- HOA & community: Association: Concord Village; Monthly HOA fee: $450; HOA covers cable TV, water, sewer, trash, elevator, roof repairs, grounds and structure maintenance, pest control, pool service, and recreation facilities; Community amenities include clubhouse, fitness center, pool, billiard room, community room, storage, laundry, parking, and trash chute
Exterior
- Parking: Assigned common parking; Guest parking; Asphalt parking; 1 open parking space (total 1)
- Security: Community has controlled amenities (clubhouse, pool, etc.)
- Utilities: Public water; Public sewer; Electricity available; Cable available; Phone service available
- Home design: Condominium; One level; Entry level: 1; Faces east
- Construction: Concrete block with stucco construction; Slab foundation; 3-story building; Building name/number: 6401
- Exterior features: Shingle roof; Private road frontage (west of US-1); Asphalt road surface; Not waterfront
Interior
- Kitchen: Dishwasher; Electric range; Microwave; Refrigerator; Disposal; Electric water heater
- Bedrooms: 2 bedrooms on main level
- Flooring: Tile flooring
- Bathrooms: 2 full bathrooms (main level)
- Heating & cooling: Central electric heating; Central air conditioning; Ceiling fans
- Interior features: Entrance foyer; Walk-in closet(s); Partially furnished; Blinds and drapes; Sliding windows
- Laundry & utility: Washer hookup; Electric dryer hookup; Laundry available in building
Neighborhood map
What this means for you Summary
Snapshot
- This is a 2-bed/2.0-bath condo listed at $145k.
Deal economics
- At list price, monthly cash flow is $145 ($2k/yr) — positive.
- The deal already cash-flows at list — no discount required.
- Meets the 1% rule at list price ($2k rent vs $145k).
- Recommended offer: $132k (9.0% below list) — sets the bar for market timing.
- Cap rate 7.5% vs local median 3.9% in Tamarac — top-decile yield for the area; either an underpriced asset or a hidden risk that comps aren't pricing in. Stress-test before assuming the spread holds.
Location & tenants
- Location reads 76/100 on livability (#239 in FL, #3,785 nationally) — a middle-class / working-renter tenant base. Strengths: housing A+, health & safety A+, cost of living A-; Watch: employment C-, amenities F, commute F.
- Broward (suburban): math 42% / reading 53% proficiency, ranked #46 of 73 in FL (top 63%) — families likely to look elsewhere, expect single-tenant / working-renter base with shorter leases.
- Market conditions: Rents soft (-1.9%/yr); 588 active listings in the ZIP; 40 comparable units currently listed for rent nearby; rentals at typical pace (median 21d on market — plan ~3-4 weeks tenant-placement turnaround); 2,111 units permitted in Broward County in 2024 (1,265 in 5+ unit buildings).
- This rent runs 39% of the median local income ($62k/yr) — at the standard rent-burdened threshold; future hikes will face affordability resistance.
Forward outlook
- Local home prices are declining (-3.0%/yr); year-one equity from $1k of loan paydown is wiped out by about $4k of value loss. Plan a longer hold.
- Broward County population projected at +34% by 2050 — long-run rental-demand tailwind backs the buy-and-hold thesis.
Negotiation context
- It's been on market 96 days — a 9% lower offer ($132k) is reasonable based on typical stale-listing flexibility.
- Current owner paid $80k; list at $145k implies a 81% gain — meaningful room to come down on a strong offer.
Risks & watch-outs
- Watch-outs: HOA is 29% of rent.
Questions for the listing agent
- It's been on market 96 days. Have you received any prior offers? Is the seller open to a 9% concession, seller financing, or rate buy-down credit?
- Built in 1979 — when were the roof, HVAC, electrical panel, plumbing, and water heater last replaced?
- What does the HOA fee cover, when was the last increase, and are there any pending special assessments or reserve-fund shortfalls?
- Any open or pending special assessments — roof, HVAC, plumbing, elevator, façade? What's the per-unit balance and payoff schedule, and is the seller paying it off at close or rolling it to the buyer?
- Why hasn't it sold? Are there any deal-killer items the seller is aware of (foundation, flood, title, zoning, code violations)?
- Is there a deadline driving the sale (1031 exchange, divorce, estate, relocation)? That informs how much negotiation room exists.
- Schools are B-rated — typically a magnet for longer-tenancy family renters. What's the average tenant stay here, and is there a school-zone premium baked into asking?
- What's the average days-on-market for RENTAL listings here right now (not sales)? A rising rental-DOM trend means longer vacancies and softer asking-rent achievability than the comps imply.
- What's the recent tenant-quality profile in this submarket — average credit score on applications, eviction rate, late-payment / NSF rate, and stable-employment percentage? A property-management company in the area should have these aggregated.
- How much new apartment / multifamily construction is in the pipeline within 1–3 miles? Heavy new supply (>2% of stock underway) typically softens rents 12–24 months out; light construction supports rent growth.
Investment metrics
- 1% rule
- 1.41% ✓
- Cap rate
- 7.49%
- Cash-on-cash
- 4.29%
- DSCR
- 1.19
- GRM
- 5.9
CMA / ARV
No comps found within radius.
Projected returns pro-forma
-3.0% appreciation · 0.0% rent growth · sell at horizon
- IRR
- -14.3%
- Equity multiple
- 0.51×
- Total profit
- $-19,923
- Equity at exit
- $21,620
- IRR
- -14.5%
- Equity multiple
- 0.33×
- Total profit
- $-27,280
- Equity at exit
- $12,537
Cash invested: $40,600 (down + closing). Projections, not guarantees.
Landlord ↔ Tenant lean methodology
- Overall (STATE)
- 87 Strongly Landlord-Friendly
- State Florida
- 87 Strongly Landlord-Friendly · R+3
- County
- — inherits STATE
- City
- — inherits STATE
ZIP-level market 33321
- Home prices YoY
- -30.4%
- Rents YoY
- -1.9%
- Active inventory
- 588
- Price-to-rent
- 5.9×
Monthly cashflow live
- Estimated rent
- $2,040 high interval (Pro) →
- Mortgage (P&I)
- −$760
- Tax from tax record
- −$61 /mo · $734/yr
- Insurance
- −$60
- HOA
- −$585
- Vacancy / Maint / Mgmt
- −$428
- Net cashflow
- $145
Break-even live
UW: 25.0% down · 7.5% · 30yr · 1.5% tax · 5.0% vac · 8.0% maint · 8.0% mgmt
Financing live
Cash to close
- Down payment
- $36,250
- Closing costs
- $4,350
- Reserves months
- —
- Total cash needed
- —
Loan-product check · same deal, 3 products live
Conventional
25% down · 7.5% · 30yr
- Down + closing
- —
- Monthly P&I
- —
- Monthly cashflow
- —
- DSCR
- —
- Eligible?
- —
Personal DTI + credit; lowest rate.
DSCR
20% down · 8.5% · 30yr
- Down + closing
- —
- Monthly P&I
- —
- Monthly cashflow
- —
- DSCR
- —
- Eligible?
- —
No personal income docs; deal must DSCR.
Hard money
10% down · 12.0% · 12mo
- Down + closing
- —
- Monthly P&I
- —
- Monthly cashflow
- —
- DSCR
- —
- Eligible?
- —
Short-term bridge; refi at stabilization.
Rent comps 40 comps
| Address | Beds | Baths | Sqft | Rent | $/sqft | DOM | Units | Dist |
|---|---|---|---|---|---|---|---|---|
| 7820 Colony Cir S #109 Tamarac, FL | 2.0 | 2.0 | 949 | $1,725 | $1.82 | 20d | 1 | 0.15mi |
| 6361 Landings Ter #6361 Tamarac, FL | 3.0 | 2.5 | 1417 | $2,650 | $1.87 | 24d | 1 | 0.16mi |
| 6301 N University Dr Tamarac, FL | 2.0 | 2.0 | 865 | $1,925 | $2.23 | 24d | 1 | 0.17mi |
| 7831 Colony Cir N #201 Tamarac, FL | 2.0 | 2.0 | 949 | $2,000 | $2.11 | 14d | 1 | 0.19mi |
| 6751 N University Dr #320 Tamarac, FL | 2.0 | 2.0 | 1040 | $2,000 | $1.92 | 24d | 1 | 0.20mi |
| 7900 Colony Cir S #303 Tamarac, FL | 1.0 | 1.5 | 750 | $1,680 | $2.24 | 24d | 1 | 0.20mi |
| 7910 Colony Cir N #308 Tamarac, FL | 1.0 | 1.5 | 750 | $1,600 | $2.13 | 24d | 1 | 0.21mi |
| 6301 Landings Ter Tamarac, FL | 3.0 | 2.5 | 1417 | $2,800 | $1.98 | 16d | 1 | 0.23mi |
| 6301 Landings Ter Tamarac, FL | 3.0 | 2.5 | 1417 | $2,800 | $1.98 | 24d | 1 | 0.23mi |
| 7900 Fairview Dr Tamarac, FL | 2.0 | 2.0 | 949 | $2,050 | $2.16 | 3d | 1 | 0.23mi |
| 7900 Fairview Dr #105 Tamarac, FL | 2.0 | 2.0 | 949 | $2,050 | $2.16 | 5d | 1 | 0.23mi |
| 7650 W McNab Rd #204 Tamarac, FL | 2.0 | 2.0 | 865 | $1,695 | $1.96 | 15d | 1 | 0.25mi |
| 7650 W McNab Rd #204 Tamarac, FL | 2.0 | 2.0 | 865 | $1,695 | $1.96 | 10d | 1 | 0.25mi |
| 8051 Colony Cir S #205 Tamarac, FL | 2.0 | 2.0 | 949 | $1,650 | $1.74 | 14d | 1 | 0.26mi |
| 8040 Colony Cir N #207 Tamarac, FL | 1.0 | 1.5 | 750 | $1,475 | $1.97 | 24d | 1 | 0.26mi |
| 7960 Colony Cir N #206 Tamarac, FL | 2.0 | 2.0 | 949 | $1,800 | $1.90 | 24d | 1 | 0.26mi |
| 8000 Colony Cir S #309 Tamarac, FL | 2.0 | 2.0 | 949 | $1,950 | $2.05 | 24d | 1 | 0.29mi |
| 8000 S Colony Cir Apt S305 Tamarac, FL | 2.0 | 2.0 | 949 | $1,800 | $1.90 | 5d | 1 | 0.29mi |
| 8000 Colony Cir S Tamarac, FL | 2.0 | 2.0 | 949 | $1,875 | $1.98 | 20d | 2 | 0.29mi |
| 8000 Colony Cir S #305 Tamarac, FL | 2.0 | 2.0 | 949 | $1,800 | $1.90 | 7d | 1 | 0.29mi |
| 8001 Fairview Dr #106 Tamarac, FL | 2.0 | 2.0 | 949 | $1,900 | $2.00 | 24d | 1 | 0.29mi |
| 8002 Lagos de Campo Blvd Unit 101B Tamarac, FL | 2.0 | 2.0 | 1078 | $2,200 | $2.04 | 24d | 1 | 0.30mi |
| 7309 NW 62nd St Tamarac, FL | 2.0 | 2.0 | 1062 | $2,950 | $2.78 | 24d | 1 | 0.33mi |
| 8000 Lagos De Campo Blvd Unit A-303 Tamarac, FL | 1.0 | 1.5 | 746 | $1,775 | $2.38 | 24d | 1 | 0.33mi |
| 8000 Lagos De Campo Blvd Unit A-307 Tamarac, FL | 2.0 | 2.0 | 1078 | $2,250 | $2.09 | 20d | 1 | 0.33mi |
| 7107 NW 66th St Tamarac, FL | 3.0 | 2.0 | 1485 | $3,080 | $2.07 | 7d | 1 | 0.34mi |
| 7950 W McNab Rd #214 Tamarac, FL | 2.0 | 2.0 | 1040 | $1,950 | $1.88 | 4d | 1 | 0.36mi |
| 8060 Colony Cir N #208 Tamarac, FL | 1.0 | 1.5 | 750 | $1,700 | $2.27 | 15d | 1 | 0.37mi |
| 8051 S Colony Cir Apt S205 Tamarac, FL | 2.0 | 2.0 | 949 | $1,650 | $1.74 | 4d | 1 | 0.37mi |
| 8060 Colony Cir N Tamarac, FL | 1.0 | 1.5 | 750 | $1,600 | $2.13 | 17d | 2 | 0.37mi |
| 8050 W McNab Rd #206 Tamarac, FL | 2.0 | 2.0 | 1040 | $1,890 | $1.82 | 7d | 1 | 0.42mi |
| 8050 W McNab Rd #206 Tamarac, FL | 2.0 | 2.0 | 1040 | $1,890 | $1.82 | 14d | 1 | 0.42mi |
| 8027 Lagos de Campo Blvd Unit A4 Tamarac, FL | 3.0 | 2.5 | 1230 | $3,000 | $2.44 | 24d | 1 | 0.43mi |
| 8205 NW 61st St Unit B202 Tamarac, FL | 2.0 | 2.0 | 1100 | $2,000 | $1.82 | 24d | 1 | 0.44mi |
| 5908 NW 81st Ave Tamarac, FL | 2.0 | 1.0 | 1062 | $2,100 | $1.98 | 18d | 1 | 0.46mi |
| 6527 NW 70th Ave Unit 082 Tamarac, FL | 2.0 | 1.0 | 865 | $2,050 | $2.37 | 24d | 1 | 0.49mi |
| 8033 NW 71st Ct #8033 Tamarac, FL | 3.0 | 3.0 | 1417 | $3,100 | $2.19 | 24d | 1 | 0.54mi |
| 8107 NW 58th Pl Unit 8107 Tamarac, FL | 2.0 | 1.0 | 1082 | $2,200 | $2.03 | 24d | 1 | 0.56mi |
| 8301 Sands Point Blvd Unit 306S Tamarac, FL | 1.0 | 1.5 | 850 | $1,650 | $1.94 | 17d | 1 | 0.57mi |
| 8311 Sands Point Blvd Unit 106 Tamarac, FL | 1.0 | 1.5 | 825 | $1,750 | $2.12 | 7d | 1 | 0.60mi |
HOA detail condo
- Monthly dues
- $585 · $7,020/yr
- Likely covers
- water
- Assessments
- None detected in remarks — confirm with the listing agent.
Listing history 18 events
-
2026-06-18days on market $145,000 Active 96 DOM
-
2026-06-17days on market $145,000 Active 95 DOM
-
2026-06-16days on market $145,000 Active 94 DOM
-
2026-06-15days on market $145,000 Active 93 DOM
-
2026-06-13days on market $145,000 Active 91 DOM
-
2026-06-09days on market $145,000 Active 87 DOM
-
2026-06-08days on market $145,000 Active 86 DOM
-
2026-06-07days on market $145,000 Active 85 DOM
-
2026-06-04days on market $145,000 Active 82 DOM
-
2026-06-03days on market $145,000 Active 81 DOM
-
2026-06-02days on market $145,000 Active 80 DOM
-
2026-06-01days on market $145,000 Active 79 DOM
-
2026-05-31days on market $145,000 Active 78 DOM
-
2026-05-07price $145,000
-
2026-04-11price $160,000
-
2026-03-14$170,000 Active
-
2017-07-24soldstatus $80,000
-
1992-01-16soldstatus $45,000
ⓘ Source: listings_history table (triggers on properties + properties_extension) + one-shot
backfill from property_details.listing_events for pre-trigger history.
Tax reassessment forecast FL · Resets to sale price
- Current annual tax
- $734 · $61/mo
- Projected year-2 tax
- $1,204 · $100/mo
- Expected delta
- +$470/yr (+$39/mo · 64.1%)
ⓘ Screening estimate from a state-policy table — verify with the county assessor before closing.
Nearby sold comps map
Loading sold comps map…
Walkable amenities ~0.75 mi
Loading nearby amenities…
Taxation est. · year 1
- Rental income
- $24,485
- − Mortgage interest
- −$8,122
- − Property taxes
- −$734
- − Insurance
- −$725
- − Repairs & maintenance
- −$1,959
- − Management
- −$1,959
- − HOA
- −$7,020
- − Depreciation
- −$4,218
- Taxable loss
- −$251
- Est. tax savings @ 24.0%
- +$60
- After-tax cash flow
- $1,800/yr
For passive investors: Depreciation is non-cash, so a rental often shows a tax loss while cash-flowing — sheltering income. Rental losses are passive: they offset passive income freely, and up to $25,000/yr can offset ordinary (W-2) income if you actively participate and your MAGI is under $100k (phasing out to $0 by $150k); unused losses carry forward. On sale, claimed depreciation is recaptured at up to 25%, and gains may owe capital-gains tax (a 1031 exchange can defer both). Figures are a year-1 estimate at your 24.0% rate — not tax advice; consult a CPA.
Schools (NCES district)
- District
- Broward
- NCES district ID
- 1200180
- Math proficiency
- 42% ▼ -18.00%
- Reading proficiency
- 53% ▼ -5.00%
- Median HH income
- $52,139
- Composite
- 40.88/100
- National rank
- #3621
- State rank
- #46 of 73 in FL
Livability — Tamarac
- Score
- 76/100
- State rank
- #239
- US rank
- #3785
Category grades
Schools grade is shown separately in the Schools card above.
Census & demographics
- Census place
- Tamarac, FL
- County
- Broward County · 1,963,430 people
- City population
- 105,666
- Metro
- Miami-Fort Lauderdale-Pompano Beach, FL
- Population (ZIP)
- 51,216
- Household income
- $62,066
- Rent vs Own
- Severe rent burden
- 1394.0
Population outlook (Broward County) Hauer SSP2
- Today (2025)
- 2,207,033 people
- By 2030
- 2,360,704 · +7.0%
- By 2040
- 2,661,208 · +20.6%
- By 2050
- 2,946,698 · +33.5%
- By 2075
- 3,602,273 · +63.2%
- By 2100
- 3,970,984 · +79.9%
Race, ethnicity, and origin ACS 2023
- Neighborhood character
- Highly diverse neighborhood (Simpson 0.70)
- Race & ethnicity
- Hispanic / Latino 34% White 33% Black 27% Two or more races 20% Asian 3%
- Hispanic origin (detail)
- Mexican 2% Puerto Rican 5% Cuban 5% Dominican 3%
- Common ancestry
- Romanian 3% Hispanic 3% Scotch-Irish 2%
- Foreign-born
- 38% · Canada, Jamaica, Dominican Republic
- Languages at home
- 63% English-only · Spanish 29% French/Haitian/Cajun 4% Other Indo-European 1%
Political lean MEDSL · Broward
- 2024 margin
- D (+17.0) · D 58.0% · R 41.0%
- 2008→2024 swing
- -17.8pp toward R · 2008: 34.7pp · 2024: 17.0pp
- All cycles
- 2024: D+17.0 2020: D+29.8 2016: D+35.0 2012: D+34.9 2008: D+34.7
Not yet ingested
- Civics
- —
Market trends
- HPI YoY
- ▼ -158.63%
- Current HPI
- 362.2989
- Rent YoY
- ▼ -1.86%
- Metro
- Miami-Fort Lauderdale-Pompano Beach, FL
- State GDP YoY
- ▲ 3.28%
- F500 in state
- 36
Industry mix (Fortune 500 HQ in FL)
| Industry | F500 HQs | Revenue |
|---|---|---|
| Industrial Technology | 2 | $29B |
|
||
| Insurance | 2 | $17B |
|
||
| Retail | 1 | $60B |
|
||
| Technology Distribution | 1 | $58B |
|
||
| Homebuilding | 1 | $35B |
|
||
| Technology Manufacturing | 1 | $35B |
|
||
Price history
+222.2% since first listed5 events — show timeline
- 2026-05-07 Price Changed $145,000 Beaches MLS
- 2026-04-11 Price Changed $160,000 Beaches MLS
- 2026-03-14 Listed $170,000 Beaches MLS
- 2017-07-24 Sold (Public Records) $80,000 Public Records
- 1992-01-16 Sold (Public Records) $45,000 Public Records
Property tax history
-1.8%/yrLatest (2025): $734 · +6.4% YoY. Source: county tax records.
Cash-flow waterfall
monthlySold comps — $/sqft
last 12 mo · ≤1 miLoading sold comps…