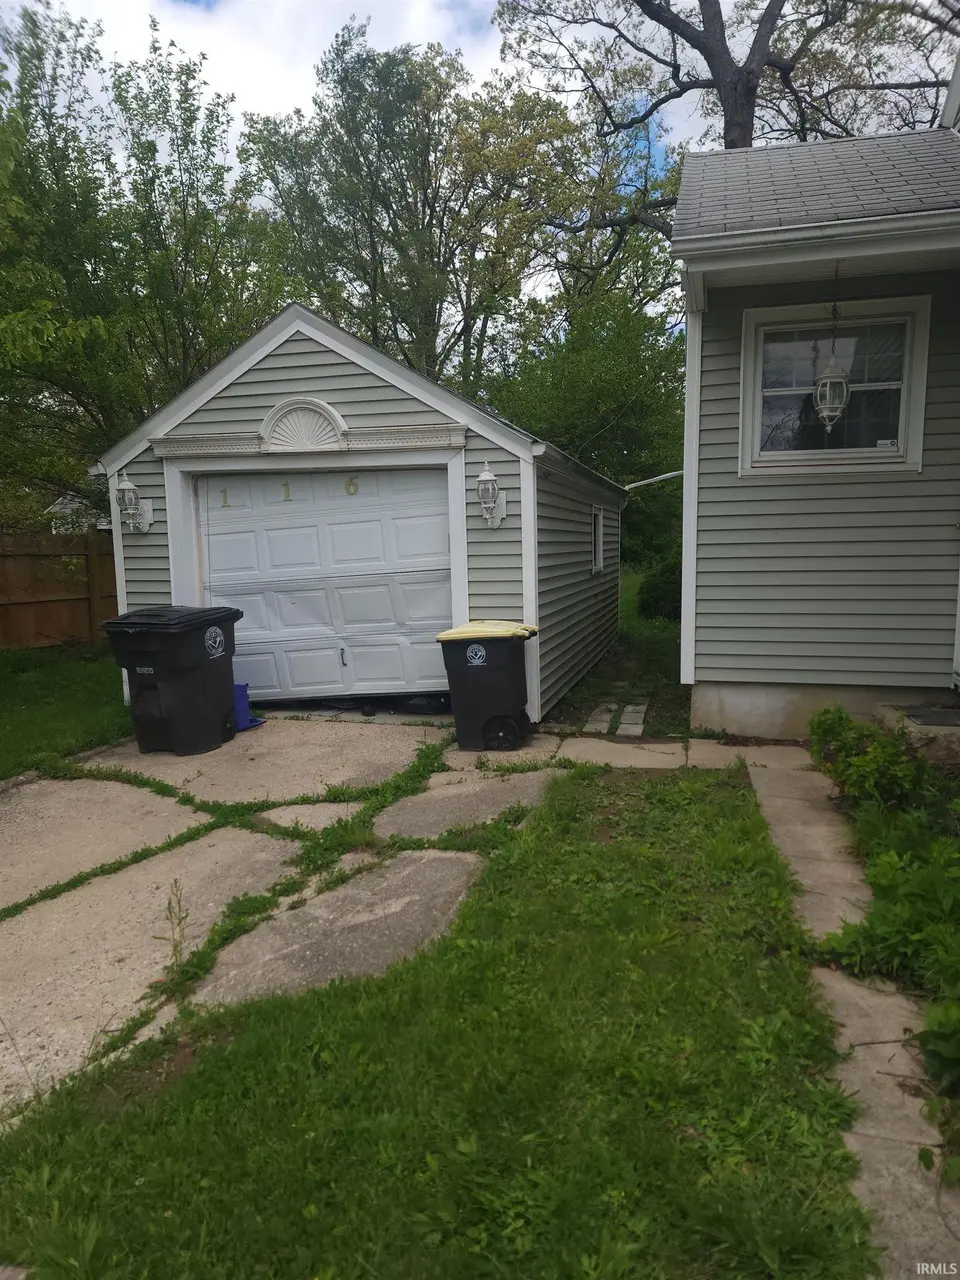
116 Burns Blvd · Fort Wayne, IN
Flood risk 1/10 · Minimal
- FEMA flood zone
- X (unshaded)
- Chance of flooding over 30 yrs
- 0.0%
- Est. flood insurance / yr
- $473 – $860
Fire risk 1/10 · Minimal
- Est. fire insurance / yr
- $717 – $1,331
Heat risk 3/10 · Minor
- Hot days now (above 100°F)
- 7 days/yr
- Hot days in 30 yrs
- 17 days/yr
Wind risk 2/10 · Minimal
- Chance of severe wind over 30 yrs
- —
Air-quality risk 3/10 · Minor
- Unhealthy air days now
- 2 days/yr
- Unhealthy air days in 30 yrs
- 3 days/yr
Risk factors via First Street. Map © Google.
Why this score? — see what drove the B+ grade
The composite is a weighted blend of 9 inputs, each scored 0–100. Each bar is that input's sub-score; the figure is the points it added to the 100-point composite (weight × sub-score).
- Cash flow +30.0/30.0
- ARV discount +15.0/15.0
- DSCR +10.0/10.0
- 1% rule +8.0/10.0
- Rent growth +4.6/5.0
- Livability +4.2/5.0
- Condition / age +2.5/5.0
- Schools +2.2/10.0
- Appreciation +0.0/10.0
$99,900
🖨 Deal sheet (PDF) 📄 Offer letter ✓ Due diligence
Listing remarks MLS
Move in condition, nice three bedroom ranch. Hardwood floors, full basement, vinyl siding, garage, nice back yard. Multiple updates in 2018 including electrical, dish washer, painting, flooring, lighting, and furnace improvement. Any existing appliances not warrantied. Check out the updates and nice deck and back yard.
Key facts
- 9,514 sq ft lot
- Garage
- Built 1950
Property features AI
Exterior
- Parking: Detached 1-car garage
- Utilities: Public water; Public sewer
- Home design: Single-family residential, site-built home; One story
- Construction: Aluminum siding
- Exterior features: Sloped and level lot; Lot dimensions 75 x 126.9; Lot size approximately 0.22 acres; Asphalt roof
Interior
- Kitchen: Dishwasher; Electric oven; Electric range
- Bedrooms: Total of 6 rooms (bedroom count not specified)
- Bathrooms: One full bathroom (main level)
- Heating & cooling: Natural gas heating with forced air; Central air conditioning
- Interior features: Dishwasher; Electric oven; Electric range; Gas water heater; Water heater; One fireplace; Full unfinished basement
- Laundry & utility: Gas water heater; Water heater
Neighborhood map
What this means for you Summary
Snapshot
- This is a 3-bed/1.0-bath single-family listed at $100k.
Deal economics
- At list price, monthly cash flow is $408 ($5k/yr) — positive.
- The deal already cash-flows at list — no discount required.
- Meets the 1% rule at list price ($1k rent vs $100k).
- Cap rate 11.2% vs local median 4.8% in Fort Wayne — top-decile yield for the area; either an underpriced asset or a hidden risk that comps aren't pricing in. Stress-test before assuming the spread holds.
Location & tenants
- Location reads 84/100 on livability (#6 in IN, #676 nationally) — a professional / high-income tenant draw. Strengths: amenities A+, commute A+, cost of living A+; Watch: crime C-, employment D+.
- Fort Wayne Community Schools (urban): math 22% / reading 29% proficiency, ranked #263 of 301 in IN (top 87%) — low school quality limits family demand, transient renter base, plan for 1-2y turnover; 60% free/reduced lunch — lower-income household profile, screen leases tightly.
- Zoned schools: Harrison Hill Elementary School (math 21% / reading 18%, grade F, #814 of 994 statewide, top 83%, 618 students, 76% FRL); Kekionga Middle School (math 10% / reading 17%, grade F, #303 of 330 statewide, top 92%, 538 students, 80% FRL); South Side High School (math 12% / reading 39%, grade F, #322 of 369 statewide, top 87%, 1,423 students, 73% FRL) — zoned schools average 77% FRL vs 60% district-wide (16 pts higher); higher-poverty schools than district average — tighter screening recommended.
- Market conditions: Rents rising fast (+8.2%/yr); 94 active listings in the ZIP; 10 comparable units currently listed for rent nearby; rentals at typical pace (median 14d on market — plan ~3-4 weeks tenant-placement turnaround); 1,861 units permitted in Allen County in 2024 (576 in 5+ unit buildings).
Forward outlook
- Local home prices are declining (-3.0%/yr); year-one equity from $691 of loan paydown is wiped out by about $3k of value loss. Plan a longer hold.
- Allen County population projected at +10% by 2050 — modest demand growth; plan on rents tracking national, not racing it.
- At projected returns (-3.0% appreciation + 8.0% rent growth), your $28k cash investment doubles in ~6 years — after that, you're playing with house money.
Negotiation context
- Only 5 days on market — expect competitive offers; lowballing is unlikely to land.
- 2 sale attempts since 8y ago with the ask held roughly flat each time — persistent listings suggest the price (not the market) is what's stuck; bring a comps-based counter.
Risks & watch-outs
- Watch-outs: built in 1950 — expect roof / HVAC / electrical / plumbing capex.
Questions for the listing agent
- Built in 1950 — when were the roof, HVAC, electrical panel, plumbing, and water heater last replaced?
- Is there a deadline driving the sale (1031 exchange, divorce, estate, relocation)? That informs how much negotiation room exists.
- Schools are D-rated, which usually means shorter tenancies and higher turnover. Who's the typical renter profile here, and what's been the actual vacancy rate?
- What's the average days-on-market for RENTAL listings here right now (not sales)? A rising rental-DOM trend means longer vacancies and softer asking-rent achievability than the comps imply.
- What's the recent tenant-quality profile in this submarket — average credit score on applications, eviction rate, late-payment / NSF rate, and stable-employment percentage? A property-management company in the area should have these aggregated.
- How much new for-sale + rental construction is in the pipeline within 1–3 miles? Heavy new supply typically softens prices + rents 12–24 months out; constrained supply supports both.
Investment metrics
- 1% rule
- 1.30% ✓
- Cap rate
- 11.20%
- Cash-on-cash
- 17.52%
- DSCR
- 1.78
- GRM
- 6.4
CMA / ARV
- ARV (median comp)
- $151,547
- List price
- $99,900
- Delta
- -34.08%
- Verdict
- UNDERPRICED
- Comps
- 20 within 1.0 mi
Show comp detail 12 sales within ~0.75 mi
| Address | Dist | Beds/Ba | Sqft | Sold | Price | $/sf | Match |
|---|---|---|---|---|---|---|---|
| 5922 Southcrest Rd | 0.09mi | 3/1.0 | 1,360 (-11%) | 4mo | $120,000 | $88 | 75 |
| 408 Burns Blvd | 0.25mi | 2/1.0 (-1) | 1,401 (-8%) | 12mo | $167,900 | $120 | 60 |
| 5216 S Calhoun St | 0.40mi | 3/1.0 | 1,410 (-7%) | 13mo | $165,000 | $117 | 58 |
| 6016 Webster St | 0.12mi | 3/1.0 | 1,296 (-15%) | 15mo | $160,000 | $123 | 57 |
| 444 W Fairfax Ave | 0.54mi | 4/1.5 (+1) | 1,596 (+5%) | 3mo | $150,000 | $94 | 57 |
| 5308 Southern Ct | 0.67mi | 3/2.0 | 1,580 (+4%) | 4mo | $169,000 | $107 | 55 |
| 310 W Pettit Ave | 0.67mi | 3/1.0 | 1,620 (+6%) | 6mo | $158,900 | $98 | 53 |
| 6405 Bristol Rd | 0.37mi | 4/1.5 (+1) | 1,395 (-8%) | 11mo | $180,000 | $129 | 52 |
| 5521 S Wayne Ave | 0.49mi | 3/2.5 | 1,434 (-6%) | 12mo | $165,000 | $115 | 52 |
| 130 E Hoover Dr | 0.73mi | 3/1.5 | 1,660 (+9%) | 2mo | $195,000 | $117 | 47 |
| 4817 Calumet Ave | 0.70mi | 3/1.0 | 1,660 (+9%) | 11mo | $140,000 | $84 | 43 |
| 4942 S Wayne Ave | 0.74mi | 3/2.0 | 1,428 (-6%) | 12mo | $199,500 | $140 | 41 |
Match score weights: distance 35% · size 25% · config 20% · recency 20%. Top-matched comps best support the ARV.
Projected returns pro-forma
-3.0% appreciation · 8.0% rent growth · sell at horizon
- IRR
- 14.1%
- Equity multiple
- 1.59×
- Total profit
- $16,636
- Equity at exit
- $14,895
- IRR
- 26.2%
- Equity multiple
- 3.82×
- Total profit
- $79,017
- Equity at exit
- $8,638
Cash invested: $27,972 (down + closing). Projections, not guarantees.
Landlord ↔ Tenant lean methodology
- Overall (STATE)
- 90 Strongly Landlord-Friendly
- State Indiana
- 90 Strongly Landlord-Friendly · R+11
- County
- — inherits STATE
- City
- — inherits STATE
ZIP-level market 46807
- Rents YoY
- 8.2%
- Active inventory
- 94
- Price-to-rent
- 6.4×
Monthly cashflow live
- Estimated rent
- $1,295 high interval (Pro) →
- Mortgage (P&I)
- −$524
- Tax from tax record
- −$49 /mo · $592/yr
- Insurance
- −$42
- HOA
- −$0
- Vacancy / Maint / Mgmt
- −$272
- Net cashflow
- $408
Break-even live
Sensitivity live
| Price | -10% $465 | -5% $437 | +0% $408 | +5% $380 | +10% $352 |
|---|---|---|---|---|---|
| Rent | -10% $306 | -5% $357 | +0% $408 | +5% $459 | +10% $511 |
| Rate | -1.0pp $459 | -0.5pp $434 | base $408 | +0.5pp $382 | +1.0pp $356 |
UW: 25.0% down · 7.5% · 30yr · 1.5% tax · 5.0% vac · 8.0% maint · 8.0% mgmt
Financing live
Cash to close
- Down payment
- $24,975
- Closing costs
- $2,997
- Reserves months
- —
- Total cash needed
- —
Loan-product check · same deal, 3 products live
Conventional
25% down · 7.5% · 30yr
- Down + closing
- —
- Monthly P&I
- —
- Monthly cashflow
- —
- DSCR
- —
- Eligible?
- —
Personal DTI + credit; lowest rate.
DSCR
20% down · 8.5% · 30yr
- Down + closing
- —
- Monthly P&I
- —
- Monthly cashflow
- —
- DSCR
- —
- Eligible?
- —
No personal income docs; deal must DSCR.
Hard money
10% down · 12.0% · 12mo
- Down + closing
- —
- Monthly P&I
- —
- Monthly cashflow
- —
- DSCR
- —
- Eligible?
- —
Short-term bridge; refi at stabilization.
Rent comps 10 comps
| Address | Beds | Baths | Sqft | Rent | $/sqft | DOM | Units | Dist |
|---|---|---|---|---|---|---|---|---|
| 700 Candlelite Ct Fort Wayne, IN | 2.0–3.0 | 1.0–2.5 | 1388 | $1,399 | $1.01 | 14d | 4 | 0.38mi |
| 522 Pinegrove Ln Fort Wayne, IN | 2.0–3.0 | 1.0–1.5 | 1248 | $1,259 | $1.01 | 14d | 8 | 0.40mi |
| 6440 Fairfield Ave Fort Wayne, IN | 1.0–2.0 | 1.0–1.5 | 928 | $1,344 | $1.45 | 14d | 10 | 0.41mi |
| 220 E Hoover Dr Fort Wayne, IN | 2.0–3.0 | 1.5 | 1150 | $1,259 | $1.09 | 14d | 5 | 0.71mi |
| 1003 Pointe Center Cv Unit 1003 Fort Wayne, IN | 2.0 | 1.5 | 1200 | $1,275 | $1.06 | 45d | 1 | 0.74mi |
| 4133 Lafayette St Fort Wayne, IN | 4.0 | 2.0 | 1640 | $1,400 | $0.85 | 21d | 1 | 1.21mi |
| 4405 S Park Dr Fort Wayne, IN | 2.0 | 1.0 | 1440 | $1,175 | $0.82 | 14d | 1 | 1.21mi |
| 4201 S Wayne Ave Fort Wayne, IN | 3.0 | 1.5 | 1252 | $1,400 | $1.12 | 21d | 1 | 1.23mi |
| 1730 Scotsdale Dr Fort Wayne, IN | 3.0 | 1.0 | 1192 | $1,125 | $0.94 | 14d | 1 | 1.40mi |
| 3801 Lafayette St Fort Wayne, IN | 2.0 | 1.0 | 1116 | $995 | $0.89 | 14d | 1 | 1.45mi |
Listing history 3 events
-
2026-05-15$99,900 Active 181-char remark
-
2018-07-27soldstatus $70,000 320-char remark
Show marketing remark (320 chars)
Move in condition, nice three bedroom ranch. Hardwood floors, full basement, vinyl siding, garage, nice back yard. Multiple updates in 2018 including electrical, dish washer, painting, flooring, lighting, and furnace improvement. Any existing appliances not warrantied. Check out the updates and nice deck and back yard.
-
2018-06-28$72,500 320-char remark
Show marketing remark (320 chars)
Move in condition, nice three bedroom ranch. Hardwood floors, full basement, vinyl siding, garage, nice back yard. Multiple updates in 2018 including electrical, dish washer, painting, flooring, lighting, and furnace improvement. Any existing appliances not warrantied. Check out the updates and nice deck and back yard.
ⓘ Source: listings_history table (triggers on properties + properties_extension) + one-shot
backfill from property_details.listing_events for pre-trigger history.
Tax reassessment forecast IN · Partial reset (capped growth)
- Current annual tax
- $592 · $49/mo
- Projected year-2 tax
- $720 · $60/mo
- Expected delta
- +$129/yr (+$11/mo · 21.8%)
ⓘ Screening estimate from a state-policy table — verify with the county assessor before closing.
Climate risk First Street
- Flood 1/10 Low FEMA zone X (unshaded) · 0% chance over 30 yrs
- Wildfire 1/10 Low
- Heat 3/10 Moderate 7 d/yr ≥100°F today · 17 d/yr by 30 yrs out
- Wind 2/10 Low
- Air quality 3/10 Moderate 2 unhealthy d/yr today · 3 by 30 yrs out
Nearby sold comps map
Loading sold comps map…
Walkable amenities ~0.75 mi
Loading nearby amenities…
Taxation est. · year 1
- Rental income
- $15,541
- − Mortgage interest
- −$5,596
- − Property taxes
- −$592
- − Insurance
- −$500
- − Repairs & maintenance
- −$1,243
- − Management
- −$1,243
- − Depreciation
- −$2,906
- Taxable income
- $3,462
- Est. tax owed @ 24.0%
- −$831
- After-tax cash flow
- $4,069/yr
For passive investors: Depreciation is non-cash, so a rental often shows a tax loss while cash-flowing — sheltering income. Rental losses are passive: they offset passive income freely, and up to $25,000/yr can offset ordinary (W-2) income if you actively participate and your MAGI is under $100k (phasing out to $0 by $150k); unused losses carry forward. On sale, claimed depreciation is recaptured at up to 25%, and gains may owe capital-gains tax (a 1031 exchange can defer both). Figures are a year-1 estimate at your 24.0% rate — not tax advice; consult a CPA.
Schools (NCES district)
- District
- Fort Wayne Community Schools
- NCES district ID
- 1803630
- Math proficiency
- 22% ▼ -11.00%
- Reading proficiency
- 29% ▼ -7.00%
- Median HH income
- $41,951
- Composite
- 21.68/100
- National rank
- #8275
- State rank
- #263 of 301 in IN
Livability — Fort Wayne
- Score
- 84/100
- State rank
- #6
- US rank
- #676
Category grades
Schools grade is shown separately in the Schools card above.
Census & demographics
- Census place
- Fort Wayne, IN
- County
- Allen County · 326,813 people
- City population
- 326,813
- Metro
- Fort Wayne, IN
- Population (ZIP)
- 16,317
- Household income
- $58,685
- Rent vs Own
- Severe rent burden
- 680.0
Population outlook (Allen County) Hauer SSP2
- Today (2025)
- 394,020 people
- By 2030
- 405,128 · +2.8%
- By 2040
- 423,476 · +7.5%
- By 2050
- 435,137 · +10.4%
- By 2075
- 450,293 · +14.3%
- By 2100
- 424,101 · +7.6%
Race, ethnicity, and origin ACS 2023
- Neighborhood character
- Diverse neighborhood (Simpson 0.66)
- Race & ethnicity
- White 54% Two or more races 19% Hispanic / Latino 16% Black 14% Asian 4%
- Hispanic origin (detail)
- Mexican 15%
- Common ancestry
- Slovak 3% Lithuanian 3% Romanian 2%
- Foreign-born
- 9% · Canada, Philippines, Jamaica
- Languages at home
- 82% English-only · Spanish 13% Other Asian/Pacific 4% German/W. Germanic 1%
Political lean MEDSL · Allen
- 2024 margin
- R (+12.5) · D 42.9% · R 55.4% · Other 1.7%
- 2008→2024 swing
- -8.1pp toward R · 2008: -4.3pp · 2024: -12.5pp
- All cycles
- 2024: R+12.5 2020: R+11.2 2016: R+19.6 2012: R+16.8 2008: R+4.3
Not yet ingested
- Civics
- —
Market trends
- HPI YoY
- ▼ -318.66%
- Current HPI
- 272.6238
- Rent YoY
- ▲ 8.24%
- Metro
- Fort Wayne, IN
- State GDP YoY
- ▲ 2.90%
- F500 in state
- 18
Industry mix (Fortune 500 HQ in IN)
| Industry | F500 HQs | Revenue |
|---|---|---|
| Industrial Machinery | 2 | $37B |
|
||
| Healthcare | 1 | $177B |
|
||
| Pharmaceuticals | 1 | $45B |
|
||
| Metals / Steel | 1 | $18B |
|
||
| Agriculture | 1 | $17B |
|
||
| Packaging | 1 | $12B |
|
||
Price history
+20.7% since first listed5 events — show timeline
- 2026-05-27 Sold (MLS) $87,500 IRMLS
- 2026-05-20 Pending — IRMLS
- 2026-05-15 Listed $99,900 IRMLS
- 2018-07-27 Sold (MLS) $70,000 IRMLS
- 2018-06-28 Listed $72,500 IRMLS
Property tax history
-9.8%/yrLatest (2024): $592 · -19.0% YoY. Source: county tax records.
Cash-flow waterfall
monthlySold comps — $/sqft
last 12 mo · ≤1 miLoading sold comps…