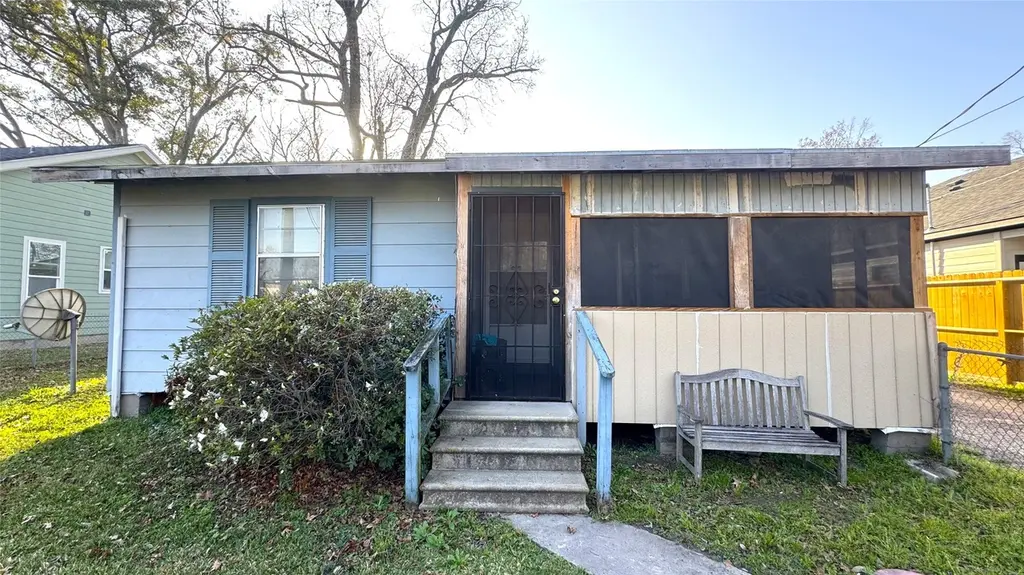
8507 Prairie View Dr · Houston, TX
Flood risk 1/10 · Minimal
- FEMA flood zone
- X (unshaded)
- Chance of flooding over 30 yrs
- 0.0%
- Est. flood insurance / yr
- $507 – $1,088
Fire risk 1/10 · Minimal
- Est. fire insurance / yr
- $1,222 – $2,270
Heat risk 9/10 · Severe
- Hot days now (above 109°F)
- 6 days/yr
- Hot days in 30 yrs
- 21 days/yr
Wind risk 9/10 · Severe
- Chance of severe wind over 30 yrs
- 99.0%
Air-quality risk 3/10 · Minor
- Unhealthy air days now
- 3 days/yr
- Unhealthy air days in 30 yrs
- 4 days/yr
Risk factors via First Street. Map © Google.
Why this score? — see what drove the B- grade
The composite is a weighted blend of 9 inputs, each scored 0–100. Each bar is that input's sub-score; the figure is the points it added to the 100-point composite (weight × sub-score).
- Cash flow +30.0/30.0
- 1% rule +10.0/10.0
- DSCR +10.0/10.0
- ARV discount +7.5/15.0
- Livability +3.7/5.0
- Schools +2.7/10.0
- Condition / age +2.5/5.0
- Rent growth +2.2/5.0
- Appreciation +0.0/10.0
$83,000
🖨 Deal sheet 📄 Offer letter ✓ Due diligence
Listing remarks MLS
Investor special in Lincoln City Subdivision! This one-story home features 2 bedrooms and 1 bath, a spacious living room, and an eat-in kitchen with a breakfast area. Large utility room offers additional storage and functionality. Great opportunity for investors looking for their next project or rental property. Let this be your next investment opportunity!
Key facts
- 7,200 sq ft lot
- Built 1950
- Listed 114 days
Neighborhood map
What this means for you Summary
Snapshot
- This is a 2-bed/1.0-bath single-family listed at $83k.
Deal economics
- At list price, monthly cash flow is $750 ($9k/yr) — positive.
- The deal already cash-flows at list — no discount required.
- Meets the 1% rule at list price ($2k rent vs $83k).
- Recommended offer: $76k (9.0% below list) — sets the bar for market timing.
- Cap rate 17.1% vs local median 3.2% in Houston — top-decile yield for the area; either an underpriced asset or a hidden risk that comps aren't pricing in. Stress-test before assuming the spread holds.
Location & tenants
- Location reads 74/100 on livability (#184 in TX, #4,771 nationally) — a middle-class / working-renter tenant base. Strengths: amenities A+, cost of living A+, housing A+; Watch: schools D, crime F.
- Houston ISD (urban): math 27% / reading 35% proficiency, ranked #593 of 826 in TX (top 72%) — families likely to look elsewhere, expect single-tenant / working-renter base with shorter leases; 71% free/reduced lunch — lower-income household profile, screen leases tightly.
- Market conditions: Rents soft (-1.0%/yr); 468 active listings in the ZIP; 24 comparable units currently listed for rent nearby; rentals lingering (median 44d on market — plan ~5-8 weeks vacancy on turnover, expect pricing pressure); 58% of comp listings sitting > 30 days — soft ceiling on asking rent; 29,883 units permitted in Harris County in 2024 (8,621 in 5+ unit buildings).
- This rent runs 40% of the median local income ($54k/yr) — at the standard rent-burdened threshold; future hikes will face affordability resistance.
Forward outlook
- Local home prices are declining (-3.0%/yr); year-one equity from $574 of loan paydown is wiped out by about $2k of value loss. Plan a longer hold.
- Harris County population projected at +47% by 2050 — long-run rental-demand tailwind backs the buy-and-hold thesis.
- At projected returns (-3.0% appreciation + 0.0% rent growth), your $23k cash investment doubles in ~4 years — after that, you're playing with house money.
Negotiation context
- It's been on market 114 days — a 9% lower offer ($76k) is reasonable based on typical stale-listing flexibility.
Risks & watch-outs
- Watch-outs: property tax is 3.0% of price; built in 1950 — expect roof / HVAC / electrical / plumbing capex.
- Climate carrying-cost: severe wind risk, 99% chance of damaging wind over 30y; extreme-heat days projected 6→21/yr by 2055 (HVAC capex compounding) — expect insurance premiums to compound above CPI over the hold.
Questions for the listing agent
- It's been on market 114 days. Have you received any prior offers? Is the seller open to a 9% concession, seller financing, or rate buy-down credit?
- Built in 1950 — when were the roof, HVAC, electrical panel, plumbing, and water heater last replaced?
- Property tax is high relative to price — has the assessment been appealed recently, and will the sale trigger a re-assessment?
- Why hasn't it sold? Are there any deal-killer items the seller is aware of (foundation, flood, title, zoning, code violations)?
- Is there a deadline driving the sale (1031 exchange, divorce, estate, relocation)? That informs how much negotiation room exists.
- Schools are D-rated, which usually means shorter tenancies and higher turnover. Who's the typical renter profile here, and what's been the actual vacancy rate?
- Crime grade is F in this area — have there been break-ins, vandalism, or insurance claims at this property in the last 3 years? What carrier currently insures it and at what premium?
- What's the average days-on-market for RENTAL listings here right now (not sales)? A rising rental-DOM trend means longer vacancies and softer asking-rent achievability than the comps imply.
- What's the recent tenant-quality profile in this submarket — average credit score on applications, eviction rate, late-payment / NSF rate, and stable-employment percentage? A property-management company in the area should have these aggregated.
- How much new for-sale + rental construction is in the pipeline within 1–3 miles? Heavy new supply typically softens prices + rents 12–24 months out; constrained supply supports both.
Investment metrics
- 1% rule
- 2.17% ✓
- Cap rate
- 17.13%
- Cash-on-cash
- 38.70%
- DSCR
- 2.72
- GRM
- 3.8
CMA / ARV
- ARV (median comp)
- $174,080
- List price
- $83,000
- Delta
- -52.32%
- Verdict
- UNDERPRICED
- Comps
- 20 within 1.0 mi
Show comp detail 12 sales within ~0.75 mi
| Address | Dist | Beds/Ba | Sqft | Sold | Price | $/sf | Match |
|---|---|---|---|---|---|---|---|
| 958 Conklin St | 0.30mi | 3/2.0 (+1) | 1,020 (-3%) | 3mo | $215,000 | $211 | 69 |
| 955 Lucky St | 0.62mi | 3/2.0 (+1) | 1,064 (+1%) | 1mo | $110,000 | $103 | 60 |
| 8602 De Priest St | 0.48mi | 3/2.0 (+1) | 1,080 (+2%) | 6mo | $115,000 | $106 | 59 |
| 8914 De Priest St | 0.54mi | 3/2.0 (+1) | 1,020 (-3%) | 8mo | $150,000 | $147 | 54 |
| 1314 Tarberry Rd | 0.65mi | 3/1.5 (+1) | 1,022 (-3%) | 5mo | $143,999 | $141 | 53 |
| 894 N Victory Dr | 0.63mi | 2/2.0 | 1,130 (+7%) | 5mo | $165,000 | $146 | 51 |
| 1042 Saint Clair St | 0.45mi | 2/1.0 | 912 (-14%) | 13mo | $128,000 | $140 | 45 |
| 809 Fortune St | 0.72mi | 3/2.0 (+1) | 1,023 (-3%) | 9mo | $120,150 | $117 | 45 |
| 1028 N Victory Dr | 0.49mi | 3/2.0 (+1) | 960 (-9%) | 12mo | $200,000 | $208 | 43 |
| 8811 Cottage Gate Ln | 0.73mi | 3/1.5 (+1) | 989 (-6%) | 11mo | $208,000 | $210 | 39 |
| 7921 Virgil St | 0.52mi | 3/2.0 (+1) | 1,197 (+14%) | 6mo | $225,000 | $188 | 39 |
| 7520 E Maxroy St | 0.63mi | 3/2.0 (+1) | 1,206 (+14%) | 12mo | $165,000 | $137 | 27 |
Match score weights: distance 35% · size 25% · config 20% · recency 20%. Top-matched comps best support the ARV.
Projected returns pro-forma
-3.0% appreciation · 0.0% rent growth · sell at horizon
- IRR
- 31.2%
- Equity multiple
- 2.25×
- Total profit
- $29,092
- Equity at exit
- $12,376
- IRR
- 36.5%
- Equity multiple
- 3.87×
- Total profit
- $66,732
- Equity at exit
- $7,176
Cash invested: $23,240 (down + closing). Projections, not guarantees.
Landlord ↔ Tenant lean methodology
- Overall (STATE)
- 87 Strongly Landlord-Friendly
- State Texas
- 87 Strongly Landlord-Friendly · R+5
- County
- — inherits STATE
- City
- — inherits STATE
ZIP-level market 77088
- Home prices YoY
- -23.2%
- Rents YoY
- -1.0%
- Active inventory
- 468
- Price-to-rent
- 3.8×
Monthly cashflow live
- Estimated rent
- $1,805 high interval (Pro) →
- Mortgage (P&I)
- −$435
- Tax from tax record
- −$207 /mo · $2,478/yr
- Insurance
- −$35
- HOA
- −$0
- Vacancy / Maint / Mgmt
- −$379
- Net cashflow
- $750
Break-even live
UW: 25.0% down · 7.5% · 30yr · 1.5% tax · 5.0% vac · 8.0% maint · 8.0% mgmt
Financing live
Cash to close
- Down payment
- $20,750
- Closing costs
- $2,490
- Reserves months
- —
- Total cash needed
- —
Loan-product check · same deal, 3 products live
Conventional
25% down · 7.5% · 30yr
- Down + closing
- —
- Monthly P&I
- —
- Monthly cashflow
- —
- DSCR
- —
- Eligible?
- —
Personal DTI + credit; lowest rate.
DSCR
20% down · 8.5% · 30yr
- Down + closing
- —
- Monthly P&I
- —
- Monthly cashflow
- —
- DSCR
- —
- Eligible?
- —
No personal income docs; deal must DSCR.
Hard money
10% down · 12.0% · 12mo
- Down + closing
- —
- Monthly P&I
- —
- Monthly cashflow
- —
- DSCR
- —
- Eligible?
- —
Short-term bridge; refi at stabilization.
Rent comps 24 comps
| Address | Beds | Baths | Sqft | Rent | $/sqft | DOM | Units | Dist |
|---|---|---|---|---|---|---|---|---|
| 1010 Junell St Unit A Houston, TX | 3.0 | 2.0 | 1040 | $1,550 | $1.49 | 24d | 1 | 0.33mi |
| 929 Marjorie St Unit 1060806P Houston, TX | 3.0 | 2.0 | 1076 | $3,091 | $2.87 | 8d | 1 | 0.35mi |
| 1464 Ferguson Way Houston, TX | 2.0 | 3.0 | 850 | $1,850 | $2.18 | 44d | 1 | 0.42mi |
| 8312 De Priest St Unit B Houston, TX | 3.0 | 3.5 | 1500 | $1,900 | $1.27 | 21d | 1 | 0.46mi |
| 8312 De Priest St Unit A Houston, TX | 3.0 | 2.5 | 1500 | $1,900 | $1.27 | 21d | 1 | 0.46mi |
| 8306 De Priest St Unit A Houston, TX | 3.0 | 2.5 | 1500 | $1,900 | $1.27 | 21d | 1 | 0.46mi |
| 8310 De Priest St Unit B Houston, TX | 3.0 | 2.5 | 1500 | $1,900 | $1.27 | 21d | 1 | 0.46mi |
| 8122 De Priest St Unit A Houston, TX | 3.0 | 3.5 | 1500 | $1,900 | $1.27 | 44d | 1 | 0.47mi |
| 8120 De Priest St Unit A Houston, TX | 3.0 | 2.5 | 1500 | $1,750 | $1.17 | 44d | 1 | 0.47mi |
| 8120 De Priest St Unit B Houston, TX | 3.0 | 2.5 | 1500 | $1,900 | $1.27 | 44d | 1 | 0.47mi |
| 8118 De Priest St Unit B Houston, TX | 3.0 | 2.5 | 1500 | $1,900 | $1.27 | 44d | 1 | 0.47mi |
| 8110 De Priest St Unit A Houston, TX | 3.0 | 2.5 | 1500 | $1,900 | $1.27 | 44d | 1 | 0.48mi |
| 8108 De Priest St Unit B Houston, TX | 3.0 | 2.5 | 1500 | $1,900 | $1.27 | 44d | 1 | 0.48mi |
| 8112 De Priest St Unit B Houston, TX | 3.0 | 2.5 | 1500 | $1,900 | $1.27 | 44d | 1 | 0.48mi |
| 1450 Dewalt St Houston, TX | 3.0 | 2.5 | 1371 | $2,500 | $1.82 | 44d | 1 | 0.54mi |
| 783 Fortune St Unit A Houston, TX | 3.0 | 2.5 | 1328 | $1,795 | $1.35 | 17d | 1 | 0.77mi |
| 7486 N Shepherd Dr Houston, TX | 3.0 | 2.0 | 1177 | $1,290 | $1.10 | 44d | 1 | 1.11mi |
| 2407 Ferguson Way Houston, TX | 3.0 | 2.5 | 1195 | $1,650 | $1.38 | 44d | 1 | 1.14mi |
| 2320 Wavell St Unit A Houston, TX | 3.0 | 2.5 | 1150 | $1,900 | $1.65 | 44d | 1 | 1.20mi |
| 2320 Wavell St Unit B Houston, TX | 3.0 | 2.5 | 1150 | $1,683 | $1.46 | 44d | 1 | 1.20mi |
| 1825 W Little York Rd Houston, TX | 2.0 | 1.0 | 787 | $880 | $1.12 | 44d | 1 | 1.24mi |
| 7903 Moon Beam St Houston, TX | 3.0 | 2.5 | 1217 | $1,700 | $1.40 | 17d | 1 | 1.25mi |
| 8101 Venus St Unit B Houston, TX | 3.0 | 2.0 | 1375 | $1,595 | $1.16 | 24d | 1 | 1.38mi |
| 8101 Venus St Unit A Houston, TX | 3.0 | 2.0 | 1375 | $1,699 | $1.24 | 24d | 1 | 1.38mi |
Listing history 17 events
-
2026-06-18days on market $83,000 Active 114 DOM
-
2026-06-17days on market $83,000 Active 113 DOM
-
2026-06-16days on market $83,000 Active 112 DOM
-
2026-06-15days on market $83,000 Active 111 DOM
-
2026-06-13days on market $83,000 Active 109 DOM
-
2026-06-10days on market $83,000 Active 105 DOM
-
2026-06-08days on market $83,000 Active 104 DOM
-
2026-06-07days on market $83,000 Active 103 DOM
-
2026-06-04pricedays on market $83,000 Active 100 DOM
-
2026-06-01days on market $93,000 Active 97 DOM
-
2026-05-31days on market $93,000 Active 96 DOM
-
2026-05-01price $93,000 359-char remark
Show marketing remark (359 chars)
Investor special in Lincoln City Subdivision! This one-story home features 2 bedrooms and 1 bath, a spacious living room, and an eat-in kitchen with a breakfast area. Large utility room offers additional storage and functionality. Great opportunity for investors looking for their next project or rental property. Let this be your next investment opportunity!
-
2026-03-25price $110,000 359-char remark
Show marketing remark (359 chars)
Investor special in Lincoln City Subdivision! This one-story home features 2 bedrooms and 1 bath, a spacious living room, and an eat-in kitchen with a breakfast area. Large utility room offers additional storage and functionality. Great opportunity for investors looking for their next project or rental property. Let this be your next investment opportunity!
-
2026-03-07price $120,000 359-char remark
Show marketing remark (359 chars)
Investor special in Lincoln City Subdivision! This one-story home features 2 bedrooms and 1 bath, a spacious living room, and an eat-in kitchen with a breakfast area. Large utility room offers additional storage and functionality. Great opportunity for investors looking for their next project or rental property. Let this be your next investment opportunity!
-
2026-03-03price $125,000 359-char remark
Show marketing remark (359 chars)
Investor special in Lincoln City Subdivision! This one-story home features 2 bedrooms and 1 bath, a spacious living room, and an eat-in kitchen with a breakfast area. Large utility room offers additional storage and functionality. Great opportunity for investors looking for their next project or rental property. Let this be your next investment opportunity!
-
2026-02-24$130,000 Active 359-char remark
Show marketing remark (359 chars)
Investor special in Lincoln City Subdivision! This one-story home features 2 bedrooms and 1 bath, a spacious living room, and an eat-in kitchen with a breakfast area. Large utility room offers additional storage and functionality. Great opportunity for investors looking for their next project or rental property. Let this be your next investment opportunity!
-
1991-04-01soldstatus
ⓘ Source: listings_history table (triggers on properties + properties_extension) + one-shot
backfill from property_details.listing_events for pre-trigger history.
Tax reassessment forecast TX · Resets to sale price
- Current annual tax
- $2,478 · $207/mo
- Projected year-2 tax
- $2,478 · $207/mo
- Expected delta
- $0/yr ($0/mo · 0.0%)
ⓘ Screening estimate from a state-policy table — verify with the county assessor before closing.
Climate risk First Street
- Flood 1/10 Low FEMA zone X (unshaded) · 0% chance over 30 yrs
- Wildfire 1/10 Low
- Heat 9/10 Extreme 6 d/yr ≥109°F today · 21 d/yr by 30 yrs out
- Wind 9/10 Extreme 99% chance of damaging wind over 30 yrs
- Air quality 3/10 Moderate 3 unhealthy d/yr today · 4 by 30 yrs out
Nearby sold comps map
Loading sold comps map…
Walkable amenities ~0.75 mi
Loading nearby amenities…
Taxation est. · year 1
- Rental income
- $21,660
- − Mortgage interest
- −$4,649
- − Property taxes
- −$2,478
- − Insurance
- −$415
- − Repairs & maintenance
- −$1,733
- − Management
- −$1,733
- − Depreciation
- −$2,415
- Taxable income
- $8,237
- Est. tax owed @ 24.0%
- −$1,977
- After-tax cash flow
- $7,018/yr
For passive investors: Depreciation is non-cash, so a rental often shows a tax loss while cash-flowing — sheltering income. Rental losses are passive: they offset passive income freely, and up to $25,000/yr can offset ordinary (W-2) income if you actively participate and your MAGI is under $100k (phasing out to $0 by $150k); unused losses carry forward. On sale, claimed depreciation is recaptured at up to 25%, and gains may owe capital-gains tax (a 1031 exchange can defer both). Figures are a year-1 estimate at your 24.0% rate — not tax advice; consult a CPA.
Schools (NCES district)
- District
- Houston ISD
- NCES district ID
- 4823640
- Math proficiency
- 27% ▼ -18.00%
- Reading proficiency
- 35% ▼ -6.00%
- Median HH income
- $46,054
- Composite
- 26.63/100
- National rank
- #7173
- State rank
- #593 of 826 in TX
Livability — Houston
- Score
- 74/100
- State rank
- #184
- US rank
- #4771
Category grades
Schools grade is shown separately in the Schools card above.
Census & demographics
- Census place
- Houston, TX
- County
- Harris County · 4,702,590 people
- City population
- 3,226,434
- Metro
- Houston-The Woodlands-Sugar Land, TX
- Population (ZIP)
- 57,047
- Household income
- $54,411
- Rent vs Own
- Severe rent burden
- 2294.0
Population outlook (Harris County) Hauer SSP2
- Today (2025)
- 5,571,493 people
- By 2030
- 6,089,821 · +9.3%
- By 2040
- 7,142,806 · +28.2%
- By 2050
- 8,185,864 · +46.9%
- By 2075
- 10,574,329 · +89.8%
- By 2100
- 12,109,958 · +117.4%
Race, ethnicity, and origin ACS 2023
- Neighborhood character
- Diverse neighborhood (Simpson 0.59)
- Race & ethnicity
- Hispanic / Latino 52% Black 37% Two or more races 18% White 6% Asian 4%
- Hispanic origin (detail)
- Mexican 36%
- Common ancestry
- Lithuanian 1%
- Foreign-born
- 25% · Canada, Vietnam, China
- Languages at home
- 49% English-only · Spanish 47% Vietnamese 3%
Political lean MEDSL · Harris
- 2024 margin
- Lean D (+5.5) · D 52.0% · R 46.4% · Other 1.6%
- 2008→2024 swing
- +3.9pp toward D · 2008: 1.6pp · 2024: 5.5pp
- All cycles
- 2024: D+5.5 2020: D+13.3 2016: D+12.4 2012: D+0.1 2008: D+1.6
Not yet ingested
- Civics
- —
Market trends
- HPI YoY
- ▼ -98.37%
- Current HPI
- 325.0499
- Rent YoY
- ▼ -1.01%
- Metro
- Houston-The Woodlands-Sugar Land, TX
- State GDP YoY
- ▲ 3.95%
- F500 in state
- 110
Industry mix (Fortune 500 HQ in TX)
| Industry | F500 HQs | Revenue |
|---|---|---|
| Energy | 16 | $1,198B |
|
||
| Technology | 5 | $198B |
|
||
| Engineering / Construction | 4 | $72B |
|
||
| Energy Services | 3 | $60B |
|
||
| Utilities | 3 | $41B |
|
||
| Healthcare | 2 | $330B |
|
||
Price history
-28.5% since first listed6 events — show timeline
- 2026-05-01 Price Changed $93,000 HARMLS
- 2026-03-25 Price Changed $110,000 HARMLS
- 2026-03-07 Price Changed $120,000 HARMLS
- 2026-03-03 Price Changed $125,000 HARMLS
- 2026-02-24 Listed $130,000 HARMLS
- 1991-04-01 Sold (Public Records) — Public Records
Property tax history
+5.7%/yrLatest (2025): $2,478 · +0.6% YoY. Source: county tax records.
Cash-flow waterfall
monthlySold comps — $/sqft
last 12 mo · ≤1 miLoading sold comps…