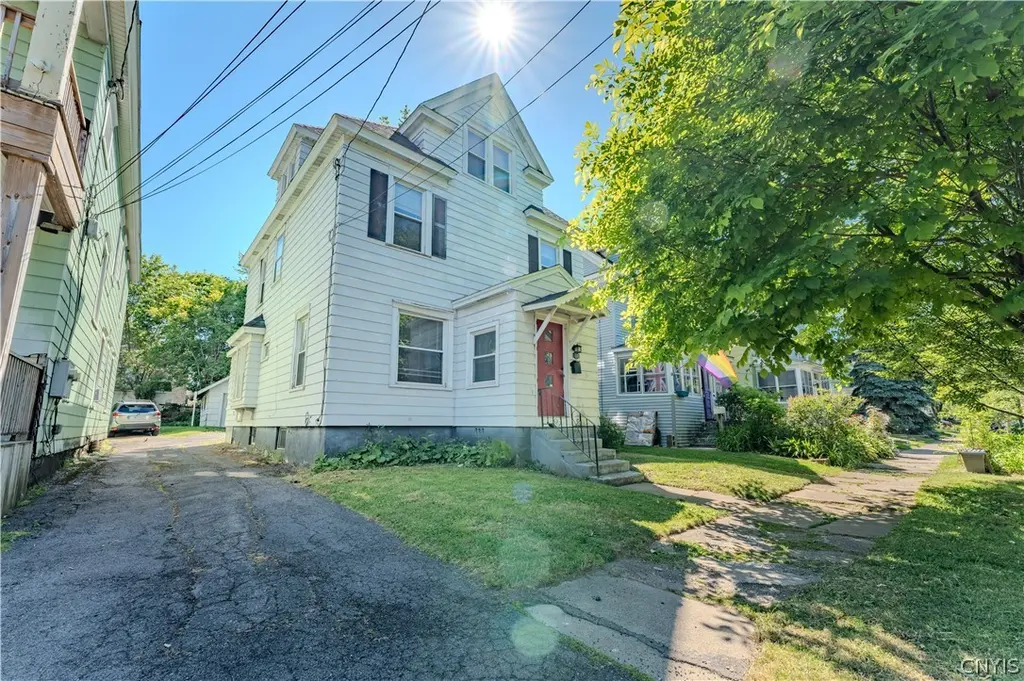
113 Paul Ave · Syracuse, NY
Flood risk 1/10 · Minimal
- FEMA flood zone
- X (unshaded)
- Chance of flooding over 30 yrs
- 0.0%
- Est. flood insurance / yr
- $473 – $860
Fire risk 1/10 · Minimal
- Est. fire insurance / yr
- $691 – $1,283
Heat risk 3/10 · Minor
- Hot days now (above 95°F)
- 7 days/yr
- Hot days in 30 yrs
- 16 days/yr
Wind risk 1/10 · Minimal
- Chance of severe wind over 30 yrs
- 0.0%
Air-quality risk 2/10 · Minimal
- Unhealthy air days now
- 0 days/yr
- Unhealthy air days in 30 yrs
- 1 days/yr
Risk factors via First Street. Map © Google.
Why this score? — see what drove the C- grade
The composite is a weighted blend of 9 inputs, each scored 0–100. Each bar is that input's sub-score; the figure is the points it added to the 100-point composite (weight × sub-score).
- Cash flow +18.5/30.0
- ARV discount +12.2/15.0
- DSCR +5.8/10.0
- 1% rule +4.1/10.0
- Rent growth +4.0/5.0
- Livability +3.9/5.0
- Condition / age +2.5/5.0
- Schools +1.8/10.0
- Appreciation +0.0/10.0
$199,900
🖨 Deal sheet 📄 Offer letter ✓ Due diligence
Listing remarks
Welcome to 113 Paul Avenue in the highly desires Eastwood neighborhood, this property has so much to offer! Upon entry you are greeted by a convenient breezeway providing a perfect place to kick off your shoes or hang your coat without cooling the whole house down in the colder months. Next, you are greeted by very well maintained, gleaming hardwood floors throughout most of the first level! The first level also offers a sizable kitchen only steps away from the living room giving you the perfect place to entertain! There is also a half bath located on the first level. Upstairs there are four huge bedrooms with ample closets and lovely wood trim work showing how much the home has been cared
Key facts
- Sizable kitchen
- Half bath
- Full bathroom
Tags
Property features AI
Finance
- Other: Lot is rectangular and near public transit; City street frontage; Lot dimensions approximately 34 x 132
- Financial info: Annual tax information available
Exterior
- Parking: Detached garage; 1 garage space
- Utilities: Cable available; High-speed internet available; Public water (connected); Sewer connected
- Home design: 2 stories; Aluminum siding; Resale property
- Construction: Stone foundation; Aluminum siding exterior
- Exterior features: Blacktop driveway; Deck; Enclosed porch; Open porch
Interior
- Kitchen: Dishwasher; Gas oven; Gas range; Microwave; Refrigerator; Eat-in kitchen
- Bedrooms: Total rooms include living areas and a den (see room types)
- Flooring: Hardwood; Tile; Vinyl; Varies
- Bathrooms: 1 full bathroom; 1 half bathroom; Main level bathroom present
- Heating & cooling: Gas heating; Forced air heating
- Interior features: Cedar closet(s); Ceiling fan(s); Den; Separate / formal dining room; Entrance foyer; Eat-in kitchen; Separate / formal living room; Natural woodwork; Thermal windows
- Laundry & utility: Laundry on main level; Gas water heater
Neighborhood map
What this means for you Summary
Snapshot
- This is a 3-bed/1.5-bath single-family listed at $200k.
Deal economics
- At list price, monthly cash flow is $190 ($2k/yr) — positive.
- The deal already cash-flows at list — no discount required.
- To meet the 1% rule (rent ≥ 1% of price), the offer needs to be $181k (9.2% below list).
- Recommended offer: $181k (9.2% below list) — sets the bar for 1% rule.
Location & tenants
- Location reads 77/100 on livability (#187 in NY, #2,869 nationally) — a middle-class / working-renter tenant base. Strengths: amenities A+, commute A+, cost of living A+; Watch: schools D+, crime F, employment D-.
- Syracuse City School District (urban): math 18% / reading 26% proficiency, ranked #590 of 590 in NY (top 100%) — low school quality limits family demand, transient renter base, plan for 1-2y turnover; 74% free/reduced lunch — lower-income household profile, screen leases tightly.
- Market conditions: Rents rising fast (+5.8%/yr); 42 active listings in the ZIP; 14 comparable units currently listed for rent nearby; rentals at typical pace (median 21d on market — plan ~3-4 weeks tenant-placement turnaround); 616 units permitted in Onondaga County in 2024 (256 in 5+ unit buildings).
- This rent runs 34% of the median local income ($63k/yr) — at the standard rent-burdened threshold; future hikes will face affordability resistance.
Forward outlook
- Local home prices are declining (-3.0%/yr); year-one equity from $1k of loan paydown is wiped out by about $6k of value loss. Plan a longer hold.
- Onondaga County population projected to shrink 9% by 2050 — rents likely to lag national; underwrite the cash flow, not the appreciation.
Negotiation context
- Only 9 days on market — expect competitive offers; lowballing is unlikely to land.
- 6 sale attempts since 16y ago with the ask held roughly flat each time — persistent listings suggest the price (not the market) is what's stuck; bring a comps-based counter.
- Current owner paid $115k; list at $200k implies a 74% gain — meaningful room to come down on a strong offer.
Risks & watch-outs
- Watch-outs: built in 1930 — expect roof / HVAC / electrical / plumbing capex.
Questions for the listing agent
- Built in 1930 — when were the roof, HVAC, electrical panel, plumbing, and water heater last replaced?
- Is there a deadline driving the sale (1031 exchange, divorce, estate, relocation)? That informs how much negotiation room exists.
- Schools are D-rated, which usually means shorter tenancies and higher turnover. Who's the typical renter profile here, and what's been the actual vacancy rate?
- Crime grade is F in this area — have there been break-ins, vandalism, or insurance claims at this property in the last 3 years? What carrier currently insures it and at what premium?
- What's the average days-on-market for RENTAL listings here right now (not sales)? A rising rental-DOM trend means longer vacancies and softer asking-rent achievability than the comps imply.
- What's the recent tenant-quality profile in this submarket — average credit score on applications, eviction rate, late-payment / NSF rate, and stable-employment percentage? A property-management company in the area should have these aggregated.
- How much new for-sale + rental construction is in the pipeline within 1–3 miles? Heavy new supply typically softens prices + rents 12–24 months out; constrained supply supports both.
Investment metrics
- 1% rule
- 0.91% ✗
- Cap rate
- 7.43%
- Cash-on-cash
- 4.07%
- DSCR
- 1.18
- GRM
- 9.2
CMA / ARV
- ARV (on-the-fly)
- $223,200
- Comps found
- 12
Show comp detail 12 sales within ~0.75 mi
| Address | Dist | Beds/Ba | Sqft | Sold | Price | $/sf | Match |
|---|---|---|---|---|---|---|---|
| 125 Paul Ave | 0.04mi | 4/1.5 (+1) | 1,527 (+6%) | 1mo | $210,000 | $138 | 82 |
| 337 Lillian Ave | 0.48mi | 3/1.5 | 1,436 (-0%) | 3mo | $100,000 | $70 | 74 |
| 127 Schuler St | 0.57mi | 4/1.5 (+1) | 1,448 (+1%) | 1mo | $225,000 | $155 | 67 |
| 204 Kline St | 0.46mi | 3/2.0 | 1,524 (+6%) | 2mo | $278,750 | $183 | 65 |
| 215 Tower Ave | 0.59mi | 3/1.0 | 1,416 (-2%) | 3mo | $241,500 | $171 | 65 |
| 362 Hickok Ave | 0.49mi | 3/1.0 | 1,320 (-8%) | 3mo | $199,900 | $151 | 58 |
| 409 Hixson Ave | 0.37mi | 3/1.5 | 1,232 (-14%) | 1mo | $155,000 | $126 | 58 |
| 129 Noble Ave | 0.54mi | 3/2.0 | 1,276 (-11%) | 1mo | $205,000 | $161 | 53 |
| 136 S Collingwood Ave | 0.58mi | 4/1.0 (+1) | 1,344 (-7%) | 3mo | $60,236 | $45 | 53 |
| 305 Ashdale Ave | 0.65mi | 2/1.0 (-1) | 1,361 (-6%) | 2mo | $210,000 | $154 | 52 |
| 158 Norwood Ave | 0.52mi | 4/1.0 (+1) | 1,292 (-10%) | 3mo | $200,000 | $155 | 49 |
| 303 Snyder Ave | 0.66mi | 3/1.0 | 1,225 (-15%) | 4mo | $220,000 | $180 | 39 |
Match score weights: distance 35% · size 25% · config 20% · recency 20%. Top-matched comps best support the ARV.
Projected returns pro-forma
-3.0% appreciation · 5.85% rent growth · sell at horizon
- IRR
- -7.1%
- Equity multiple
- 0.73×
- Total profit
- $-15,005
- Equity at exit
- $29,806
- IRR
- 5.5%
- Equity multiple
- 1.46×
- Total profit
- $25,556
- Equity at exit
- $17,284
Cash invested: $55,972 (down + closing). Projections, not guarantees.
Landlord ↔ Tenant lean methodology
- Overall (STATE)
- 15 Strongly Tenant-Friendly
- State New York
- 15 Strongly Tenant-Friendly · D+10
- County
- — inherits STATE
- City
- — inherits STATE
ZIP-level market 13206
- Home prices YoY
- -7.1%
- Rents YoY
- 5.8%
- Active inventory
- 42
- Price-to-rent
- 9.2×
Monthly cashflow live
- Estimated rent
- $1,814 high interval (Pro) →
- Mortgage (P&I)
- −$1,048
- Tax from tax record
- −$112 /mo · $1,344/yr
- Insurance
- −$83
- HOA
- −$0
- Vacancy / Maint / Mgmt
- −$381
- Net cashflow
- $190
Break-even live
UW: 25.0% down · 7.5% · 30yr · 1.5% tax · 5.0% vac · 8.0% maint · 8.0% mgmt
Financing live
Cash to close
- Down payment
- $49,975
- Closing costs
- $5,997
- Reserves months
- —
- Total cash needed
- —
Loan-product check · same deal, 3 products live
Conventional
25% down · 7.5% · 30yr
- Down + closing
- —
- Monthly P&I
- —
- Monthly cashflow
- —
- DSCR
- —
- Eligible?
- —
Personal DTI + credit; lowest rate.
DSCR
20% down · 8.5% · 30yr
- Down + closing
- —
- Monthly P&I
- —
- Monthly cashflow
- —
- DSCR
- —
- Eligible?
- —
No personal income docs; deal must DSCR.
Hard money
10% down · 12.0% · 12mo
- Down + closing
- —
- Monthly P&I
- —
- Monthly cashflow
- —
- DSCR
- —
- Eligible?
- —
Short-term bridge; refi at stabilization.
Rent comps 14 comps
| Address | Beds | Baths | Sqft | Rent | $/sqft | DOM | Units | Dist |
|---|---|---|---|---|---|---|---|---|
| 1801 James St #2 Syracuse, NY | 3.0 | 1.0 | 1244 | $1,800 | $1.45 | 13d | 1 | 0.21mi |
| 202 Stafford Ave Syracuse, NY | 3.0 | 1.0 | 1692 | $1,800 | $1.06 | 13d | 1 | 0.35mi |
| 225 Marlborough Rd Syracuse, NY | 2.0 | 1.0 | 1040 | $1,800 | $1.73 | 13d | 1 | 0.39mi |
| 204 Mariposa St Unit pvt house Syracuse, NY | 3.0 | 1.0 | 1128 | $2,137 | $1.89 | 13d | 1 | 0.42mi |
| 1618 James St #3 Syracuse, NY | 2.0 | 1.0 | 1150 | $2,200 | $1.91 | 13d | 1 | 0.44mi |
| 297 Norwood Ave Syracuse, NY | 3.0 | 1.0 | 1188 | $2,050 | $1.73 | 21d | 1 | 0.58mi |
| 423 Wendell Ter Syracuse, NY | 4.0 | 1.0 | 1312 | $2,500 | $1.91 | 13d | 1 | 0.58mi |
| 417 Hazelhurst Ave Syracuse, NY | 2.0 | 1.0 | 1536 | $1,250 | $0.81 | 21d | 1 | 0.66mi |
| 112 Gale Ave Unit 1 Syracuse, NY | 2.0 | 1.0 | 1848 | $1,400 | $0.76 | 43d | 1 | 0.80mi |
| 126 Woodruff Ave Syracuse, NY | 3.0 | 1.0 | 1200 | $1,675 | $1.40 | 43d | 1 | 0.94mi |
| 746 E Laurel St Unit 1 Syracuse, NY | 4.0 | 2.0 | 1400 | $1,500 | $1.07 | 43d | 1 | 1.33mi |
| 213 Beattie St Syracuse, NY | 2.0 | 1.0 | 975 | $1,370 | $1.41 | 13d | 1 | 1.35mi |
| 525 Burnet Ave Unit First Floor Syracuse, NY | 3.0 | 1.0 | 900 | $1,650 | $1.83 | 43d | 1 | 1.43mi |
| 912 Park St Unit 1 Syracuse, NY | 3.0 | 1.0 | 1040 | $1,200 | $1.15 | 43d | 1 | 1.48mi |
Listing history 8 events
-
2026-06-18days on market $199,900 Active 9 DOM
-
2026-06-17days on market $199,900 Active 8 DOM
-
2026-06-16days on market $199,900 Active 7 DOM
-
2026-06-15days on market $199,900 Active 6 DOM
-
2026-06-14days on market $199,900 Active 4 DOM
-
2026-06-13days on market $199,900 Active 3 DOM
-
2026-06-10remarks 699-char remark
-
2026-06-10$199,900 Active 1 DOM
ⓘ Source: listings_history table (triggers on properties + properties_extension) + one-shot
backfill from property_details.listing_events for pre-trigger history.
Tax reassessment forecast NY · Partial reset (capped growth)
- Current annual tax
- $1,344 · $112/mo
- Projected year-2 tax
- $2,361 · $197/mo
- Expected delta
- +$1,017/yr (+$85/mo · 75.7%)
ⓘ Screening estimate from a state-policy table — verify with the county assessor before closing.
Climate risk First Street
- Flood 1/10 Low FEMA zone X (unshaded) · 0% chance over 30 yrs
- Wildfire 1/10 Low
- Heat 3/10 Moderate 7 d/yr ≥95°F today · 16 d/yr by 30 yrs out
- Wind 1/10 Low 0% chance of damaging wind over 30 yrs
- Air quality 2/10 Low 0 unhealthy d/yr today · 1 by 30 yrs out
Nearby sold comps map
Loading sold comps map…
Walkable amenities ~0.75 mi
Loading nearby amenities…
Taxation est. · year 1
- Rental income
- $21,774
- − Mortgage interest
- −$11,198
- − Property taxes
- −$1,344
- − Insurance
- −$1,000
- − Repairs & maintenance
- −$1,742
- − Management
- −$1,742
- − Depreciation
- −$5,815
- Taxable loss
- −$1,066
- Est. tax savings @ 24.0%
- +$256
- After-tax cash flow
- $2,534/yr
For passive investors: Depreciation is non-cash, so a rental often shows a tax loss while cash-flowing — sheltering income. Rental losses are passive: they offset passive income freely, and up to $25,000/yr can offset ordinary (W-2) income if you actively participate and your MAGI is under $100k (phasing out to $0 by $150k); unused losses carry forward. On sale, claimed depreciation is recaptured at up to 25%, and gains may owe capital-gains tax (a 1031 exchange can defer both). Figures are a year-1 estimate at your 24.0% rate — not tax advice; consult a CPA.
Schools (NCES district)
- District
- Syracuse City School District
- NCES district ID
- 3628590
- Math proficiency
- 18% ▼ -5.00%
- Reading proficiency
- 26% ▬ 0.00%
- Median HH income
- $32,097
- Composite
- 17.83/100
- National rank
- #9007
- State rank
- #590 of 590 in NY
Livability — Syracuse
- Score
- 77/100
- State rank
- #187
- US rank
- #2869
Category grades
Schools grade is shown separately in the Schools card above.
Census & demographics
- Census place
- Syracuse, NY
- County
- Onondaga County · 247,257 people
- City population
- 152,627
- Metro
- Syracuse, NY
- Population (ZIP)
- 16,245
- Household income
- $63,136
- Rent vs Own
- Severe rent burden
- 725.0
Population outlook (Onondaga County) Hauer SSP2
- Today (2025)
- 467,894 people
- By 2030
- 463,381 · -1.0%
- By 2040
- 447,697 · -4.3%
- By 2050
- 426,399 · -8.9%
- By 2075
- 373,661 · -20.1%
- By 2100
- 307,967 · -34.2%
Race, ethnicity, and origin ACS 2023
- Neighborhood character
- Predominantly White (67%)
- Race & ethnicity
- White 67% Black 13% Two or more races 9% Hispanic / Latino 8% Asian 5%
- Hispanic origin (detail)
- Puerto Rican 4%
- Common ancestry
- Romanian 6% Lithuanian 4% Slovak 2%
- Foreign-born
- 8% · Canada, Jamaica, China
- Languages at home
- 89% English-only · Spanish 3% Arabic 2% Other Indo-European 1%
Political lean MEDSL · Onondaga
- 2024 margin
- D (+17.3) · D 58.6% · R 41.4%
- 2008→2024 swing
- -3.0pp toward R · 2008: 20.3pp · 2024: 17.3pp
- All cycles
- 2024: D+17.3 2020: D+20.6 2016: D+12.8 2012: D+21.1 2008: D+20.3
Not yet ingested
- Civics
- —
Market trends
- HPI YoY
- ▼ -24.60%
- Current HPI
- 322.231
- Rent YoY
- ▲ 5.85%
- Metro
- Syracuse, NY
- State GDP YoY
- ▲ 2.60%
- F500 in state
- 92
Industry mix (Fortune 500 HQ in NY)
| Industry | F500 HQs | Revenue |
|---|---|---|
| Financial Services | 10 | $950B |
|
||
| Consumer Goods | 9 | $162B |
|
||
| Insurance | 4 | $225B |
|
||
| Telecommunications | 2 | $144B |
|
||
| Pharmaceuticals | 2 | $112B |
|
||
| Media / Entertainment | 2 | $69B |
|
||
Price history
+177.6% since first listed24 events — show timeline
- 2026-06-09 Listed $199,900 CNYIS
- 2023-10-27 Listing Removed — CNYIS
- 2023-08-31 Price Changed $169,900 CNYIS
- 2023-08-08 Listed $174,900 CNYIS
- 2022-11-01 Listing Removed — CNYIS
- 2022-10-23 Price Changed $179,900 CNYIS
- 2022-10-06 Price Changed $184,900 CNYIS
- 2022-09-16 Price Changed $189,900 CNYIS
- 2022-09-01 Listed $194,900 CNYIS
- 2022-08-16 Sold (Public Records) $115,000 Public Records
- 2022-08-10 Sold (MLS) $115,000 CNYIS
- 2022-06-28 Contingent — CNYIS
- 2022-06-22 Listed $125,000 CNYIS
- 2022-04-19 Pending — CNYIS
- 2022-04-11 Contingent — CNYIS
- 2022-04-11 Listing Removed — CNYIS
- 2022-04-09 Price Changed $125,000 CNYIS
- 2022-04-03 Listed $129,900 CNYIS
- 2010-11-11 Listing Removed — CNYIS
- 2010-11-10 Sold (MLS) $33,000 CNYIS
- 2010-10-13 Sold (Public Records) $46,588 Public Records
- 2010-09-20 Listed $29,499 CNYIS
- 1995-08-29 Sold (Public Records) $72,100 Public Records
- 1995-08-29 Sold (Public Records) $72,000 Public Records
Property tax history
+0.3%/yrLatest (2025): $1,344 · +0.0% YoY. Source: county tax records.
Cash-flow waterfall
monthlySold comps — $/sqft
last 12 mo · ≤1 miLoading sold comps…