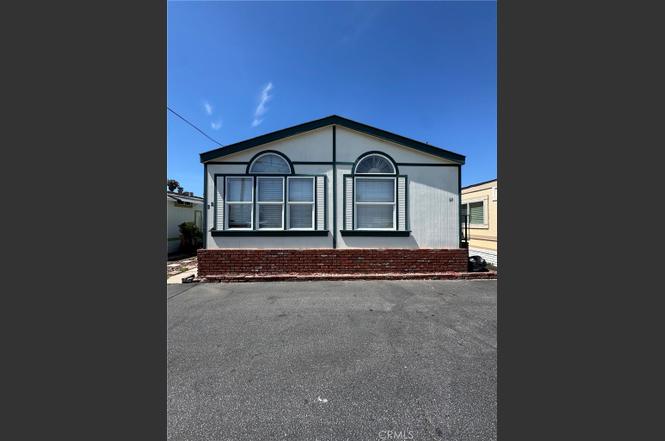
15141 Beach Blvd #44 · Midway City, CA
Flood risk 1/10 · Minimal
- FEMA flood zone
- X (shaded)
- Chance of flooding over 30 yrs
- 0.0%
- Est. flood insurance / yr
- $507 – $1,088
Fire risk 1/10 · Minimal
- Est. fire insurance / yr
- $659 – $1,223
Heat risk 5/10 · Moderate
- Hot days now (above 87°F)
- 7 days/yr
- Hot days in 30 yrs
- 23 days/yr
Wind risk 1/10 · Minimal
- Chance of severe wind over 30 yrs
- —
Air-quality risk 4/10 · Minor
- Unhealthy air days now
- 5 days/yr
- Unhealthy air days in 30 yrs
- 7 days/yr
Risk factors via First Street. Map © Google.
Why this score? — see what drove the B grade
The composite is a weighted blend of 9 inputs, each scored 0–100. Each bar is that input's sub-score; the figure is the points it added to the 100-point composite (weight × sub-score).
- Cash flow +30.0/30.0
- 1% rule +10.0/10.0
- DSCR +10.0/10.0
- Appreciation +10.0/10.0
- Schools +6.5/10.0
- Livability +3.0/5.0
- Rent growth +2.5/5.0
- Condition / age +2.5/5.0
- ARV discount +0.0/15.0
$100,000
🖨 Deal sheet (PDF) 📄 Offer letter ✓ Due diligence
Listing remarks
Welcome to 15141 Beach Boulevard, Space 44 – a cozy and well-maintained 2-bedroom, 1-bathroom home located in a clean and quiet all-age park. Remodeled Kitchen, This move-in ready space offers comfort, convenience, and an unbeatable location. Just minutes from Little Saigon, major freeways, shopping centers, dining, and entertainment. Only 15 minutes from the sandy shores of Huntington Beach, making weekend beach trips a breeze! Low park fees and a friendly community make this an ideal opportunity for first-time buyers or anyone seeking affordable living in Orange County.
Key facts
- Remodeled kitchen
- Unbeatable location
- Minutes from dining
Tags
Property features AI
Finance
- Financial info: Monthly land lease of $2,000
- HOA & community: Street lighting in the community; Located in LE CHATEAY ESTATE (land-lease community)
Exterior
- Parking: Paved parking; 1 uncovered parking space
- Utilities: Public sewer; Private water
- Home design: Single-story mobile home; Mobile home remains on site; Entry on level 1
- Construction: Mobile home approximately 24 by 32 (width x length)
- Exterior features: No pool; Paved lot/yard
Interior
- Kitchen: Microwave; Refrigerator; Gas range
- Bedrooms: Bedrooms located on the main level
- Bathrooms: 1 full bathroom
- Heating & cooling: Central cooling
- Interior features: All bedrooms on main level; Living room; Entry at street level
- Laundry & utility: In-unit laundry in a dedicated room
Neighborhood map
What this means for you Summary
Snapshot
- This is a 2-bed/1.0-bath manufactured listed at $100k.
Deal economics
- At list price, monthly cash flow is $1k ($17k/yr) — positive.
- The deal already cash-flows at list — no discount required.
- Meets the 1% rule at list price ($3k rent vs $100k).
- Recommended offer: $88k (12.0% below list) — sets the bar for market timing.
Location & tenants
- Location reads 59/100 on livability (#624 in CA) — a working-class tenant base; expect higher turnover. Strengths: commute A+; Watch: crime D+, amenities D, employment F.
- Huntington Beach Union High (suburban): math 65% / reading 82% proficiency, ranked #39 of 517 in CA (top 8%) — strong family-tenant draw, lease renewals of 3-5y typical.
- Market conditions: 15 active listings in the ZIP; 39 comparable units currently listed for rent nearby; rentals leasing fast (median 2d on market — plan ~1-2 weeks tenant-placement turnaround); 6,974 units permitted in Orange County in 2024 (3,839 in 5+ unit buildings).
Forward outlook
- In year one you build about $11k of equity ($691 loan paydown + $10k appreciation (10.0% local appreciation)).
- Orange County population projected at +14% by 2050 — modest demand growth; plan on rents tracking national, not racing it.
- At projected returns (10.0% appreciation + 3.0% rent growth), your $28k cash investment doubles in ~2 years — after that, you're playing with house money.
- By year 4, paydown + projected appreciation supports a ~$38k cash-out refi (75% LTV) — recoverable capital for the next deal without selling this one.
Negotiation context
- It's been on market 335 days — a 12% lower offer ($88k) is reasonable based on typical stale-listing flexibility.
- 7 sale attempts since 24y ago; this cycle's ask has dropped $23k (19%) from the opening price — seller is motivated, your offer sets the floor, not the list.
Risks & watch-outs
- Climate carrying-cost: extreme-heat days projected 7→23/yr by 2055 (HVAC capex compounding) — expect insurance premiums to compound above CPI over the hold.
Questions for the listing agent
- It's been on market 335 days. Have you received any prior offers? Is the seller open to a 12% concession, seller financing, or rate buy-down credit?
- Why hasn't it sold? Are there any deal-killer items the seller is aware of (foundation, flood, title, zoning, code violations)?
- Is there a deadline driving the sale (1031 exchange, divorce, estate, relocation)? That informs how much negotiation room exists.
- Crime grade is D in this area — have there been break-ins, vandalism, or insurance claims at this property in the last 3 years? What carrier currently insures it and at what premium?
- What's the average days-on-market for RENTAL listings here right now (not sales)? A rising rental-DOM trend means longer vacancies and softer asking-rent achievability than the comps imply.
- What's the recent tenant-quality profile in this submarket — average credit score on applications, eviction rate, late-payment / NSF rate, and stable-employment percentage? A property-management company in the area should have these aggregated.
- How much new for-sale + rental construction is in the pipeline within 1–3 miles? Heavy new supply typically softens prices + rents 12–24 months out; constrained supply supports both.
Investment metrics
- 1% rule
- 2.70% ✓
- Cap rate
- 23.60%
- Cash-on-cash
- 61.81%
- DSCR
- 3.75
- GRM
- 3.1
CMA / ARV
- ARV (on-the-fly)
- $68,000
- Comps found
- 2
Show comp detail 2 sales within ~0.75 mi
| Address | Dist | Beds/Ba | Sqft | Sold | Price | $/sf | Match |
|---|---|---|---|---|---|---|---|
| 15141 Beach Blvd #39 | 0.00mi | 2/1.0 | 780 (-2%) | 6mo | $62,000 | $79 | 90 |
| 15621 beach Blvd #80 | 0.44mi | 2/2.0 | 800 (0%) | 0mo | $68,000 | $85 | 75 |
Match score weights: distance 35% · size 25% · config 20% · recency 20%. Top-matched comps best support the ARV.
Projected returns pro-forma
10.0% appreciation · 3.0% rent growth · sell at horizon
- IRR
- 73.8%
- Equity multiple
- 6.23×
- Total profit
- $146,366
- Equity at exit
- $90,088
- IRR
- 67.7%
- Equity multiple
- 13.82×
- Total profit
- $358,864
- Equity at exit
- $194,278
Cash invested: $28,000 (down + closing). Projections, not guarantees.
Landlord ↔ Tenant lean methodology
- Overall (STATE)
- 18 Strongly Tenant-Friendly
- State California
- 18 Strongly Tenant-Friendly · D+13
- County
- — inherits STATE
- City
- — inherits STATE
ZIP-level market 92655
- Home prices YoY
- 11.1%
- Active inventory
- 15
- Price-to-rent
- 3.1×
Monthly cashflow live
- Estimated rent
- $2,701 high interval (Pro) →
- Mortgage (P&I)
- −$524
- Tax est. 1.5%
- −$125 /mo · $1,500/yr
- Insurance
- −$42
- HOA
- −$0
- Vacancy / Maint / Mgmt
- −$567
- Net cashflow
- $1,442
Break-even live
Sensitivity live
| Price | -10% $1,511 | -5% $1,477 | +0% $1,442 | +5% $1,408 | +10% $1,373 |
|---|---|---|---|---|---|
| Rent | -10% $1,229 | -5% $1,336 | +0% $1,442 | +5% $1,549 | +10% $1,656 |
| Rate | -1.0pp $1,493 | -0.5pp $1,468 | base $1,442 | +0.5pp $1,416 | +1.0pp $1,390 |
UW: 25.0% down · 7.5% · 30yr · 1.5% tax · 5.0% vac · 8.0% maint · 8.0% mgmt
Financing live
Cash to close
- Down payment
- $25,000
- Closing costs
- $3,000
- Reserves months
- —
- Total cash needed
- —
Loan-product check · same deal, 3 products live
Conventional
25% down · 7.5% · 30yr
- Down + closing
- —
- Monthly P&I
- —
- Monthly cashflow
- —
- DSCR
- —
- Eligible?
- —
Personal DTI + credit; lowest rate.
DSCR
20% down · 8.5% · 30yr
- Down + closing
- —
- Monthly P&I
- —
- Monthly cashflow
- —
- DSCR
- —
- Eligible?
- —
No personal income docs; deal must DSCR.
Hard money
10% down · 12.0% · 12mo
- Down + closing
- —
- Monthly P&I
- —
- Monthly cashflow
- —
- DSCR
- —
- Eligible?
- —
Short-term bridge; refi at stabilization.
Rent comps 39 comps
| Address | Beds | Baths | Sqft | Rent | $/sqft | DOM | Units | Dist |
|---|---|---|---|---|---|---|---|---|
| 7780 Bolsa Ave Midway City, CA | 1.0 | 1.0 | 576 | $2,450 | $4.25 | 1d | 1 | 0.21mi |
| 15421 Van Buren St Midway City, CA | 1.0 | 1.0 | 600 | $2,300 | $3.83 | 17d | 1 | 0.35mi |
| 15421 Van Buren St Midway City, CA | 1.0 | 1.0 | 600 | $2,300 | $3.83 | 1d | 3 | 0.35mi |
| 8041 Worthy Dr Westminster, CA | 2.0 | 1.0 | 900 | $2,700 | $3.00 | 1d | 1 | 0.46mi |
| 7400 Center Ave Huntington Beach, CA | 2.0 | 1.0–2.0 | 990 | $4,119 | $4.16 | 1d | 1 | 0.79mi |
| 7521 Edinger Ave Huntington Beach, CA | 3.0 | 1.0–2.0 | 1035 | $3,703 | $3.58 | 1d | 23 | 0.82mi |
| 14332 Joyce Ave Westminster, CA | 3.0 | 2.0 | 1100 | $3,890 | $3.54 | 1d | 1 | 0.89mi |
| 8131 San Angelo Dr Huntington Beach, CA | 1.0 | 1.0 | 725 | $2,150 | $2.97 | 1d | 1 | 0.89mi |
| 7461 Edinger Ave Huntington Beach, CA | 2.0 | 1.0–2.0 | 1031 | $4,325 | $4.19 | 1d | 26 | 0.90mi |
| 16121 Malaga Ln Unit D Huntington Beach, CA | 2.0 | 2.0 | 1000 | $2,800 | $2.80 | 1d | 1 | 0.98mi |
| 16162 Sher Ln Huntington Beach, CA | 1.0–3.0 | 1.0–1.5 | 1090 | $2,522 | $2.31 | 1d | 9 | 0.99mi |
| 7942 Stark Dr Huntington Beach, CA | 2.0 | 2.0 | 1000 | $2,495 | $2.50 | 15d | 1 | 1.01mi |
| 7861 14th St Unit C Westminster, CA | 2.0 | 2.0 | 925 | $2,800 | $3.03 | 1d | 1 | 1.02mi |
| 7861 14th St Westminster, CA | 2.0 | 2.0 | 1025 | $2,700 | $2.63 | 3d | 1 | 1.02mi |
| 7792 15th St Westminster, CA | 1.0 | 1.0 | 950 | $2,400 | $2.53 | 3d | 1 | 1.05mi |
| 7891 Holt Dr Unit 03 Huntington Beach, CA | 2.0 | 1.0 | 850 | $2,295 | $2.70 | 19d | 1 | 1.05mi |
| 7643 14th St Westminster, CA | 2.0 | 2.0 | 1002 | $3,250 | $3.24 | 1d | 1 | 1.05mi |
| 8400 Edinger Ave Huntington Beach, CA | 2.0 | 1.0–2.0 | 778 | $3,007 | $3.87 | 1d | 13 | 1.05mi |
| 7601 Amazon Dr Unit 2 Huntington Beach, CA | 2.0 | 2.0 | 1000 | $2,650 | $2.65 | 1d | 1 | 1.06mi |
| 8142 La Paz Dr Unit 8 Huntington Beach, CA | 1.0 | 1.0 | 725 | $1,950 | $2.69 | 19d | 1 | 1.06mi |
| 8142 La Paz Dr Unit 7 Huntington Beach, CA | 1.0 | 1.0 | 725 | $1,950 | $2.69 | 10d | 1 | 1.06mi |
| 8211 San Angelo Dr Huntington Beach, CA | 1.0 | 1.0 | 612 | $2,455 | $4.01 | 1d | 5 | 1.06mi |
| 7290 Edinger Ave Huntington Beach, CA | 1.0–2.0 | 1.0–2.0 | 941 | $3,824 | $4.06 | 1d | 19 | 1.09mi |
| 15596 Dawson Ln Huntington Beach, CA | 3.0 | 2.0 | 1000 | $3,600 | $3.60 | 1d | 1 | 1.11mi |
| 15200 Magnolia St Westminster, CA | 1.0–2.0 | 1.0 | 762 | $2,675 | $3.51 | 2d | 2 | 1.15mi |
| 7661 Baylor Dr Westminster, CA | 1.0–2.0 | 1.0 | 787 | $2,400 | $3.05 | 1d | 2 | 1.15mi |
| 15611 Highcliff St Westminster, CA | 1.0 | 1.0 | 550 | $1,995 | $3.63 | 44d | 1 | 1.18mi |
| 7912 Glencoe Dr Huntington Beach, CA | 3.0 | 1.0 | 1100 | $3,900 | $3.55 | 1d | 1 | 1.23mi |
| 7012 Main St Westminster, CA | 1.0–2.0 | 1.0 | 812 | $2,395 | $2.95 | 11d | 5 | 1.26mi |
| 8402 Westminster Blvd Westminster, CA | 1.0 | 1.0 | 625 | $1,695 | $2.71 | 1d | 1 | 1.27mi |
| 7012 Main St Unit 7042-11 Westminster, CA | 2.0 | 1.0 | 900 | $2,395 | $2.66 | 1d | 1 | 1.27mi |
| 7012 Main St Unit 7032-02 Westminster, CA | 1.0 | 1.0 | 725 | $1,995 | $2.75 | 7d | 1 | 1.27mi |
| 7012 Main St Unit 7042-06 Westminster, CA | 2.0 | 1.0 | 900 | $2,395 | $2.66 | 17d | 1 | 1.27mi |
| 7012 Main St Unit 7022-16 Westminster, CA | 2.0 | 1.0 | 900 | $2,395 | $2.66 | 7d | 1 | 1.27mi |
| 7012 Main St Unit 7042-04 Westminster, CA | 1.0 | 1.0 | 725 | $1,995 | $2.75 | 1d | 1 | 1.27mi |
| 13920 Hoover St Westminster, CA | 2.0 | 1.0–2.0 | 645 | $3,031 | $4.70 | 1d | 11 | 1.30mi |
| 15100 Moran St Westminster, CA | 1.0–2.0 | 1.0–2.0 | 1204 | $3,847 | $3.19 | 2d | 8 | 1.39mi |
| 14051 Locust St Unit 201 Westminster, CA | 2.0 | 2.5 | 1019 | $3,127 | $3.07 | 15d | 1 | 1.39mi |
| 8631 Westminster Ave Garden Grove, CA | 1.0–2.0 | 1.0 | 660 | $2,489 | $3.77 | 1d | 9 | 1.41mi |
Listing history 32 events
-
2026-06-18days on market $100,000 Active 335 DOM
-
2026-06-17days on market $100,000 Active 334 DOM
-
2026-06-16days on market $100,000 Active 333 DOM
-
2026-06-15days on market $100,000 Active 332 DOM
-
2026-06-13days on market $100,000 Active 330 DOM
-
2026-06-13days on market $100,000 Active 329 DOM
-
2026-06-09days on market $100,000 Active 326 DOM
-
2026-06-08days on market $100,000 Active 325 DOM
-
2026-06-07days on market $100,000 Active 324 DOM
-
2026-06-04days on market $100,000 Active 321 DOM
-
2026-06-03days on market $100,000 Active 320 DOM
-
2026-06-02days on market $100,000 Active 319 DOM
-
2026-06-01days on market $100,000 Active 318 DOM
-
2026-05-31days on market $100,000 Active 317 DOM
-
2026-02-20price $100,000
-
2025-10-30price $110,000
-
2025-07-18$123,000 Active
-
2023-04-01historical
-
2023-02-01price $135,000
-
2022-11-22$120,000 Active
-
2021-10-06historical
-
2021-08-04$69,000 Active
-
2019-10-21historical
-
2019-09-06$61,000 Active
-
2019-06-20historical
-
2019-06-02price $59,000
-
2019-04-29price $64,000
-
2019-04-22$69,000 Active
-
2008-10-06historical
-
2008-06-05$50,000
-
2002-07-20historical
-
2002-01-30$67,900
ⓘ Source: listings_history table (triggers on properties + properties_extension) + one-shot
backfill from property_details.listing_events for pre-trigger history.
Climate risk First Street
- Flood 1/10 Low FEMA zone X (shaded) · 0% chance over 30 yrs
- Wildfire 1/10 Low
- Heat 5/10 Major 7 d/yr ≥87°F today · 23 d/yr by 30 yrs out
- Wind 1/10 Low
- Air quality 4/10 Moderate 5 unhealthy d/yr today · 7 by 30 yrs out
Nearby sold comps map
Loading sold comps map…
Walkable amenities ~0.75 mi
Loading nearby amenities…
Taxation est. · year 1
- Rental income
- $32,406
- − Mortgage interest
- −$5,602
- − Property taxes
- −$1,500
- − Insurance
- −$500
- − Repairs & maintenance
- −$2,592
- − Management
- −$2,592
- − Depreciation
- −$2,909
- Taxable income
- $16,710
- Est. tax owed @ 24.0%
- −$4,011
- After-tax cash flow
- $13,297/yr
For passive investors: Depreciation is non-cash, so a rental often shows a tax loss while cash-flowing — sheltering income. Rental losses are passive: they offset passive income freely, and up to $25,000/yr can offset ordinary (W-2) income if you actively participate and your MAGI is under $100k (phasing out to $0 by $150k); unused losses carry forward. On sale, claimed depreciation is recaptured at up to 25%, and gains may owe capital-gains tax (a 1031 exchange can defer both). Figures are a year-1 estimate at your 24.0% rate — not tax advice; consult a CPA.
Schools (NCES district)
- District
- Huntington Beach Union High
- NCES district ID
- 0618060
- Math proficiency
- 65% ▲ 17.00%
- Reading proficiency
- 82% ▲ 8.00%
- Median HH income
- $78,159
- Composite
- 64.9/100
- National rank
- #511
- State rank
- #39 of 517 in CA
Livability — Midway City
- Score
- 59/100
- State rank
- #624
- US rank
- #19816
Category grades
Schools grade is shown separately in the Schools card above.
Census & demographics
- Census place
- Midway City, CA
- City population
- 8,101
- Population (ZIP)
- 8,101
Population outlook (Orange County) Hauer SSP2
- Today (2025)
- 3,477,456 people
- By 2030
- 3,613,117 · +3.9%
- By 2040
- 3,835,945 · +10.3%
- By 2050
- 3,968,736 · +14.1%
- By 2075
- 4,097,053 · +17.8%
- By 2100
- 3,903,633 · +12.3%
Race, ethnicity, and origin ACS 2023
- Neighborhood character
- Diverse neighborhood (Simpson 0.66)
- Race & ethnicity
- Asian 44% Hispanic / Latino 35% White 16% Two or more races 9% Native American 2%
- Hispanic origin (detail)
- Mexican 35%
- Common ancestry
- Lithuanian 1% Iranian 1%
- Foreign-born
- 49% · Vietnam, Canada, China
- Languages at home
- 28% English-only · Vietnamese 39% Spanish 26% Chinese 2%
Political lean MEDSL · Orange
- 2024 margin
- Toss-up / Even · D 49.7% · R 47.1% · Other 3.2%
- 2008→2024 swing
- +5.2pp toward D · 2008: -2.6pp · 2024: 2.6pp
- All cycles
- 2024: D+2.6 2020: D+9.0 2016: D+7.7 2012: R+8.3 2008: R+2.6
Not yet ingested
- Civics
- —
Market trends
- HPI YoY
- ▲ 97.88%
- Current HPI
- 980.41
- Rent YoY
- —
- Metro
- —
- State GDP YoY
- ▲ 3.21%
- F500 in state
- 116
Industry mix (Fortune 500 HQ in CA)
| Industry | F500 HQs | Revenue |
|---|---|---|
| Technology | 27 | $1,492B |
|
||
| Financial Services | 3 | $174B |
|
||
| Retail | 3 | $44B |
|
||
| Insurance | 3 | $26B |
|
||
| Media / Entertainment | 2 | $115B |
|
||
| Pharmaceuticals / Biotech | 2 | $62B |
|
||
Price history
+47.3% since first listed18 events — show timeline
- 2026-02-20 Price Changed $100,000 CRMLS
- 2025-10-30 Price Changed $110,000 CRMLS
- 2025-07-18 Listed $123,000 CRMLS
- 2023-04-01 Listing Removed — CRMLS
- 2023-02-01 Price Changed $135,000 CRMLS
- 2022-11-22 Listed $120,000 CRMLS
- 2021-10-06 Listing Removed — CRMLS
- 2021-08-04 Listed $69,000 CRMLS
- 2019-10-21 Listing Removed — CRMLS
- 2019-09-06 Listed $61,000 CRMLS
- 2019-06-20 Listing Removed — CRMLS
- 2019-06-02 Price Changed $59,000 CRMLS
- 2019-04-29 Price Changed $64,000 CRMLS
- 2019-04-22 Listed $69,000 CRMLS
- 2008-10-06 Listing Removed — CRMLS
- 2008-06-05 Listed $50,000 CRMLS
- 2002-07-20 Listing Removed — CRMLS
- 2002-01-30 Listed $67,900 CRMLS
Property tax history
-4.0%/yrLatest (2025): $177 · -0.8% YoY. Source: county tax records.
Cash-flow waterfall
monthlySold comps — $/sqft
last 12 mo · ≤1 miLoading sold comps…