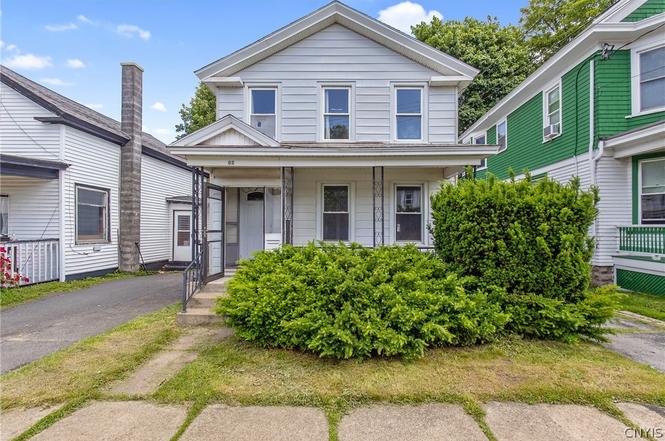
65 E 7th St · Oswego, NY
Flood risk 1/10 · Minimal
- FEMA flood zone
- X (unshaded)
- Chance of flooding over 30 yrs
- 0.0%
- Est. flood insurance / yr
- $473 – $860
Fire risk 3/10 · Minor
- Est. fire insurance / yr
- $691 – $1,283
Heat risk 3/10 · Minor
- Hot days now (above 94°F)
- 7 days/yr
- Hot days in 30 yrs
- 17 days/yr
Wind risk 1/10 · Minimal
- Chance of severe wind over 30 yrs
- 0.0%
Air-quality risk 2/10 · Minimal
- Unhealthy air days now
- 2 days/yr
- Unhealthy air days in 30 yrs
- 2 days/yr
Risk factors via First Street. Map © Google.
Why this score? — see what drove the A- grade
The composite is a weighted blend of 9 inputs, each scored 0–100. Each bar is that input's sub-score; the figure is the points it added to the 100-point composite (weight × sub-score).
- Cash flow +30.0/30.0
- ARV discount +14.1/15.0
- 1% rule +10.0/10.0
- DSCR +10.0/10.0
- Rent growth +5.0/5.0
- Appreciation +3.9/10.0
- Schools +3.8/10.0
- Livability +3.8/5.0
- Condition / age +2.5/5.0
$129,000
🖨 Deal sheet 📄 Offer letter ✓ Due diligence
Listing remarks MLS
4 Bedroom Oswego Home. Many Updates. Excellent Investment Opportunity. Can be packages with 63 W 7th and/or 150 E 3rd St
Key facts
- Private backyard
- Convenient location
- 3,200 sq ft lot
Tags
Neighborhood map
What this means for you Summary
Snapshot
- This is a 4-bed/1.5-bath single-family listed at $129k.
Deal economics
- At list price, monthly cash flow is $820 ($10k/yr) — positive.
- The deal already cash-flows at list — no discount required.
- Meets the 1% rule at list price ($2k rent vs $129k).
- Cap rate 13.9% vs local median 8.8% in Oswego — top-decile yield for the area; either an underpriced asset or a hidden risk that comps aren't pricing in. Stress-test before assuming the spread holds.
Location & tenants
- Location reads 75/100 on livability (#265 in NY, #4,189 nationally) — a middle-class / working-renter tenant base. Strengths: cost of living A+, housing A+, health & safety A+; Watch: schools D+, crime F, commute F.
- Oswego City School District (town): math 39% / reading 51% proficiency, ranked #465 of 590 in NY (top 79%) — families likely to look elsewhere, expect single-tenant / working-renter base with shorter leases.
- Market conditions: Rents rising fast (+19.2%/yr); 168 active listings in the ZIP; 20 comparable units currently listed for rent nearby; rentals leasing fast (median 14d on market — plan ~1-2 weeks tenant-placement turnaround); 172 units permitted in Oswego County in 2024 (27 in 5+ unit buildings).
- This rent runs 39% of the median local income ($65k/yr) — at the standard rent-burdened threshold; future hikes will face affordability resistance.
Forward outlook
- Local home prices are declining (-2.2%/yr); year-one equity from $892 of loan paydown is wiped out by about $3k of value loss. Plan a longer hold.
- Oswego County population projected at -23% by 2050 — secular population decline; favor cash flow + early exit over multi-decade hold.
- At projected returns (-2.2% appreciation + 8.0% rent growth), your $36k cash investment doubles in ~4 years — after that, you're playing with house money.
Negotiation context
- Only 1 days on market — expect competitive offers; lowballing is unlikely to land.
- 3 sale attempts since 12y ago with the ask held roughly flat each time — persistent listings suggest the price (not the market) is what's stuck; bring a comps-based counter.
- Current owner paid $50k; list at $129k implies a 158% gain — meaningful room to come down on a strong offer.
Risks & watch-outs
- Watch-outs: built in 1900 — expect roof / HVAC / electrical / plumbing capex.
Questions for the listing agent
- Built in 1900 — when were the roof, HVAC, electrical panel, plumbing, and water heater last replaced?
- Is there a deadline driving the sale (1031 exchange, divorce, estate, relocation)? That informs how much negotiation room exists.
- Schools are D-rated, which usually means shorter tenancies and higher turnover. Who's the typical renter profile here, and what's been the actual vacancy rate?
- Crime grade is F in this area — have there been break-ins, vandalism, or insurance claims at this property in the last 3 years? What carrier currently insures it and at what premium?
- What's the average days-on-market for RENTAL listings here right now (not sales)? A rising rental-DOM trend means longer vacancies and softer asking-rent achievability than the comps imply.
- What's the recent tenant-quality profile in this submarket — average credit score on applications, eviction rate, late-payment / NSF rate, and stable-employment percentage? A property-management company in the area should have these aggregated.
- How much new for-sale + rental construction is in the pipeline within 1–3 miles? Heavy new supply typically softens prices + rents 12–24 months out; constrained supply supports both.
Investment metrics
- 1% rule
- 1.64% ✓
- Cap rate
- 13.92%
- Cash-on-cash
- 27.25%
- DSCR
- 2.21
- GRM
- 5.1
CMA / ARV
- ARV (on-the-fly)
- $151,158
- Comps found
- 12
Show comp detail 12 sales within ~0.75 mi
| Address | Dist | Beds/Ba | Sqft | Sold | Price | $/sf | Match |
|---|---|---|---|---|---|---|---|
| 90 E Cayuga St | 0.05mi | 3/2.0 (-1) | 1,378 (+8%) | 6mo | $162,000 | $118 | 73 |
| 13 E 6th St | 0.21mi | 3/2.0 (-1) | 1,227 (-4%) | 5mo | $60,000 | $49 | 72 |
| 131 E 8th St | 0.27mi | 3/2.0 (-1) | 1,249 (-2%) | 6mo | $180,200 | $144 | 71 |
| 94 E 5th St | 0.17mi | 3/1.0 (-1) | 1,417 (+11%) | 2mo | $148,930 | $105 | 66 |
| 145 E Seneca St | 0.33mi | 3/1.0 (-1) | 1,213 (-5%) | 4mo | $155,000 | $128 | 65 |
| 6 E 6th St | 0.24mi | 4/1.0 | 1,127 (-12%) | 8mo | $65,000 | $58 | 60 |
| 139 Midland St | 0.52mi | 4/2.0 | 1,200 (-6%) | 6mo | $170,000 | $142 | 58 |
| 73 E Van Buren St | 0.54mi | 4/1.5 | 1,355 (+6%) | 9mo | $191,500 | $141 | 58 |
| 210 E 11th St | 0.36mi | 3/2.0 (-1) | 1,398 (+9%) | 5mo | $116,000 | $83 | 57 |
| 279 Cherry St | 0.50mi | 3/1.0 (-1) | 1,358 (+6%) | 4mo | $160,000 | $118 | 56 |
| 205 E 2nd St | 0.53mi | 3/1.0 (-1) | 1,368 (+7%) | 8mo | $75,000 | $55 | 50 |
| 203 E 5th St | 0.55mi | 3/1.5 (-1) | 1,143 (-11%) | 4mo | $65,000 | $57 | 48 |
Match score weights: distance 35% · size 25% · config 20% · recency 20%. Top-matched comps best support the ARV.
Projected returns pro-forma
-2.25% appreciation · 8.0% rent growth · sell at horizon
- IRR
- 28.1%
- Equity multiple
- 2.29×
- Total profit
- $46,604
- Equity at exit
- $23,568
- IRR
- 37.4%
- Equity multiple
- 5.50×
- Total profit
- $162,383
- Equity at exit
- $18,743
Cash invested: $36,120 (down + closing). Projections, not guarantees.
Landlord ↔ Tenant lean methodology
- Overall (STATE)
- 15 Strongly Tenant-Friendly
- State New York
- 15 Strongly Tenant-Friendly · D+10
- County
- — inherits STATE
- City
- — inherits STATE
ZIP-level market 13126
- Home prices YoY
- -0.8%
- Rents YoY
- 19.2%
- Active inventory
- 168
- Price-to-rent
- 5.1×
Monthly cashflow live
- Estimated rent
- $2,117 high interval (Pro) →
- Mortgage (P&I)
- −$676
- Tax from tax record
- −$122 /mo · $1,463/yr
- Insurance
- −$54
- HOA
- −$0
- Vacancy / Maint / Mgmt
- −$445
- Net cashflow
- $820
Break-even live
UW: 25.0% down · 7.5% · 30yr · 1.5% tax · 5.0% vac · 8.0% maint · 8.0% mgmt
Financing live
Cash to close
- Down payment
- $32,250
- Closing costs
- $3,870
- Reserves months
- —
- Total cash needed
- —
Loan-product check · same deal, 3 products live
Conventional
25% down · 7.5% · 30yr
- Down + closing
- —
- Monthly P&I
- —
- Monthly cashflow
- —
- DSCR
- —
- Eligible?
- —
Personal DTI + credit; lowest rate.
DSCR
20% down · 8.5% · 30yr
- Down + closing
- —
- Monthly P&I
- —
- Monthly cashflow
- —
- DSCR
- —
- Eligible?
- —
No personal income docs; deal must DSCR.
Hard money
10% down · 12.0% · 12mo
- Down + closing
- —
- Monthly P&I
- —
- Monthly cashflow
- —
- DSCR
- —
- Eligible?
- —
Short-term bridge; refi at stabilization.
Rent comps 20 comps
| Address | Beds | Baths | Sqft | Rent | $/sqft | DOM | Units | Dist |
|---|---|---|---|---|---|---|---|---|
| 25 W Mohawk St Unit TH Oswego, NY | 3.0 | 1.0 | 1150 | $1,745 | $1.52 | 43d | 1 | 0.68mi |
| 39 W 6th St Unit 2-A Oswego, NY | 3.0 | 1.0 | 1500 | $1,725 | $1.15 | 13d | 1 | 0.87mi |
| 4 Murray St Oswego, NY | 4.0 | 2.0 | 1589 | $1,800 | $1.13 | 13d | 1 | 0.93mi |
| 103 W 8th St Unit A Oswego, NY | 4.0 | 2.0 | 1800 | $2,400 | $1.33 | 13d | 1 | 0.96mi |
| 175 W 8th St Unit 1 A Oswego, NY | 5.0 | 2.0 | 1800 | $2,625 | $1.46 | 43d | 1 | 0.97mi |
| 105 W Oneida St Unit A Oswego, NY | 4.0 | 2.0 | 1800 | $2,540 | $1.41 | 13d | 1 | 1.00mi |
| 23 NW 9th St Oswego, NY | 4.0 | 1.5 | 1700 | $2,300 | $1.35 | 13d | 1 | 1.00mi |
| 130 W Bridge St Unit A Oswego, NY | 4.0 | 2.0 | 1700 | $2,500 | $1.47 | 13d | 1 | 1.07mi |
| 136 W Cayuga St Unit A Oswego, NY | 4.0 | 2.0 | 1600 | $2,300 | $1.44 | 13d | 1 | 1.10mi |
| 6 Lathrop St Oswego, NY | 3.0 | 1.0 | 1100 | $1,725 | $1.57 | 13d | 1 | 1.12mi |
| 141 W Cayuga St Oswego, NY | 4.0 | 1.0 | 1311 | $2,100 | $1.60 | 13d | 1 | 1.12mi |
| 135 W Mohawk St Oswego, NY | 3.0 | 1.0 | 1103 | $1,700 | $1.54 | 13d | 1 | 1.12mi |
| 148 W Seneca St Unit A Oswego, NY | 4.0 | 2.0 | 1800 | $2,400 | $1.33 | 13d | 1 | 1.14mi |
| 85 Liberty St Unit A Oswego, NY | 4.0 | 2.0 | 1800 | $2,500 | $1.39 | 13d | 1 | 1.15mi |
| 153 W Bridge St Unit A Oswego, NY | 4.0 | 1.5 | 1800 | $2,340 | $1.30 | 13d | 1 | 1.17mi |
| 14 Pond Path Oswego, NY | 3.0 | 1.5 | 1408 | $2,300 | $1.63 | 13d | 1 | 1.19mi |
| 161 W Bridge St Unit A Oswego, NY | 4.0 | 2.0 | 1400 | $2,240 | $1.60 | 13d | 1 | 1.20mi |
| 143 Liberty St Unit A Oswego, NY | 4.0 | 2.0 | 1700 | $2,480 | $1.46 | 13d | 1 | 1.20mi |
| 164 W Schuyler St Unit A Oswego, NY | 3.0 | 2.0 | 1400 | $1,755 | $1.25 | 13d | 1 | 1.23mi |
| 188 W Bridge St Oswego, NY | 4.0 | 1.0 | 1008 | $1,800 | $1.79 | 13d | 1 | 1.29mi |
Listing history 14 events
-
2026-06-18remarks 681-char remark
-
2026-06-18pricestatusdays on market $129,000 Active 1 DOM
-
2026-03-31status Pending
-
2026-03-19price $124,000
-
2026-02-06$129,000 Active
-
2017-11-06soldstatus $50,000
-
2017-11-01soldstatus $50,000 Closed Sale or Rented 120-char remark
Show marketing remark (120 chars)
4 Bedroom Oswego Home. Many Updates. Excellent Investment Opportunity. Can be packages with 63 W 7th and/or 150 E 3rd St
-
2017-09-13status Pending Sale 120-char remark
Show marketing remark (120 chars)
4 Bedroom Oswego Home. Many Updates. Excellent Investment Opportunity. Can be packages with 63 W 7th and/or 150 E 3rd St
-
2017-09-11historical 120-char remark
Show marketing remark (120 chars)
4 Bedroom Oswego Home. Many Updates. Excellent Investment Opportunity. Can be packages with 63 W 7th and/or 150 E 3rd St
-
2017-07-30historical Continue to Show- Under Contract 120-char remark
Show marketing remark (120 chars)
4 Bedroom Oswego Home. Many Updates. Excellent Investment Opportunity. Can be packages with 63 W 7th and/or 150 E 3rd St
-
2017-03-11$54,900 Active 120-char remark
Show marketing remark (120 chars)
4 Bedroom Oswego Home. Many Updates. Excellent Investment Opportunity. Can be packages with 63 W 7th and/or 150 E 3rd St
-
2014-05-13soldstatus $50,000
-
2014-05-12soldstatus $50,000 424-char remark
Show marketing remark (424 chars)
Perfect for a first time home buyer or a seasoned investor. This property offers nearly 1400 square feet of unlimited potential and a driveway with of-street parking. A great first floor layout with open front porch, bedroom/den, 1/2 bath, washer & dryer and convenient rear porch. Three bedrooms and full bath upstairs. Please take the time to visit and view the possibilities. THIS PROPERTY IS PRICED TO SELL-THANKS!
-
2014-04-04$52,222 424-char remark
Show marketing remark (424 chars)
Perfect for a first time home buyer or a seasoned investor. This property offers nearly 1400 square feet of unlimited potential and a driveway with of-street parking. A great first floor layout with open front porch, bedroom/den, 1/2 bath, washer & dryer and convenient rear porch. Three bedrooms and full bath upstairs. Please take the time to visit and view the possibilities. THIS PROPERTY IS PRICED TO SELL-THANKS!
ⓘ Source: listings_history table (triggers on properties + properties_extension) + one-shot
backfill from property_details.listing_events for pre-trigger history.
Tax reassessment forecast NY · Partial reset (capped growth)
- Current annual tax
- $1,463 · $122/mo
- Projected year-2 tax
- $1,821 · $152/mo
- Expected delta
- +$359/yr (+$30/mo · 24.5%)
ⓘ Screening estimate from a state-policy table — verify with the county assessor before closing.
Climate risk First Street
- Flood 1/10 Low FEMA zone X (unshaded) · 0% chance over 30 yrs
- Wildfire 3/10 Moderate
- Heat 3/10 Moderate 7 d/yr ≥94°F today · 17 d/yr by 30 yrs out
- Wind 1/10 Low 0% chance of damaging wind over 30 yrs
- Air quality 2/10 Low 2 unhealthy d/yr today · 2 by 30 yrs out
Nearby sold comps map
Loading sold comps map…
Walkable amenities ~0.75 mi
Loading nearby amenities…
Taxation est. · year 1
- Rental income
- $25,402
- − Mortgage interest
- −$7,226
- − Property taxes
- −$1,463
- − Insurance
- −$645
- − Repairs & maintenance
- −$2,032
- − Management
- −$2,032
- − Depreciation
- −$3,753
- Taxable income
- $8,252
- Est. tax owed @ 24.0%
- −$1,980
- After-tax cash flow
- $7,862/yr
For passive investors: Depreciation is non-cash, so a rental often shows a tax loss while cash-flowing — sheltering income. Rental losses are passive: they offset passive income freely, and up to $25,000/yr can offset ordinary (W-2) income if you actively participate and your MAGI is under $100k (phasing out to $0 by $150k); unused losses carry forward. On sale, claimed depreciation is recaptured at up to 25%, and gains may owe capital-gains tax (a 1031 exchange can defer both). Figures are a year-1 estimate at your 24.0% rate — not tax advice; consult a CPA.
Schools (NCES district)
- District
- Oswego City School District
- NCES district ID
- 3622050
- Math proficiency
- 39% ▼ -7.00%
- Reading proficiency
- 51% ▲ 9.00%
- Median HH income
- $45,835
- Composite
- 38.2/100
- National rank
- #4257
- State rank
- #465 of 590 in NY
Livability — Oswego
- Score
- 75/100
- State rank
- #265
- US rank
- #4189
Category grades
Schools grade is shown separately in the Schools card above.
Census & demographics
- Census place
- Oswego, NY
- County
- Oswego County · 36,495 people
- City population
- 223
- Metro
- Syracuse, NY
- Population (ZIP)
- 36,495
- Household income
- $65,346
- Rent vs Own
- Severe rent burden
- 1341.0
Population outlook (Oswego County) Hauer SSP2
- Today (2025)
- 114,465 people
- By 2030
- 109,968 · -3.9%
- By 2040
- 99,205 · -13.3%
- By 2050
- 87,979 · -23.1%
- By 2075
- 65,100 · -43.1%
- By 2100
- 47,117 · -58.8%
Race, ethnicity, and origin ACS 2023
- Neighborhood character
- Predominantly White (87%)
- Race & ethnicity
- White 87% Hispanic / Latino 5% Two or more races 5% Black 2% Asian 2%
- Hispanic origin (detail)
- Mexican 1% Puerto Rican 2%
- Common ancestry
- Romanian 6% Lithuanian 4% Italian 2%
- Foreign-born
- 3% · Canada
- Languages at home
- 93% English-only · Spanish 3% Other Asian/Pacific 1% Other Indo-European 1%
Political lean MEDSL · Oswego
- 2024 margin
- Strong R (+24.2) · D 37.9% · R 62.1%
- 2008→2024 swing
- -26.6pp toward R · 2008: 2.5pp · 2024: -24.2pp
- All cycles
- 2024: R+24.2 2020: R+20.2 2016: R+23.2 2012: D+7.9 2008: D+2.5
Not yet ingested
- Civics
- —
Market trends
- HPI YoY
- ▼ -2.25%
- Current HPI
- 295.5134
- Rent YoY
- ▲ 19.18%
- Metro
- Syracuse, NY
- State GDP YoY
- ▲ 2.60%
- F500 in state
- 92
Industry mix (Fortune 500 HQ in NY)
| Industry | F500 HQs | Revenue |
|---|---|---|
| Financial Services | 10 | $950B |
|
||
| Consumer Goods | 9 | $162B |
|
||
| Insurance | 4 | $225B |
|
||
| Telecommunications | 2 | $144B |
|
||
| Pharmaceuticals | 2 | $112B |
|
||
| Media / Entertainment | 2 | $69B |
|
||
Price history
+137.4% since first listed12 events — show timeline
- 2026-03-31 Pending — CNYIS
- 2026-03-19 Price Changed $124,000 CNYIS
- 2026-02-06 Listed $129,000 CNYIS
- 2017-11-06 Sold (Public Records) $50,000 Public Records
- 2017-11-01 Sold (MLS) $50,000 CNYIS
- 2017-09-13 Pending — CNYIS
- 2017-09-11 Listing Removed — CNYIS
- 2017-07-30 Contingent — CNYIS
- 2017-03-11 Listed $54,900 CNYIS
- 2014-05-13 Sold (Public Records) $50,000 Public Records
- 2014-05-12 Sold (MLS) $50,000 CNYIS
- 2014-04-04 Listed $52,222 CNYIS
Property tax history
+9.8%/yrLatest (2025): $1,463 · +2.3% YoY. Source: county tax records.
Cash-flow waterfall
monthlySold comps — $/sqft
last 12 mo · ≤1 miLoading sold comps…