1550 W Southern Ave #20 · Phoenix, AZ
Flood risk 1/10 · Minimal
- FEMA flood zone
- X (shaded)
- Chance of flooding over 30 yrs
- 0.0%
- Est. flood insurance / yr
- $507 – $1,088
Fire risk 4/10 · Minor
- Est. fire insurance / yr
- $610 – $1,132
Heat risk 9/10 · Severe
- Hot days now (above 111°F)
- 7 days/yr
- Hot days in 30 yrs
- 19 days/yr
Wind risk 1/10 · Minimal
- Chance of severe wind over 30 yrs
- —
Air-quality risk 2/10 · Minimal
- Unhealthy air days now
- 2 days/yr
- Unhealthy air days in 30 yrs
- 2 days/yr
Risk factors via First Street. Map © Google.
Why this score? — see what drove the B- grade
The composite is a weighted blend of 9 inputs, each scored 0–100. Each bar is that input's sub-score; the figure is the points it added to the 100-point composite (weight × sub-score).
- Cash flow +30.0/30.0
- 1% rule +10.0/10.0
- DSCR +10.0/10.0
- ARV discount +7.5/15.0
- Livability +3.8/5.0
- Condition / age +2.5/5.0
- Rent growth +2.3/5.0
- Schools +1.0/10.0
- Appreciation +0.0/10.0
$79,900
🖨 Deal sheet 📄 Offer letter ✓ Due diligence
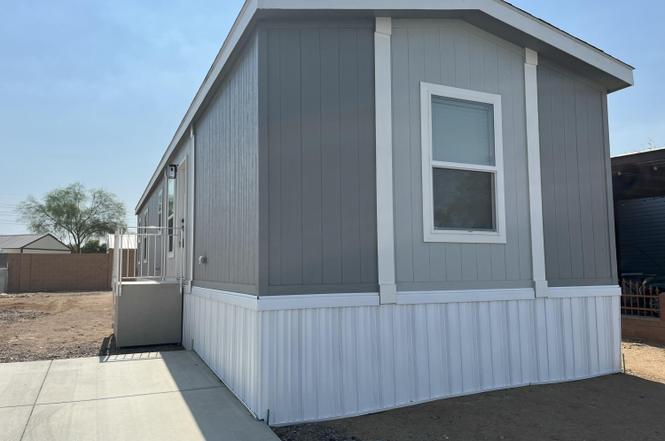
Listing remarks
The home is located within Southern Foothills Mobile Home park. The park is gated has paved streets, and full time on site management. The brand new zero energy efficient 2024 Clayton home has tape and textured wall throughout, stainless steel appliances, laminate flooring. 2025Taxes not assessed yet.
Key facts
- Laminate flooring
- Gated
- Paved streets
Tags
Property features AI
Finance
- HOA & community: Land lease with monthly fee of $525; No association fees included
Exterior
- Parking: Detached parking; 2 open parking spaces
- Utilities: City water; Public sewer
- Home design: Manufactured/Mobile home; Leasehold ownership
- Construction: Wood frame construction; Painted exterior; Composition roof
- Exterior features: Block and chain link fencing; Dirt front and back yard
Interior
- Kitchen: Refrigerator; Dishwasher; Laminate counters
- Bedrooms: 3 possible bedrooms
- Flooring: Laminate; Vinyl
- Bathrooms: 2 full bathrooms
- Heating & cooling: Electric heating; Central air conditioning
- Interior features: No interior steps; Full bath in primary bedroom; Laminate countertops
- Laundry & utility: Washer/Dryer hookup only
Neighborhood map
What this means for you Summary
Snapshot
- This is a 3-bed/2.0-bath manufactured listed at $80k.
Deal economics
- At list price, monthly cash flow is $761 ($9k/yr) — positive.
- The deal already cash-flows at list — no discount required.
- Meets the 1% rule at list price ($2k rent vs $80k).
- Cap rate 17.7% vs local median 3.3% in Phoenix — top-decile yield for the area; either an underpriced asset or a hidden risk that comps aren't pricing in. Stress-test before assuming the spread holds.
Location & tenants
- Location reads 75/100 on livability (#16 in AZ, #3,924 nationally) — a middle-class / working-renter tenant base. Strengths: amenities A+, commute A+, housing A+; Watch: health & safety C-, crime F.
- Roosevelt Elementary District (4279) (urban): math 8% / reading 14% proficiency, ranked #234 of 249 in AZ (top 94%) — low school quality limits family demand, transient renter base, plan for 1-2y turnover.
- Zoned schools: V H Lassen Elementary School (math 8% / reading 12%, grade F, #1,022 of 1,109 statewide, top 93%, 281 students, 84% FRL) — zoned schools average 84% FRL vs 36% district-wide (48 pts higher); higher-poverty schools than district average — tighter screening recommended.
- Market conditions: Rents soft (-0.8%/yr); 252 active listings in the ZIP; 21 comparable units currently listed for rent nearby; rentals leasing fast (median 1d on market — plan ~1-2 weeks tenant-placement turnaround); solid renter incomes; 36,011 units permitted in Maricopa County in 2024 (12,801 in 5+ unit buildings).
Forward outlook
- Local home prices are declining (-3.0%/yr); year-one equity from $552 of loan paydown is wiped out by about $2k of value loss. Plan a longer hold.
- Maricopa County population projected at +38% by 2050 — long-run rental-demand tailwind backs the buy-and-hold thesis.
- At projected returns (-3.0% appreciation + 0.0% rent growth), your $22k cash investment doubles in ~4 years — after that, you're playing with house money.
Negotiation context
- Only 2 days on market — expect competitive offers; lowballing is unlikely to land.
- 6 sale attempts with the ask held roughly flat each time — persistent listings suggest the price (not the market) is what's stuck; bring a comps-based counter.
Risks & watch-outs
- Climate carrying-cost: extreme-heat days projected 7→19/yr by 2055 (HVAC capex compounding) — expect insurance premiums to compound above CPI over the hold.
Questions for the listing agent
- Is there a deadline driving the sale (1031 exchange, divorce, estate, relocation)? That informs how much negotiation room exists.
- Crime grade is F in this area — have there been break-ins, vandalism, or insurance claims at this property in the last 3 years? What carrier currently insures it and at what premium?
- What's the average days-on-market for RENTAL listings here right now (not sales)? A rising rental-DOM trend means longer vacancies and softer asking-rent achievability than the comps imply.
- What's the recent tenant-quality profile in this submarket — average credit score on applications, eviction rate, late-payment / NSF rate, and stable-employment percentage? A property-management company in the area should have these aggregated.
- How much new for-sale + rental construction is in the pipeline within 1–3 miles? Heavy new supply typically softens prices + rents 12–24 months out; constrained supply supports both.
Investment metrics
- 1% rule
- 2.08% ✓
- Cap rate
- 17.73%
- Cash-on-cash
- 40.83%
- DSCR
- 2.82
- GRM
- 4.0
CMA / ARV
No comps found within radius.
Projected returns pro-forma
-3.0% appreciation · 0.0% rent growth · sell at horizon
- IRR
- 33.9%
- Equity multiple
- 2.37×
- Total profit
- $30,689
- Equity at exit
- $11,913
- IRR
- 39.2%
- Equity multiple
- 4.15×
- Total profit
- $70,426
- Equity at exit
- $6,908
Cash invested: $22,372 (down + closing). Projections, not guarantees.
Landlord ↔ Tenant lean methodology
- Overall (STATE)
- 87 Strongly Landlord-Friendly
- State Arizona
- 87 Strongly Landlord-Friendly · R+3
- County
- — inherits STATE
- City
- — inherits STATE
ZIP-level market 85041
- Home prices YoY
- -33.0%
- Rents YoY
- -0.8%
- Active inventory
- 252
- Price-to-rent
- 4.0×
Monthly cashflow live
- Estimated rent
- $1,663 high interval (Pro) →
- Mortgage (P&I)
- −$419
- Tax est. 1.5%
- −$100 /mo · $1,198/yr
- Insurance
- −$33
- HOA
- −$0
- Vacancy / Maint / Mgmt
- −$349
- Net cashflow
- $761
Break-even live
UW: 25.0% down · 7.5% · 30yr · 1.5% tax · 5.0% vac · 8.0% maint · 8.0% mgmt
Financing live
Cash to close
- Down payment
- $19,975
- Closing costs
- $2,397
- Reserves months
- —
- Total cash needed
- —
Loan-product check · same deal, 3 products live
Conventional
25% down · 7.5% · 30yr
- Down + closing
- —
- Monthly P&I
- —
- Monthly cashflow
- —
- DSCR
- —
- Eligible?
- —
Personal DTI + credit; lowest rate.
DSCR
20% down · 8.5% · 30yr
- Down + closing
- —
- Monthly P&I
- —
- Monthly cashflow
- —
- DSCR
- —
- Eligible?
- —
No personal income docs; deal must DSCR.
Hard money
10% down · 12.0% · 12mo
- Down + closing
- —
- Monthly P&I
- —
- Monthly cashflow
- —
- DSCR
- —
- Eligible?
- —
Short-term bridge; refi at stabilization.
Rent comps 21 comps
| Address | Beds | Baths | Sqft | Rent | $/sqft | DOM | Units | Dist |
|---|---|---|---|---|---|---|---|---|
| 6055 S 11th Ave Phoenix, AZ | 2.0–3.0 | 1.0–2.0 | 956 | $1,600 | $1.67 | 1d | 7 | 0.39mi |
| 5405 S 19th Ave Phoenix, AZ | 1.0–3.0 | 1.0–2.0 | 867 | $1,570 | $1.81 | 1d | 4 | 0.47mi |
| 2050 W Southern Ave Phoenix, AZ | 2.0 | 2.0 | 907 | $1,438 | $1.59 | 1d | 1 | 0.55mi |
| 2050 W Southern Ave Unit 2 Phoenix, AZ | 2.0 | 2.0 | 907 | $1,438 | $1.59 | 2d | 1 | 0.55mi |
| 5646 S Montezuma St Apt 9 Phoenix, AZ | 2.0 | 1.0 | 850 | $1,150 | $1.35 | 1d | 1 | 0.81mi |
| 5609 S Central Ave Phoenix, AZ | 1.0–2.0 | 1.0–2.0 | 893 | $1,175 | $1.32 | 1d | 6 | 1.17mi |
| 40 E Sunland Ave Phoenix, AZ | 1.0–2.0 | 1.0–1.5 | 700 | $1,400 | $2.00 | 1d | 18 | 1.18mi |
| 222 E Cody Dr Unit 232 Phoenix, AZ | 2.0 | 1.0 | 700 | $1,199 | $1.71 | 10d | 1 | 1.34mi |
| 222 E Cody Dr Unit 231 Phoenix, AZ | 2.0 | 1.0 | 700 | $1,250 | $1.79 | 1d | 1 | 1.35mi |
| 222 E Cody Dr Unit 215 Phoenix, AZ | 2.0 | 1.0 | 700 | $1,050 | $1.50 | 10d | 1 | 1.35mi |
| 222 E Cody Dr Apt 221 Phoenix, AZ | 2.0 | 1.0 | 700 | $1,300 | $1.86 | 1d | 1 | 1.35mi |
| 222 E Cody Dr Unit 245 Phoenix, AZ | 2.0 | 1.0 | 700 | $1,199 | $1.71 | 1d | 1 | 1.36mi |
| 222 E Cody Dr Unit 142-RH Phoenix, AZ | 2.0 | 1.0 | 700 | $1,099 | $1.57 | 15d | 1 | 1.36mi |
| 222 E Cody Dr Unit 140 Phoenix, AZ | 2.0 | 1.0 | 700 | $1,299 | $1.86 | 14d | 1 | 1.36mi |
| 222 E Cody Dr Unit 229 Phoenix, AZ | 2.0 | 1.0 | 700 | $1,199 | $1.71 | 7d | 1 | 1.36mi |
| 222 E Cody Dr Apt 120 Phoenix, AZ | 2.0 | 1.0 | 700 | $1,350 | $1.93 | 1d | 1 | 1.36mi |
| 222 E Cody Dr Unit 103 Phoenix, AZ | 2.0 | 1.0 | 700 | $1,350 | $1.93 | 10d | 1 | 1.38mi |
| 27 E Corona Ave Phoenix, AZ | 2.0 | 1.0 | 880 | $1,300 | $1.48 | 24d | 6 | 1.39mi |
| 27 E Corona Ave Phoenix, AZ | 2.0 | 1.0 | 880 | $1,300 | $1.48 | 10d | 5 | 1.39mi |
| 27 E Corona Ave Phoenix, AZ | 2.0 | 1.0 | 880 | $1,338 | $1.52 | 1d | 6 | 1.39mi |
| 358 E Roeser Rd Phoenix, AZ | 3.0 | 1.0–2.0 | 698 | $1,995 | $2.86 | 1d | 5 | 1.41mi |
Listing history 3 events
-
2026-06-18days on market $79,900 Active 2 DOM
-
2026-06-17remarks 302-char remark
-
2026-06-17$79,900 Active 1 DOM
ⓘ Source: listings_history table (triggers on properties + properties_extension) + one-shot
backfill from property_details.listing_events for pre-trigger history.
Climate risk First Street
- Flood 1/10 Low FEMA zone X (shaded) · 0% chance over 30 yrs
- Wildfire 4/10 Moderate
- Heat 9/10 Extreme 7 d/yr ≥111°F today · 19 d/yr by 30 yrs out
- Wind 1/10 Low
- Air quality 2/10 Low 2 unhealthy d/yr today · 2 by 30 yrs out
Nearby sold comps map
Loading sold comps map…
Walkable amenities ~0.75 mi
Loading nearby amenities…
Taxation est. · year 1
- Rental income
- $19,950
- − Mortgage interest
- −$4,476
- − Property taxes
- −$1,198
- − Insurance
- −$400
- − Repairs & maintenance
- −$1,596
- − Management
- −$1,596
- − Depreciation
- −$2,324
- Taxable income
- $8,360
- Est. tax owed @ 24.0%
- −$2,006
- After-tax cash flow
- $7,128/yr
For passive investors: Depreciation is non-cash, so a rental often shows a tax loss while cash-flowing — sheltering income. Rental losses are passive: they offset passive income freely, and up to $25,000/yr can offset ordinary (W-2) income if you actively participate and your MAGI is under $100k (phasing out to $0 by $150k); unused losses carry forward. On sale, claimed depreciation is recaptured at up to 25%, and gains may owe capital-gains tax (a 1031 exchange can defer both). Figures are a year-1 estimate at your 24.0% rate — not tax advice; consult a CPA.
Schools (NCES district)
- District
- Roosevelt Elementary District (4279)
- NCES district ID
- 0407080
- Math proficiency
- 8% ▼ -13.00%
- Reading proficiency
- 14% ▼ -8.00%
- Median HH income
- $42,813
- Composite
- 9.74/100
- National rank
- #9829
- State rank
- #234 of 249 in AZ
Livability — Phoenix
- Score
- 75/100
- State rank
- #16
- US rank
- #3924
Category grades
Schools grade is shown separately in the Schools card above.
Census & demographics
- Census place
- Phoenix, AZ
- County
- Maricopa County · 4,537,380 people
- City population
- 1,500,198
- Metro
- Phoenix-Mesa-Chandler, AZ
- Population (ZIP)
- 63,862
- Household income
- $75,301
- Rent vs Own
- Severe rent burden
- 1473.0
Population outlook (Maricopa County) Hauer SSP2
- Today (2025)
- 4,979,203 people
- By 2030
- 5,378,229 · +8.0%
- By 2040
- 6,156,598 · +23.6%
- By 2050
- 6,872,376 · +38.0%
- By 2075
- 8,401,270 · +68.7%
- By 2100
- 9,247,439 · +85.7%
Race, ethnicity, and origin ACS 2023
- Neighborhood character
- Predominantly Hispanic (66%)
- Race & ethnicity
- Hispanic / Latino 66% Two or more races 28% Black 15% White 13% Native American 3% Asian 2%
- Hispanic origin (detail)
- Mexican 60%
- Common ancestry
- Romanian 1% Lithuanian 1% Slovak 1%
- Foreign-born
- 24% · Canada, Vietnam
- Languages at home
- 49% English-only · Spanish 45% Other Asian/Pacific 1% Other Indo-European 1%
Political lean MEDSL · Maricopa
- 2024 margin
- Toss-up / Even · D 47.7% · R 51.2% · Other 1.1%
- 2008→2024 swing
- +7.1pp toward D · 2008: -10.6pp · 2024: -3.5pp
- All cycles
- 2024: R+3.5 2020: D+2.2 2016: R+3.5 2012: R+12.0 2008: R+10.6
Not yet ingested
- Civics
- —
Market trends
- HPI YoY
- ▼ -168.81%
- Current HPI
- 342.4961
- Rent YoY
- ▼ -0.84%
- Metro
- Phoenix-Mesa-Chandler, AZ
- State GDP YoY
- ▲ 4.54%
- F500 in state
- 20
Industry mix (Fortune 500 HQ in AZ)
| Industry | F500 HQs | Revenue |
|---|---|---|
| Technology | 2 | $13B |
|
||
| Mining / Metals | 1 | $23B |
|
||
| Environmental Services | 1 | $16B |
|
||
| Metals / Steel | 1 | $14B |
|
||
| Technology Distribution | 1 | $9B |
|
||
| Homebuilding | 1 | $8B |
|
||
Price history
-10.7% since first listed12 events — show timeline
- 2026-06-16 Listed $79,900 ARMLS
- 2026-03-31 Price Changed $86,750 ARMLS
- 2026-03-18 Listed $89,500 ARMLS
- 2026-03-12 Pending — ARMLS
- 2026-03-12 Listed $89,500 ARMLS
- 2026-03-12 Listing Removed — ARMLS
- 2026-03-05 Pending — ARMLS
- 2026-03-05 Listed $89,500 ARMLS
- 2026-02-10 Pending — ARMLS
- 2026-01-13 Listed $89,500 ARMLS
- 2026-01-01 Listing Removed — ARMLS
- 2025-06-20 Listed $89,500 ARMLS
Cash-flow waterfall
monthlySold comps — $/sqft
last 12 mo · ≤1 miLoading sold comps…