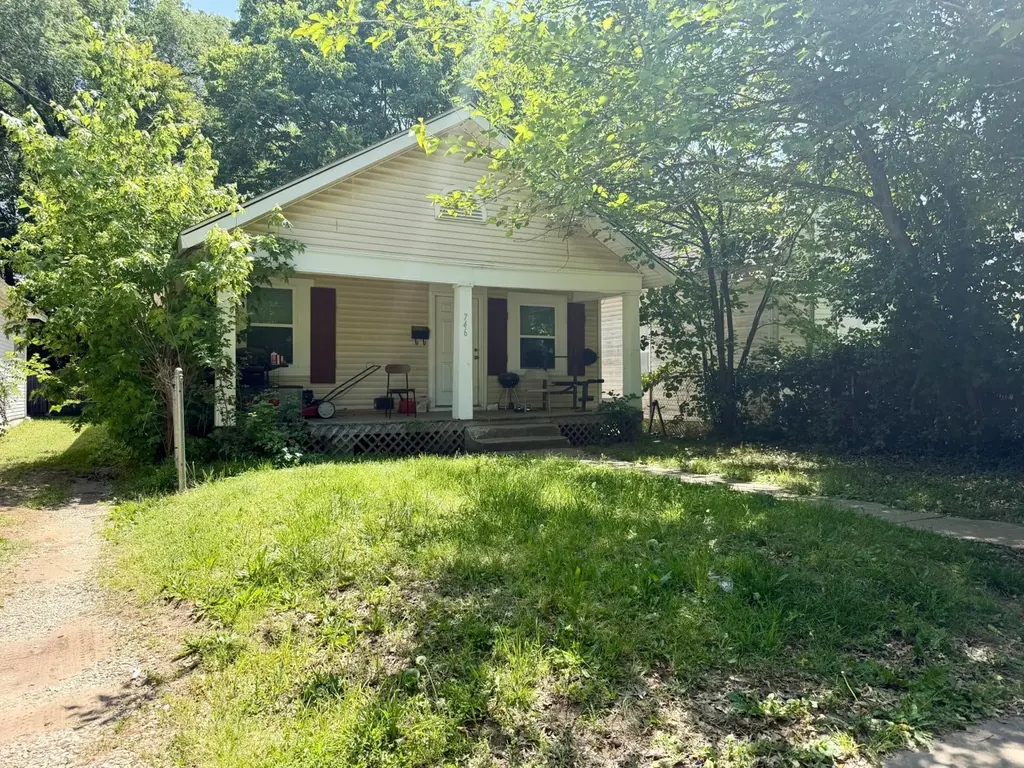
746 S Douglas Ave · Springfield, MO
Flood risk 1/10 · Minimal
- FEMA flood zone
- X (unshaded)
- Chance of flooding over 30 yrs
- 0.0%
- Est. flood insurance / yr
- $507 – $1,088
Fire risk 1/10 · Minimal
- Est. fire insurance / yr
- $1,054 – $1,958
Heat risk 5/10 · Moderate
- Hot days now (above 104°F)
- 7 days/yr
- Hot days in 30 yrs
- 17 days/yr
Wind risk 2/10 · Minimal
- Chance of severe wind over 30 yrs
- —
Air-quality risk 2/10 · Minimal
- Unhealthy air days now
- 1 days/yr
- Unhealthy air days in 30 yrs
- 2 days/yr
Risk factors via First Street. Map © Google.
Why this score? — see what drove the C+ grade
The composite is a weighted blend of 9 inputs, each scored 0–100. Each bar is that input's sub-score; the figure is the points it added to the 100-point composite (weight × sub-score).
- Cash flow +23.4/30.0
- ARV discount +15.0/15.0
- DSCR +7.5/10.0
- 1% rule +5.0/10.0
- Livability +3.8/5.0
- Rent growth +3.5/5.0
- Schools +3.2/10.0
- Condition / age +2.5/5.0
- Appreciation +0.0/10.0
$100,000
🖨 Deal sheet (PDF) 📄 Offer letter ✓ Due diligence
Listing remarks
Excellent investment opportunity with endless potential! This property is the perfect candidate for a flip, rental, or long-term addition to your investment portfolio. With solid bones and plenty of opportunity to add value, this home is ready for the right investor to bring their vision and creativity. Whether you're looking to renovate and resell or create a strong rental property, the possibilities here are tremendous. Affordable opportunities with this much potential are becoming harder to find, making this a great chance for investors, flippers, or handy buyers looking to build equity. Property is sold 'As-IS'.
Key facts
- 5,227 sq ft lot
- Built 1900
- Listed 38 days
Property features AI
Finance
- Other: MLS-specific codes and links excluded
- Financial info: Tax annual amount reported
- HOA & community: HOA information not specified
Exterior
- Parking: Parking details not specified
- Security: Not specified
- Utilities: Public water; Public sewer
- Home design: Single-family residence; Residential property; One story
- Construction: Built area above grade: 884 (reported); Construction year not specified; Construction materials and foundation not specified; Roof type not specified
- Exterior features: Lot approximately 0.12 acre; Subdivision: Greene-Not in List; Directions: West on State off South Campbell, South on Douglas
Interior
- Kitchen: Appliances not specified
- Bedrooms: Not specified
- Flooring: Not specified
- Bathrooms: 1 full bathroom
- Heating & cooling: No heating; No cooling
- Interior features: One level layout
- Laundry & utility: Laundry details not specified
Neighborhood map
What this means for you Summary
Snapshot
- This is a 2-bed/1.0-bath single-family listed at $100k.
Deal economics
- At list price, monthly cash flow is $185 ($2k/yr) — positive.
- The deal already cash-flows at list — no discount required.
- To meet the 1% rule (rent ≥ 1% of price), the offer needs to be $100k (0.4% below list).
- Recommended offer: $97k (3.0% below list) — sets the bar for market timing.
- Cap rate 8.5% vs local median 4.6% in Springfield — top-decile yield for the area; either an underpriced asset or a hidden risk that comps aren't pricing in. Stress-test before assuming the spread holds.
Location & tenants
- Location reads 75/100 on livability (#57 in MO, #4,121 nationally) — a middle-class / working-renter tenant base. Strengths: commute A+, cost of living A+, housing A+; Watch: crime F, employment F.
- Springfield R-XII (urban): math 32% / reading 46% proficiency, ranked #174 of 324 in MO (top 54%) — families likely to look elsewhere, expect single-tenant / working-renter base with shorter leases.
- Zoned schools: Mcgregor Elem. (math 12% / reading 17%, grade F, #993 of 1,115 statewide, top 90%, 271 students, 90% FRL); Westport Middle School (math 12% / reading 29%, grade F, #344 of 391 statewide, top 88%, 433 students, 87% FRL); Parkview High (math 11% / reading 40%, grade F, #433 of 521 statewide, top 83%, 1,234 students, 62% FRL) — zoned schools average 80% FRL vs 46% district-wide (33 pts higher); higher-poverty schools than district average — tighter screening recommended.
- Zoned-school proficiency averages 20% at this address vs 39% district-wide (-19 pts) — the specific schools serving this property underperform the Springfield R-XII average; the district grade overstates school quality for this exact location.
- Market conditions: Rents rising fast (+4.2%/yr); 88 active listings in the ZIP; 40 comparable units currently listed for rent nearby; rentals at typical pace (median 26d on market — plan ~3-4 weeks tenant-placement turnaround); 45% of comp listings sitting > 30 days — soft ceiling on asking rent; lower-income renter base — watch delinquency; 1,302 units permitted in Greene County in 2024 (250 in 5+ unit buildings).
- This rent runs 42% of the median local income ($28k/yr) — at the standard rent-burdened threshold; future hikes will face affordability resistance.
Forward outlook
- Local home prices are declining (-3.0%/yr); year-one equity from $691 of loan paydown is wiped out by about $3k of value loss. Plan a longer hold.
- Greene County population projected at +25% by 2050 — long-run rental-demand tailwind backs the buy-and-hold thesis.
Negotiation context
- It's been on market 38 days — a 3% lower offer ($97k) is reasonable based on typical stale-listing flexibility.
- 3 sale attempts since 10y ago with the ask held roughly flat each time — persistent listings suggest the price (not the market) is what's stuck; bring a comps-based counter.
Risks & watch-outs
- Watch-outs: built in 1900 — expect roof / HVAC / electrical / plumbing capex.
- Climate carrying-cost: extreme-heat days projected 7→17/yr by 2055 (HVAC capex compounding) — expect insurance premiums to compound above CPI over the hold.
Questions for the listing agent
- It's been on market 38 days. Have you received any prior offers? Is the seller open to a 3% concession, seller financing, or rate buy-down credit?
- Built in 1900 — when were the roof, HVAC, electrical panel, plumbing, and water heater last replaced?
- Is there a deadline driving the sale (1031 exchange, divorce, estate, relocation)? That informs how much negotiation room exists.
- Crime grade is F in this area — have there been break-ins, vandalism, or insurance claims at this property in the last 3 years? What carrier currently insures it and at what premium?
- What's the average days-on-market for RENTAL listings here right now (not sales)? A rising rental-DOM trend means longer vacancies and softer asking-rent achievability than the comps imply.
- What's the recent tenant-quality profile in this submarket — average credit score on applications, eviction rate, late-payment / NSF rate, and stable-employment percentage? A property-management company in the area should have these aggregated.
- How much new for-sale + rental construction is in the pipeline within 1–3 miles? Heavy new supply typically softens prices + rents 12–24 months out; constrained supply supports both.
Investment metrics
- 1% rule
- 1.00% ✗
- Cap rate
- 8.52%
- Cash-on-cash
- 7.94%
- DSCR
- 1.35
- GRM
- 8.4
CMA / ARV
- ARV (median comp)
- $138,641
- List price
- $100,000
- Delta
- -27.87%
- Verdict
- UNDERPRICED
- Comps
- 20 within 1.0 mi
Show comp detail 12 sales within ~0.75 mi
| Address | Dist | Beds/Ba | Sqft | Sold | Price | $/sf | Match |
|---|---|---|---|---|---|---|---|
| 735 S Missouri Ave | 0.12mi | 2/1.0 | 904 (+2%) | 1mo | $140,000 | $155 | 90 |
| 942 S Market Ave | 0.32mi | 2/1.0 | 884 (0%) | 6mo | $139,000 | $157 | 80 |
| 864 S Main Ave | 0.20mi | 2/1.0 | 968 (+10%) | 2mo | $182,000 | $188 | 73 |
| 920 S Douglas Ave | 0.21mi | 3/1.0 (+1) | 956 (+8%) | 1mo | $139,900 | $146 | 70 |
| 925 W Mount Vernon St | 0.28mi | 2/1.0 | 990 (+12%) | 6mo | $129,900 | $131 | 62 |
| 1068 S Broadway Ave | 0.46mi | 2/1.0 | 821 (-7%) | 7mo | $139,900 | $170 | 61 |
| 1530 W Lombard St | 0.69mi | 2/1.0 | 840 (-5%) | 2mo | $145,000 | $173 | 58 |
| 936 S Douglas Ave | 0.24mi | 3/1.5 (+1) | 1,000 (+13%) | 2mo | $89,000 | $89 | 58 |
| 1139 S Fort Ave | 0.69mi | 3/1.0 (+1) | 890 (+1%) | 5mo | $218,000 | $245 | 57 |
| 845 S Newton Ave | 0.55mi | 2/1.0 | 962 (+9%) | 7mo | $134,900 | $140 | 54 |
| 942 S Nettleton Ave | 0.64mi | 2/2.0 | 816 (-8%) | 1mo | $122,900 | $151 | 53 |
| 1012 S Fort Ave | 0.53mi | 2/1.0 | 768 (-13%) | 1mo | $105,000 | $137 | 52 |
Match score weights: distance 35% · size 25% · config 20% · recency 20%. Top-matched comps best support the ARV.
Projected returns pro-forma
-3.0% appreciation · 4.17% rent growth · sell at horizon
- IRR
- -3.1%
- Equity multiple
- 0.88×
- Total profit
- $-3,260
- Equity at exit
- $14,910
- IRR
- 7.7%
- Equity multiple
- 1.61×
- Total profit
- $17,176
- Equity at exit
- $8,646
Cash invested: $28,000 (down + closing). Projections, not guarantees.
Landlord ↔ Tenant lean methodology
- Overall (STATE)
- 81 Strongly Landlord-Friendly
- State Missouri
- 81 Strongly Landlord-Friendly · R+10
- County
- — inherits STATE
- City
- — inherits STATE
ZIP-level market 65806
- Home prices YoY
- -11.7%
- Rents YoY
- 4.2%
- Active inventory
- 88
- Price-to-rent
- 8.4×
Monthly cashflow live
- Estimated rent
- $996 high interval (Pro) →
- Mortgage (P&I)
- −$524
- Tax from tax record
- −$35 /mo · $426/yr
- Insurance
- −$42
- HOA
- −$0
- Lot rent
- −$0
- Vacancy / Maint / Mgmt
- −$209
- Net cashflow
- $185
Break-even live
Sensitivity live
| Price | -10% $242 | -5% $214 | +0% $185 | +5% $157 | +10% $129 |
|---|---|---|---|---|---|
| Rent | -10% $107 | -5% $146 | +0% $185 | +5% $225 | +10% $264 |
| Rate | -1.0pp $236 | -0.5pp $211 | base $185 | +0.5pp $159 | +1.0pp $133 |
UW: 25.0% down · 7.5% · 30yr · 1.5% tax · 5.0% vac · 8.0% maint · 8.0% mgmt
Financing live
Cash to close
- Down payment
- $25,000
- Closing costs
- $3,000
- Reserves months
- —
- Total cash needed
- —
Loan-product check · same deal, 3 products live
Conventional
25% down · 7.5% · 30yr
- Down + closing
- —
- Monthly P&I
- —
- Monthly cashflow
- —
- DSCR
- —
- Eligible?
- —
Personal DTI + credit; lowest rate.
DSCR
20% down · 8.5% · 30yr
- Down + closing
- —
- Monthly P&I
- —
- Monthly cashflow
- —
- DSCR
- —
- Eligible?
- —
No personal income docs; deal must DSCR.
Hard money
10% down · 12.0% · 12mo
- Down + closing
- —
- Monthly P&I
- —
- Monthly cashflow
- —
- DSCR
- —
- Eligible?
- —
Short-term bridge; refi at stabilization.
Rent comps 40 comps
| Address | Beds | Baths | Sqft | Rent | $/sqft | DOM | Units | Dist |
|---|---|---|---|---|---|---|---|---|
| 847 S Grant Ave Springfield, MO | 2.0 | 1.0 | 1080 | $815 | $0.75 | 46d | 1 | 0.13mi |
| 930 W Harrison St Springfield, MO | 3.0 | 2.0 | 1046 | $1,150 | $1.10 | 16d | 1 | 0.22mi |
| 1036 W Monroe Ter Springfield, MO | 2.0 | 1.0 | 812 | $795 | $0.98 | 25d | 1 | 0.27mi |
| 505 W Grand St Springfield, MO | 1.0–2.0 | 1.0–2.0 | 996 | $1,395 | $1.40 | 16d | 1 | 0.31mi |
| 433 W Grand St Unit C Springfield, MO | 2.0 | 1.0 | 1023 | $1,295 | $1.27 | 46d | 1 | 0.34mi |
| 513 S Broadway Ave Springfield, MO | 2.0 | 1.0 | 800 | $855 | $1.07 | 46d | 1 | 0.36mi |
| 865 S Douglas Ave Springfield, MO | 2.0 | 2.0 | 850 | $895 | $1.05 | 16d | 4 | 0.37mi |
| 301 W State St Unit D Springfield, MO | 1.0 | 1.0 | 570 | $875 | $1.54 | 25d | 1 | 0.38mi |
| 1044 S Main Ave Springfield, MO | 2.0 | 1.0 | 1089 | $1,050 | $0.96 | 46d | 1 | 0.39mi |
| 741 South Ave Unit 5 Springfield, MO | 1.0 | 1.0 | 950 | $750 | $0.79 | 46d | 1 | 0.39mi |
| 755 South Ave Unit 2 Springfield, MO | 1.0 | 1.0 | 600 | $850 | $1.42 | 25d | 1 | 0.40mi |
| 901 South Ave Springfield, MO | 2.0–3.0 | 1.0–2.0 | 695 | $825 | $1.19 | 46d | 1 | 0.43mi |
| 806 South Ave Springfield, MO | 1.0 | 1.0 | 670 | $1,085 | $1.62 | 16d | 3 | 0.44mi |
| 1112 S Grant Ave Springfield, MO | 1.0 | 1.0 | 800 | $1,095 | $1.37 | 46d | 1 | 0.47mi |
| 627 S Fort Ave Springfield, MO | 2.0 | 1.0 | 880 | $895 | $1.02 | 25d | 1 | 0.48mi |
| 535 W Walnut St Springfield, MO | 2.0 | 2.0 | 1096 | $1,495 | $1.36 | 46d | 1 | 0.49mi |
| 430 W Pershing St Springfield, MO | 2.0 | 2.0 | 765 | $1,195 | $1.56 | 16d | 1 | 0.49mi |
| 733 W College St Springfield, MO | 1.0 | 1.0 | 700 | $750 | $1.07 | 16d | 1 | 0.53mi |
| 1200 W Walnut St Springfield, MO | 2.0 | 2.0 | 1000 | $995 | $0.99 | 16d | 3 | 0.54mi |
| 211 S Market Ave Springfield, MO | 2.0–4.0 | 1.0–2.0 | 1442 | $1,425 | $0.99 | 25d | 5 | 0.56mi |
| 211 S Market Ave Springfield, MO | 2.0–4.0 | 1.0–2.0 | 1442 | $1,425 | $0.99 | 23d | 5 | 0.56mi |
| 810 W Catalpa St Apt 302 Springfield, MO | 2.0 | 1.0 | 806 | $664 | $0.82 | 25d | 1 | 0.57mi |
| 810 W Catalpa St Apt 316 Springfield, MO | 1.0 | 1.0 | 581 | $551 | $0.95 | 25d | 1 | 0.57mi |
| 305 S Campbell Ave Unit 208 Springfield, MO | 1.0 | 1.0 | 649 | $975 | $1.50 | 16d | 1 | 0.57mi |
| 235 N Market Ave Springfield, MO | 1.0–4.0 | 1.0–2.0 | 1350 | $1,267 | $0.94 | 16d | 4 | 0.64mi |
| 235 N Market Ave Springfield, MO | 1.0–4.0 | 1.0–2.0 | 1350 | $1,267 | $0.94 | 25d | 5 | 0.64mi |
| 209 W McDaniel St Unit 209-207 Springfield, MO | 1.0 | 1.0 | 700 | $950 | $1.36 | 46d | 1 | 0.64mi |
| 533 Bear Blvd Unit 111 Springfield, MO | 1.0 | 1.0 | 1100 | $649 | $0.59 | 46d | 1 | 0.69mi |
| 138 Park Central Sq Springfield, MO | 1.0–2.0 | 1.0–2.0 | 1083 | $2,489 | $2.30 | 16d | 8 | 0.70mi |
| 511 E Cherry St Unit 2 Springfield, MO | 1.0 | 1.0 | 700 | $850 | $1.21 | 46d | 1 | 0.71mi |
| 309 S Jefferson Ave Unit 211 Springfield, MO | 2.0 | 2.0 | 762 | $767 | $1.01 | 46d | 1 | 0.71mi |
| 627 Bear Blvd Springfield, MO | 2.0 | 2.0 | 943 | $1,400 | $1.48 | 46d | 2 | 0.78mi |
| 813 W Poplar St Unit 813 Springfield, MO | 2.0 | 1.0 | 560 | $795 | $1.42 | 16d | 1 | 1.03mi |
| 1740 W Olive St Springfield, MO | 3.0 | 1.0 | 736 | $1,195 | $1.62 | 16d | 1 | 1.04mi |
| 1911 W Elm St Springfield, MO | 2.0 | 1.0 | 580 | $875 | $1.51 | 46d | 1 | 1.04mi |
| 815 N Grant Ave Unit A Springfield, MO | 2.0 | 1.0 | 801 | $625 | $0.78 | 46d | 1 | 1.10mi |
| 937 E Elm St Unit 07 Springfield, MO | 2.0 | 1.0 | 893 | $1,025 | $1.15 | 46d | 1 | 1.10mi |
| 926 E Walnut St Unit 11 Springfield, MO | 2.0 | 2.0 | 990 | $1,075 | $1.09 | 46d | 1 | 1.11mi |
| 945 E Elm St Unit 07 Springfield, MO | 1.0 | 1.0 | 759 | $875 | $1.15 | 46d | 1 | 1.12mi |
| 1735 W Bennett St Springfield, MO | 1.0 | 1.0 | 800 | $1,124 | $1.41 | 16d | 2 | 1.13mi |
Listing history 20 events
-
2026-06-22days on market $100,000 Active 38 DOM
-
2026-06-18days on market $100,000 Active 35 DOM
-
2026-06-17days on market $100,000 Active 34 DOM
-
2026-06-16days on market $100,000 Active 33 DOM
-
2026-06-15days on market $100,000 Active 32 DOM
-
2026-06-14days on market $100,000 Active 30 DOM
-
2026-06-10days on market $100,000 Active 27 DOM
-
2026-06-09days on market $100,000 Active 26 DOM
-
2026-06-08days on market $100,000 Active 25 DOM
-
2026-06-07days on market $100,000 Active 24 DOM
-
2026-06-03days on market $100,000 Active 20 DOM
-
2026-06-02days on market $100,000 Active 19 DOM
-
2026-06-01days on market $100,000 Active 18 DOM
-
2026-05-31days on market $100,000 Active 17 DOM
-
2026-05-30days on market $100,000 Active 16 DOM
-
2026-05-14$100,000 Active 623-char remark
-
2023-08-05historical $895
-
2023-08-02$895
-
2019-05-24soldstatus $350,000
-
2016-06-21$83,777
ⓘ Source: listings_history table (triggers on properties + properties_extension) + one-shot
backfill from property_details.listing_events for pre-trigger history.
Tax reassessment forecast MO · Resets to sale price
- Current annual tax
- $426 · $35/mo
- Projected year-2 tax
- $970 · $81/mo
- Expected delta
- +$544/yr (+$45/mo · 127.7%)
ⓘ Screening estimate from a state-policy table — verify with the county assessor before closing.
Climate risk First Street
- Flood 1/10 Low FEMA zone X (unshaded) · 0% chance over 30 yrs
- Wildfire 1/10 Low
- Heat 5/10 Major 7 d/yr ≥104°F today · 17 d/yr by 30 yrs out
- Wind 2/10 Low
- Air quality 2/10 Low 1 unhealthy d/yr today · 2 by 30 yrs out
Nearby sold comps map
Loading sold comps map…
Walkable amenities ~0.75 mi
Loading nearby amenities…
Taxation est. · year 1
- Rental income
- $11,952
- − Mortgage interest
- −$5,602
- − Property taxes
- −$426
- − Insurance
- −$500
- − Repairs & maintenance
- −$956
- − Management
- −$956
- − Depreciation
- −$2,909
- Taxable income
- $603
- Est. tax owed @ 24.0%
- −$145
- After-tax cash flow
- $2,078/yr
For passive investors: Depreciation is non-cash, so a rental often shows a tax loss while cash-flowing — sheltering income. Rental losses are passive: they offset passive income freely, and up to $25,000/yr can offset ordinary (W-2) income if you actively participate and your MAGI is under $100k (phasing out to $0 by $150k); unused losses carry forward. On sale, claimed depreciation is recaptured at up to 25%, and gains may owe capital-gains tax (a 1031 exchange can defer both). Figures are a year-1 estimate at your 24.0% rate — not tax advice; consult a CPA.
Schools (NCES district)
- District
- Springfield R-XII
- NCES district ID
- 2928860
- Math proficiency
- 32% ▼ -2.00%
- Reading proficiency
- 46% ▼ -3.00%
- Median HH income
- $37,886
- Composite
- 32.45/100
- National rank
- #5717
- State rank
- #174 of 324 in MO
Livability — Springfield
- Score
- 75/100
- State rank
- #57
- US rank
- #4121
Category grades
Schools grade is shown separately in the Schools card above.
Census & demographics
- Census place
- Springfield, MO
- County
- Greene County · 244,327 people
- City population
- 223,044
- Metro
- Springfield, MO
- Population (ZIP)
- 13,692
- Household income
- $28,165
- Rent vs Own
- Severe rent burden
- 1966.0
Population outlook (Greene County) Hauer SSP2
- Today (2025)
- 319,054 people
- By 2030
- 335,135 · +5.0%
- By 2040
- 366,186 · +14.8%
- By 2050
- 397,431 · +24.6%
- By 2075
- 477,035 · +49.5%
- By 2100
- 520,828 · +63.2%
Race, ethnicity, and origin ACS 2023
- Neighborhood character
- Predominantly White (75%)
- Race & ethnicity
- White 75% Two or more races 8% Hispanic / Latino 7% Black 6% Asian 3%
- Hispanic origin (detail)
- Mexican 4%
- Common ancestry
- Slovak 2% Italian 1% Scotch-Irish 1%
- Foreign-born
- 7% · Canada, China, Vietnam
- Languages at home
- 91% English-only · Spanish 4% Other Indo-European 2% Other Asian/Pacific 1%
Political lean MEDSL · Greene
- 2024 margin
- Strong R (+20.8) · D 38.9% · R 59.7% · Other 1.4%
- 2008→2024 swing
- -5.0pp toward R · 2008: -15.8pp · 2024: -20.8pp
- All cycles
- 2024: R+20.8 2020: R+20.1 2016: R+27.4 2012: R+24.4 2008: R+15.8
Not yet ingested
- Civics
- —
Market trends
- HPI YoY
- ▼ -27.72%
- Current HPI
- 208.8156
- Rent YoY
- ▲ 4.17%
- Metro
- Springfield, MO
- State GDP YoY
- ▲ 1.84%
- F500 in state
- 20
Industry mix (Fortune 500 HQ in MO)
| Industry | F500 HQs | Revenue |
|---|---|---|
| Healthcare | 1 | $163B |
|
||
| Insurance | 1 | $21B |
|
||
| Industrial Technology | 1 | $17B |
|
||
| Retail | 1 | $16B |
|
||
| Industrial Distribution | 1 | $10B |
|
||
| Utilities | 1 | $9B |
|
||
Price history
+19.4% since first listed5 events — show timeline
- 2026-05-14 Listed $100,000 SOMO
- 2023-08-05 Rental Removed $895 APPFOLIO
- 2023-08-02 Listed for Rent $895 APPFOLIO
- 2019-05-24 Sold (Public Records) $350,000 Public Records
- 2016-06-21 Listed $83,777 SOMO
Property tax history
+5.4%/yrLatest (2025): $426 · +19.4% YoY. Source: county tax records.
Cash-flow waterfall
monthlySold comps — $/sqft
last 12 mo · ≤1 miLoading sold comps…