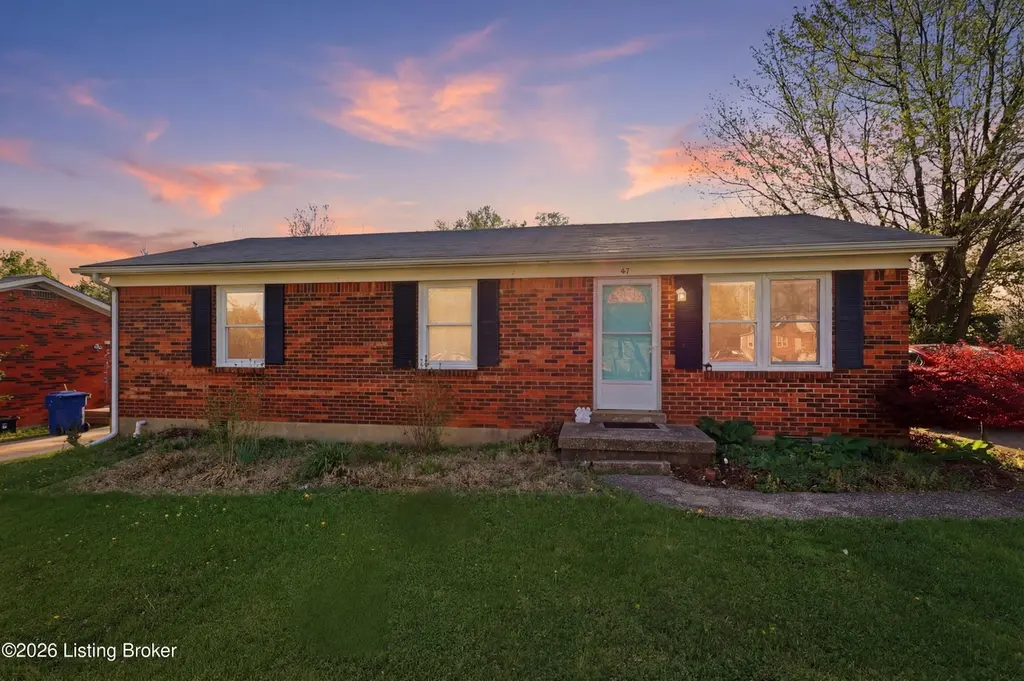
67 Arbor Green Ln · Shelbyville, KY
Flood risk 1/10 · Minimal
- FEMA flood zone
- X (unshaded)
- Chance of flooding over 30 yrs
- 0.0%
- Est. flood insurance / yr
- $473 – $860
Fire risk 2/10 · Minimal
- Est. fire insurance / yr
- $839 – $1,559
Heat risk 4/10 · Minor
- Hot days now (above 104°F)
- 7 days/yr
- Hot days in 30 yrs
- 20 days/yr
Wind risk 2/10 · Minimal
- Chance of severe wind over 30 yrs
- 3.0%
Air-quality risk 2/10 · Minimal
- Unhealthy air days now
- 1 days/yr
- Unhealthy air days in 30 yrs
- 2 days/yr
Risk factors via First Street. Map © Google.
Why this score? — see what drove the D- grade
The composite is a weighted blend of 9 inputs, each scored 0–100. Each bar is that input's sub-score; the figure is the points it added to the 100-point composite (weight × sub-score).
- Cash flow +14.4/30.0
- ARV discount +6.5/15.0
- DSCR +4.4/10.0
- Livability +3.8/5.0
- 1% rule +2.8/10.0
- Schools +2.8/10.0
- Rent growth +2.5/5.0
- Condition / age +2.5/5.0
- Appreciation +0.0/10.0
$208,000
🖨 Deal sheet 📄 Offer letter ✓ Due diligence
Listing remarks MLS
THIS ALL BRICK 3 BEDROOM, 1 BATH HOME - is Move-In Ready for a 1st time buyer or Investor! Approx $40k in Updates in 2021 include: All new plank flooring was installed throughout. New cabinets in the kitchen, New water heater, New Refrigerator, Oven replaced with a used but in excellent condition Stove/oven, Wall mounted air conditioner installed in kitchen/dining area, New Ceiling Fans throughout, Baseboard heaters replaced, Thermostats replaced, All new electrical wall plugs throughout, Interior all painted, A couple of new lights installed, New bathroom cabinets, toilet, & tub. Crawl space cleaned & a sump pump installed as well as a vapor barrier on the ground and up the walls. This is a Must See for the price!
Key facts
- All brick
- 7,800 sq ft lot
- Parking
Tags
Neighborhood map
What this means for you Summary
Snapshot
- This is a 3-bed/1.0-bath single-family listed at $208k.
Deal economics
- At list price, monthly cash flow is $40 ($482/yr) — positive.
- The deal already cash-flows at list — no discount required.
- To meet the 1% rule (rent ≥ 1% of price), the offer needs to be $162k (22.0% below list).
- Recommended offer: $162k (22.0% below list) — sets the bar for 1% rule.
- Cap rate 6.5% vs local median 3.5% in Shelbyville — top-decile yield for the area; either an underpriced asset or a hidden risk that comps aren't pricing in. Stress-test before assuming the spread holds.
Location & tenants
- Location reads 75/100 on livability (#101 in KY, #4,143 nationally) — a middle-class / working-renter tenant base. Strengths: cost of living A+, housing A+, crime A; Watch: schools D, amenities F, commute F.
- Shelby County (town): math 26% / reading 37% proficiency, ranked #77 of 165 in KY (top 47%) — families likely to look elsewhere, expect single-tenant / working-renter base with shorter leases.
- Market conditions: 292 active listings in the ZIP; 9 comparable units currently listed for rent nearby; rentals at typical pace (median 17d on market — plan ~3-4 weeks tenant-placement turnaround); solid renter incomes; 237 units permitted in Shelby County in 2024 (0 in 5+ unit buildings).
Forward outlook
- Local home prices are declining (-3.0%/yr); year-one equity from $1k of loan paydown is wiped out by about $6k of value loss. Plan a longer hold.
- Shelby County population projected at +34% by 2050 — long-run rental-demand tailwind backs the buy-and-hold thesis.
Negotiation context
- It's been on market 62 days — a 6% lower offer ($196k) is reasonable based on typical stale-listing flexibility.
- 2 sale attempts since 21y ago with the ask held roughly flat each time — persistent listings suggest the price (not the market) is what's stuck; bring a comps-based counter.
Questions for the listing agent
- It's been on market 62 days. Have you received any prior offers? Is the seller open to a 22% concession, seller financing, or rate buy-down credit?
- Why hasn't it sold? Are there any deal-killer items the seller is aware of (foundation, flood, title, zoning, code violations)?
- Is there a deadline driving the sale (1031 exchange, divorce, estate, relocation)? That informs how much negotiation room exists.
- Schools are D-rated, which usually means shorter tenancies and higher turnover. Who's the typical renter profile here, and what's been the actual vacancy rate?
- The area grade is low — what's the realistic commute time and amenity access for the typical tenant pool here? Any planned neighborhood developments (good or bad) we should know about?
- What's the average days-on-market for RENTAL listings here right now (not sales)? A rising rental-DOM trend means longer vacancies and softer asking-rent achievability than the comps imply.
- What's the recent tenant-quality profile in this submarket — average credit score on applications, eviction rate, late-payment / NSF rate, and stable-employment percentage? A property-management company in the area should have these aggregated.
- How much new for-sale + rental construction is in the pipeline within 1–3 miles? Heavy new supply typically softens prices + rents 12–24 months out; constrained supply supports both.
Investment metrics
- 1% rule
- 0.78% ✗
- Cap rate
- 6.52%
- Cash-on-cash
- 0.83%
- DSCR
- 1.04
- GRM
- 10.7
CMA / ARV
- ARV (median comp)
- $203,450
- List price
- $208,000
- Delta
- 2.24%
- Verdict
- FAIR
- Comps
- 20 within 1.0 mi
Show comp detail 12 sales within ~0.75 mi
| Address | Dist | Beds/Ba | Sqft | Sold | Price | $/sf | Match |
|---|---|---|---|---|---|---|---|
| 1805 Oakwood Ct | 0.13mi | 3/1.0 | 1,061 (-1%) | 2mo | $204,000 | $192 | 90 |
| 1632 Juniper Dr | 0.07mi | 3/1.0 | 1,005 (-6%) | 13mo | $205,000 | $204 | 75 |
| 1808 Oakwood Dr | 0.16mi | 3/1.0 | 975 (-9%) | 3mo | $215,000 | $221 | 74 |
| 67 Juniper Dr | 0.18mi | 3/2.0 | 975 (-9%) | 4mo | $235,900 | $242 | 69 |
| 1614 Lakeside Dr | 0.48mi | 2/1.0 (-1) | 1,100 (+2%) | 2mo | $220,000 | $200 | 67 |
| 3730 Mareli Rd | 0.49mi | 3/1.0 | 1,050 (-2%) | 10mo | $189,500 | $180 | 65 |
| 1728 Cherry Ln | 0.41mi | 2/1.0 (-1) | 1,004 (-7%) | 1mo | $214,000 | $213 | 64 |
| 1826 Blackwell Rd | 0.36mi | 3/2.0 | 1,200 (+12%) | 4mo | $275,000 | $229 | 56 |
| 232 Fletcher Way | 0.23mi | 3/2.0 | 1,212 (+13%) | 12mo | $275,000 | $227 | 54 |
| 1608 Lakeside Dr | 0.49mi | 3/1.5 | 960 (-11%) | 10mo | $220,000 | $229 | 48 |
| 1017 Horse Shoe Dr | 0.47mi | 2/2.0 (-1) | 1,200 (+12%) | 9mo | $234,000 | $195 | 42 |
| 91 Smithfield Rd | 0.49mi | 2/1.0 (-1) | 950 (-12%) | 14mo | $175,000 | $184 | 42 |
Match score weights: distance 35% · size 25% · config 20% · recency 20%. Top-matched comps best support the ARV.
Projected returns pro-forma
-3.0% appreciation · 3.0% rent growth · sell at horizon
- IRR
- -15.0%
- Equity multiple
- 0.46×
- Total profit
- $-31,245
- Equity at exit
- $31,013
- IRR
- -6.5%
- Equity multiple
- 0.58×
- Total profit
- $-24,307
- Equity at exit
- $17,984
Cash invested: $58,240 (down + closing). Projections, not guarantees.
Landlord ↔ Tenant lean methodology
- Overall (STATE)
- 83 Strongly Landlord-Friendly
- State Kentucky
- 83 Strongly Landlord-Friendly · R+16
- County
- — inherits STATE
- City
- — inherits STATE
ZIP-level market 40065
- Active inventory
- 292
- Price-to-rent
- 10.7×
Monthly cashflow live
- Estimated rent
- $1,622 high interval (Pro) →
- Mortgage (P&I)
- −$1,091
- Tax from tax record
- −$64 /mo · $764/yr
- Insurance
- −$87
- HOA
- −$0
- Vacancy / Maint / Mgmt
- −$341
- Net cashflow
- $40
Break-even live
UW: 25.0% down · 7.5% · 30yr · 1.5% tax · 5.0% vac · 8.0% maint · 8.0% mgmt
Financing live
Cash to close
- Down payment
- $52,000
- Closing costs
- $6,240
- Reserves months
- —
- Total cash needed
- —
Loan-product check · same deal, 3 products live
Conventional
25% down · 7.5% · 30yr
- Down + closing
- —
- Monthly P&I
- —
- Monthly cashflow
- —
- DSCR
- —
- Eligible?
- —
Personal DTI + credit; lowest rate.
DSCR
20% down · 8.5% · 30yr
- Down + closing
- —
- Monthly P&I
- —
- Monthly cashflow
- —
- DSCR
- —
- Eligible?
- —
No personal income docs; deal must DSCR.
Hard money
10% down · 12.0% · 12mo
- Down + closing
- —
- Monthly P&I
- —
- Monthly cashflow
- —
- DSCR
- —
- Eligible?
- —
Short-term bridge; refi at stabilization.
Rent comps 9 comps
| Address | Beds | Baths | Sqft | Rent | $/sqft | DOM | Units | Dist |
|---|---|---|---|---|---|---|---|---|
| 1814 Oakwood Dr Shelbyville, KY | 3.0 | 1.0 | 1050 | $1,599 | $1.52 | 44d | 1 | 0.19mi |
| 1856 Blackwell Rd Unit 1858 Blackwell Shelbyville, KY | 3.0 | 2.0 | 1100 | $1,695 | $1.54 | 44d | 1 | 0.25mi |
| 121 Spencer Ct Shelbyville, KY | 3.0 | 2.0 | 1135 | $1,695 | $1.49 | 17d | 1 | 0.30mi |
| 1569 Sanford Ln Shelbyville, KY | 1.0–2.0 | 1.0–2.0 | 1017 | $1,225 | $1.20 | 2d | 5 | 0.39mi |
| 874 Marian Village Dr Shelbyville, KY | 2.0–3.0 | 1.5–2.0 | 1015 | $1,475 | $1.45 | 2d | 4 | 0.92mi |
| 103 Martin Luther King Jr St Shelbyville, KY | 2.0 | 1.0 | 909 | $1,295 | $1.42 | 17d | 1 | 1.13mi |
| 113 Ada Ave Shelbyville, KY | 2.0 | 1.5 | 1008 | $1,025 | $1.02 | 44d | 1 | 1.21mi |
| 149 Gray Hill Ct Shelbyville, KY | 2.0 | 1.5 | 1050 | $895 | $0.85 | 24d | 1 | 1.28mi |
| 1225 Old Finchville Rd Shelbyville, KY | 1.0–2.0 | 1.0–2.0 | 971 | $1,325 | $1.36 | 2d | 4 | 1.30mi |
Listing history 18 events
-
2026-06-18days on market $208,000 Active 62 DOM
-
2026-06-17days on market $208,000 Active 61 DOM
-
2026-06-16days on market $208,000 Active 60 DOM
-
2026-06-15days on market $208,000 Active 59 DOM
-
2026-06-13days on market $208,000 Active 57 DOM
-
2026-06-13days on market $208,000 Active 56 DOM
-
2026-06-10days on market $208,000 Active 54 DOM
-
2026-06-09days on market $208,000 Active 53 DOM
-
2026-06-08days on market $208,000 Active 52 DOM
-
2026-06-07days on market $208,000 Active 51 DOM
-
2026-06-05days on market $208,000 Active 48 DOM
-
2026-06-03days on market $208,000 Active 47 DOM
-
2026-06-02pricedays on market $208,000 Active 46 DOM
-
2026-06-01days on market $209,500 Active 45 DOM
-
2026-05-31days on market $209,500 Active 44 DOM
-
2026-04-17$209,500 Active 732-char remark
Show marketing remark (732 chars)
THIS ALL BRICK 3 BEDROOM, 1 BATH HOME - is Move-In Ready for a 1st time buyer or Investor! Approx $40k in Updates in 2021 include: All new plank flooring was installed throughout. New cabinets in the kitchen, New water heater, New Refrigerator, Oven replaced with a used but in excellent condition Stove/oven, Wall mounted air conditioner installed in kitchen/dining area, New Ceiling Fans throughout, Baseboard heaters replaced, Thermostats replaced, All new electrical wall plugs throughout, Interior all painted, A couple of new lights installed, New bathroom cabinets, toilet, & tub. Crawl space cleaned & a sump pump installed as well as a vapor barrier on the ground and up the walls. This is a Must See for the price!
-
2006-01-12historical
-
2005-09-12$79,900
ⓘ Source: listings_history table (triggers on properties + properties_extension) + one-shot
backfill from property_details.listing_events for pre-trigger history.
Tax reassessment forecast KY · Resets to sale price
- Current annual tax
- $764 · $64/mo
- Projected year-2 tax
- $1,789 · $149/mo
- Expected delta
- +$1,024/yr (+$85/mo · 134.0%)
ⓘ Screening estimate from a state-policy table — verify with the county assessor before closing.
Climate risk First Street
- Flood 1/10 Low FEMA zone X (unshaded) · 0% chance over 30 yrs
- Wildfire 2/10 Low
- Heat 4/10 Moderate 7 d/yr ≥104°F today · 20 d/yr by 30 yrs out
- Wind 2/10 Low 3% chance of damaging wind over 30 yrs
- Air quality 2/10 Low 1 unhealthy d/yr today · 2 by 30 yrs out
Nearby sold comps map
Loading sold comps map…
Walkable amenities ~0.75 mi
Loading nearby amenities…
Taxation est. · year 1
- Rental income
- $19,462
- − Mortgage interest
- −$11,651
- − Property taxes
- −$764
- − Insurance
- −$1,040
- − Repairs & maintenance
- −$1,557
- − Management
- −$1,557
- − Depreciation
- −$6,051
- Taxable loss
- −$3,158
- Est. tax savings @ 24.0%
- +$758
- After-tax cash flow
- $1,240/yr
For passive investors: Depreciation is non-cash, so a rental often shows a tax loss while cash-flowing — sheltering income. Rental losses are passive: they offset passive income freely, and up to $25,000/yr can offset ordinary (W-2) income if you actively participate and your MAGI is under $100k (phasing out to $0 by $150k); unused losses carry forward. On sale, claimed depreciation is recaptured at up to 25%, and gains may owe capital-gains tax (a 1031 exchange can defer both). Figures are a year-1 estimate at your 24.0% rate — not tax advice; consult a CPA.
Schools (NCES district)
- District
- Shelby County
- NCES district ID
- 2105320
- Math proficiency
- 26% ▼ -10.00%
- Reading proficiency
- 37% ▼ -11.00%
- Median HH income
- $58,163
- Composite
- 28.19/100
- National rank
- #6809
- State rank
- #77 of 165 in KY
Livability — Shelbyville
- Score
- 75/100
- State rank
- #101
- US rank
- #4143
Category grades
Schools grade is shown separately in the Schools card above.
Census & demographics
- Census place
- Shelbyville, KY
- County
- Shelby County · 32,160 people
- City population
- 32,160
- Metro
- Louisville/Jefferson County, KY-IN
- Population (ZIP)
- 32,160
- Household income
- $77,869
- Rent vs Own
- Severe rent burden
- 655.0
Population outlook (Shelby County) Hauer SSP2
- Today (2025)
- 52,947 people
- By 2030
- 56,624 · +6.9%
- By 2040
- 63,983 · +20.8%
- By 2050
- 70,917 · +33.9%
- By 2075
- 87,345 · +65.0%
- By 2100
- 97,345 · +83.9%
Race, ethnicity, and origin ACS 2023
- Neighborhood character
- Predominantly White (74%)
- Race & ethnicity
- White 74% Hispanic / Latino 14% Two or more races 10% Black 6% Asian 1%
- Hispanic origin (detail)
- Mexican 7% Puerto Rican 1%
- Common ancestry
- Slovak 3% Serbian 2% Italian 2%
- Foreign-born
- 8% · Canada
- Languages at home
- 87% English-only · Spanish 11% Tagalog/Filipino 1% Other Asian/Pacific 1%
Political lean MEDSL · Shelby
- 2024 margin
- Solid R (+34.7) · D 31.8% · R 66.5% · Other 1.7%
- 2008→2024 swing
- -10.0pp toward R · 2008: -24.7pp · 2024: -34.7pp
- All cycles
- 2024: R+34.7 2020: R+29.6 2016: R+33.6 2012: R+27.6 2008: R+24.7
Not yet ingested
- Civics
- —
Market trends
- HPI YoY
- ▼ -144.73%
- Current HPI
- 177.2875
- Rent YoY
- —
- Metro
- Louisville/Jefferson County, KY-IN
- State GDP YoY
- ▲ 1.81%
- F500 in state
- 4
Industry mix (Fortune 500 HQ in KY)
| Industry | F500 HQs | Revenue |
|---|---|---|
| Healthcare | 1 | $118B |
|
||
| Food / Beverage | 1 | $7B |
|
||
Price history
+162.2% since first listed3 events — show timeline
- 2026-04-17 Listed $209,500 Metro Search MLS
- 2006-01-12 Listing Removed — Metro Search MLS
- 2005-09-12 Listed $79,900 Metro Search MLS
Property tax history
+0.9%/yrLatest (2025): $764 · -1.0% YoY. Source: county tax records.
Cash-flow waterfall
monthlySold comps — $/sqft
last 12 mo · ≤1 miLoading sold comps…