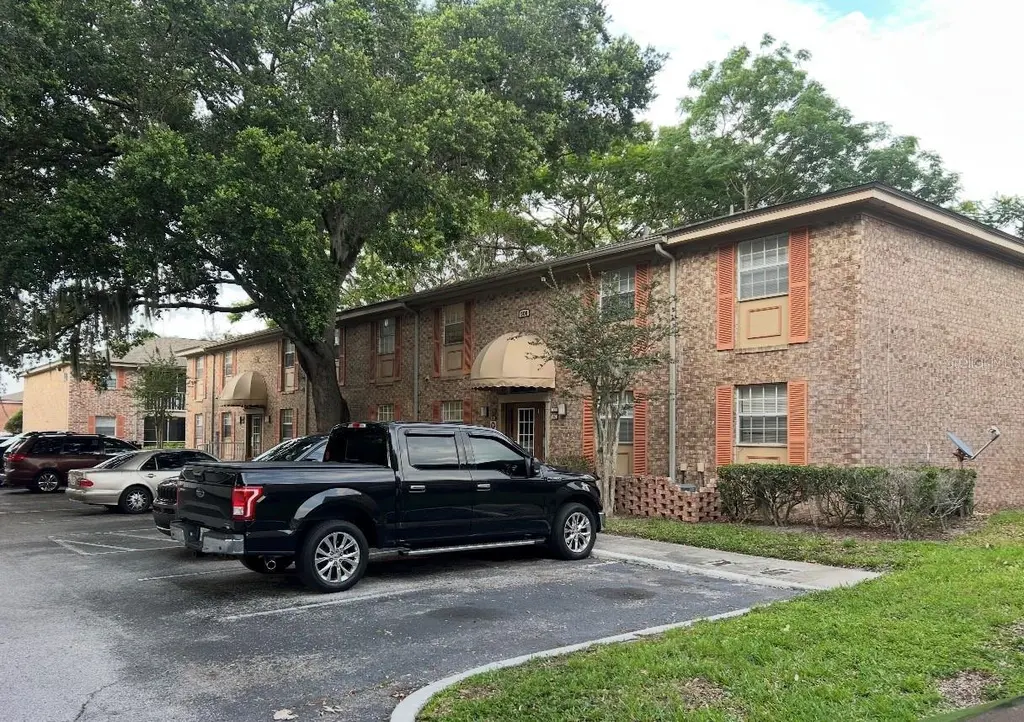
508 Banyon Tree Cir #202 · Casselberry, FL
Flood risk 1/10 · Minimal
- FEMA flood zone
- X (unshaded)
- Chance of flooding over 30 yrs
- 0.0%
- Est. flood insurance / yr
- $507 – $1,088
Fire risk 2/10 · Minimal
- Est. fire insurance / yr
- $947 – $1,759
Heat risk 9/10 · Severe
- Hot days now (above 107°F)
- 7 days/yr
- Hot days in 30 yrs
- 23 days/yr
Wind risk 9/10 · Severe
- Chance of severe wind over 30 yrs
- 99.0%
Air-quality risk 2/10 · Minimal
- Unhealthy air days now
- 0 days/yr
- Unhealthy air days in 30 yrs
- 1 days/yr
Risk factors via First Street. Map © Google.
Why this score? — see what drove the C grade
The composite is a weighted blend of 9 inputs, each scored 0–100. Each bar is that input's sub-score; the figure is the points it added to the 100-point composite (weight × sub-score).
- Cash flow +20.2/30.0
- 1% rule +10.0/10.0
- ARV discount +7.5/15.0
- DSCR +6.4/10.0
- Schools +5.1/10.0
- Livability +3.7/5.0
- Rent growth +3.0/5.0
- Condition / age +2.5/5.0
- Appreciation +0.0/10.0
$107,000
🖨 Deal sheet 📄 Offer letter ✓ Due diligence
Listing remarks
Beautiful condo located in the desirable Carrington Park community! This well-maintained unit offers a spacious layout, comfortable living spaces, and a great location close to shopping, restaurants, major highways, and UCF. Community amenities include multiple swimming pools, fitness center, playground, and more. Great opportunity for homeowners or investors alike!
Key facts
- Fitness center
- Playground
- $470 HOA
Tags
Property features AI
Finance
- Other: Unfurnished unit
- Financial info: Total monthly HOA fees approx. $470.13; total annual fees approx. $5,641.56; Lease restrictions apply
- HOA & community: HOA required; monthly association fee approximately $470.13; Association fee includes pest control, water and sewer; Association approval required; Community amenities include fitness center and pool; Pets allowed (cats and dogs) with limits
Exterior
- Utilities: Public water; Public sewer; Cable connected; High-speed internet available; Electricity connected; Water connected; Sewer connected
- Home design: Residential condominium; Second-floor unit (Unit 202 in Building 18); Unit faces west; One living level; 2 total stories in building
- Construction: Block, brick and concrete construction; Shingle roof; Slab/other foundation; Built on a 0.02-acre (approx.) lot
- Exterior features: Balcony; Asphalt road access
Interior
- Kitchen: Dishwasher; Range; Microwave; Refrigerator
- Bedrooms: 2 bedrooms
- Flooring: Ceramic tile
- Bathrooms: 2 full bathrooms
- Heating & cooling: Central heat; Central air
- Interior features: Ceiling fans; Living room / dining room combo; Five total rooms
- Laundry & utility: Washer; Dryer; Laundry located in kitchen
Neighborhood map
What this means for you Summary
Snapshot
- This is a 2-bed/2.0-bath condo listed at $107k.
Deal economics
- At list price, monthly cash flow is $134 ($2k/yr) — positive.
- The deal already cash-flows at list — no discount required.
- Meets the 1% rule at list price ($2k rent vs $107k).
- Cap rate 7.8% vs local median 4.1% in Casselberry — top-decile yield for the area; either an underpriced asset or a hidden risk that comps aren't pricing in. Stress-test before assuming the spread holds.
Location & tenants
- Location reads 73/100 on livability (#314 in FL) — a middle-class / working-renter tenant base. Strengths: cost of living A+, housing A+, health & safety A-; Watch: crime C-, employment C-, amenities F.
- Seminole (suburban): math 57% / reading 61% proficiency, ranked #13 of 73 in FL (top 18%) — acceptable for families but not a draw, mixed tenant base, ~2y average lease.
- Market conditions: Rents rising (+1.9%/yr); 197 active listings in the ZIP; 35 comparable units currently listed for rent nearby; rentals at typical pace (median 17d on market — plan ~3-4 weeks tenant-placement turnaround); solid renter incomes; 1,979 units permitted in Seminole County in 2024 (1,191 in 5+ unit buildings).
Forward outlook
- Local home prices are declining (-3.0%/yr); year-one equity from $740 of loan paydown is wiped out by about $3k of value loss. Plan a longer hold.
- Seminole County population projected at +24% by 2050 — long-run rental-demand tailwind backs the buy-and-hold thesis.
Negotiation context
- Only 1 days on market — expect competitive offers; lowballing is unlikely to land.
- 6 sale attempts since 18y ago with the ask held roughly flat each time — persistent listings suggest the price (not the market) is what's stuck; bring a comps-based counter.
- Current owner paid $53k; list at $107k implies a 102% gain — meaningful room to come down on a strong offer.
Risks & watch-outs
- Watch-outs: HOA is 27% of rent.
- Climate carrying-cost: severe wind risk, 99% chance of damaging wind over 30y; extreme-heat days projected 7→23/yr by 2055 (HVAC capex compounding) — expect insurance premiums to compound above CPI over the hold.
Questions for the listing agent
- Built in 1973 — when were the roof, HVAC, electrical panel, plumbing, and water heater last replaced?
- What does the HOA fee cover, when was the last increase, and are there any pending special assessments or reserve-fund shortfalls?
- Any open or pending special assessments — roof, HVAC, plumbing, elevator, façade? What's the per-unit balance and payoff schedule, and is the seller paying it off at close or rolling it to the buyer?
- Is there a deadline driving the sale (1031 exchange, divorce, estate, relocation)? That informs how much negotiation room exists.
- Schools are B-rated — typically a magnet for longer-tenancy family renters. What's the average tenant stay here, and is there a school-zone premium baked into asking?
- What's the average days-on-market for RENTAL listings here right now (not sales)? A rising rental-DOM trend means longer vacancies and softer asking-rent achievability than the comps imply.
- What's the recent tenant-quality profile in this submarket — average credit score on applications, eviction rate, late-payment / NSF rate, and stable-employment percentage? A property-management company in the area should have these aggregated.
- How much new apartment / multifamily construction is in the pipeline within 1–3 miles? Heavy new supply (>2% of stock underway) typically softens rents 12–24 months out; light construction supports rent growth.
Investment metrics
- 1% rule
- 1.66% ✓
- Cap rate
- 7.80%
- Cash-on-cash
- 5.39%
- DSCR
- 1.24
- GRM
- 5.0
CMA / ARV
No comps found within radius.
Projected returns pro-forma
-3.0% appreciation · 1.86% rent growth · sell at horizon
- IRR
- -9.7%
- Equity multiple
- 0.65×
- Total profit
- $-10,435
- Equity at exit
- $15,954
- IRR
- -2.5%
- Equity multiple
- 0.84×
- Total profit
- $-4,699
- Equity at exit
- $9,251
Cash invested: $29,960 (down + closing). Projections, not guarantees.
Landlord ↔ Tenant lean methodology
- Overall (STATE)
- 87 Strongly Landlord-Friendly
- State Florida
- 87 Strongly Landlord-Friendly · R+3
- County
- — inherits STATE
- City
- — inherits STATE
ZIP-level market 32751
- Rents YoY
- 1.9%
- Active inventory
- 197
- Price-to-rent
- 5.0×
Monthly cashflow live
- Estimated rent
- $1,773 high interval (Pro) →
- Mortgage (P&I)
- −$561
- Tax from tax record
- −$191 /mo · $2,287/yr
- Insurance
- −$45
- HOA
- −$470
- Vacancy / Maint / Mgmt
- −$372
- Net cashflow
- $134
Break-even live
UW: 25.0% down · 7.5% · 30yr · 1.5% tax · 5.0% vac · 8.0% maint · 8.0% mgmt
Financing live
Cash to close
- Down payment
- $26,750
- Closing costs
- $3,210
- Reserves months
- —
- Total cash needed
- —
Loan-product check · same deal, 3 products live
Conventional
25% down · 7.5% · 30yr
- Down + closing
- —
- Monthly P&I
- —
- Monthly cashflow
- —
- DSCR
- —
- Eligible?
- —
Personal DTI + credit; lowest rate.
DSCR
20% down · 8.5% · 30yr
- Down + closing
- —
- Monthly P&I
- —
- Monthly cashflow
- —
- DSCR
- —
- Eligible?
- —
No personal income docs; deal must DSCR.
Hard money
10% down · 12.0% · 12mo
- Down + closing
- —
- Monthly P&I
- —
- Monthly cashflow
- —
- DSCR
- —
- Eligible?
- —
Short-term bridge; refi at stabilization.
Rent comps 35 comps
| Address | Beds | Baths | Sqft | Rent | $/sqft | DOM | Units | Dist |
|---|---|---|---|---|---|---|---|---|
| 2075 Howell Branch Rd Unit 1UNIT 101 Maitland, FL | 2.0 | 1.0 | 875 | $1,450 | $1.66 | 3d | 1 | 0.03mi |
| 2075 Howell Branch Rd Unit 101 Maitland, FL | 2.0 | 1.0 | 875 | $1,450 | $1.66 | 4d | 1 | 0.03mi |
| 2458 Grand Teton Cir Unit 1 Winter Park, FL | 3.0 | 2.0 | 1457 | $2,250 | $1.54 | 24d | 1 | 0.19mi |
| 472 Banyon Tree Cir Maitland, FL | 1.0 | 1.0 | 759 | $1,150 | $1.52 | 20d | 1 | 0.20mi |
| 2890 Red Lion Sq Winter Park, FL | 1.0–2.0 | 1.0–2.0 | 765 | $1,819 | $2.38 | 2d | 12 | 0.21mi |
| 2500 Howell Branch Rd Winter Park, FL | 1.0–3.0 | 1.0–2.0 | 920 | $1,530 | $1.66 | 1d | 35 | 0.32mi |
| 1699 Semoran North Cir Winter Park, FL | 1.0–3.0 | 1.0–2.0 | 1064 | $1,844 | $1.73 | 5d | 21 | 0.60mi |
| 1166 Carmel Cir #100 Casselberry, FL | 3.0 | 2.0 | 1443 | $2,200 | $1.52 | 24d | 1 | 0.76mi |
| 2242 King Johns Ct Winter Park, FL | 3.0 | 2.0 | 1470 | $2,395 | $1.63 | 16d | 1 | 0.81mi |
| 2304 Inagua Way Unit 2304 Winter Park, FL | 2.0 | 1.0 | 854 | $1,750 | $2.05 | 5d | 1 | 0.82mi |
| 2304 Inagua Way Winter Park, FL | 2.0 | 1.0 | 854 | $1,750 | $2.05 | 15d | 1 | 0.82mi |
| 1167 Calle del Rey Unit A Casselberry, FL | 1.0 | 1.0 | 781 | $1,250 | $1.60 | 24d | 1 | 0.90mi |
| 3254 Howell Branch Rd Winter Park, FL | 2.0 | 2.0 | 964 | $1,749 | $1.81 | 24d | 1 | 0.91mi |
| 3254 Howell Branch Rd Winter Park, FL | 2.0 | 2.0 | 964 | $1,600 | $1.66 | 5d | 1 | 0.91mi |
| 1177 Paseo del Mar Unit C Casselberry, FL | 2.0 | 2.0 | 1040 | $1,950 | $1.88 | 17d | 1 | 0.92mi |
| 1157 Calle del Norte Unit B Casselberry, FL | 1.0 | 1.0 | 751 | $1,175 | $1.56 | 5d | 1 | 0.93mi |
| 1160 Calle del Norte Unit C Casselberry, FL | 2.0 | 2.0 | 1040 | $1,650 | $1.59 | 24d | 1 | 0.93mi |
| 2015 New Stonecastle Ter Winter Park, FL | 1.0–3.0 | 1.0–2.0 | 1045 | $1,630 | $1.56 | 2d | 19 | 0.93mi |
| 2523 Alexa Ct Winter Park, FL | 2.0 | 1.5 | 825 | $1,600 | $1.94 | 24d | 1 | 0.97mi |
| 1540 Oneco Ave Winter Park, FL | 3.0 | 2.0 | 1441 | $2,500 | $1.73 | 3d | 1 | 0.99mi |
| 303 Sandlewood Trl #2 Winter Park, FL | 2.0 | 2.5 | 960 | $1,825 | $1.90 | 24d | 1 | 1.00mi |
| 3059 Autumn Ct Winter Park, FL | 3.0 | 2.0 | 1266 | $1,900 | $1.50 | 17d | 1 | 1.00mi |
| 2700 Tortoise Cv Winter Park, FL | 3.0 | 2.0 | 1083 | $2,095 | $1.93 | 3d | 1 | 1.07mi |
| 1166 Pointe Newport Ter Casselberry, FL | 1.0–3.0 | 1.0–2.0 | 961 | $1,768 | $1.84 | 5d | 16 | 1.07mi |
| 1803 Pineview Cir Winter Park, FL | 2.0 | 1.0 | 1029 | $1,975 | $1.92 | 24d | 1 | 1.13mi |
| 2617 Eastbrook Blvd Winter Park, FL | 1.0–2.0 | 1.0 | 875 | $1,300 | $1.49 | 24d | 2 | 1.16mi |
| 117 Georgetown Dr Unit C Casselberry, FL | 2.0 | 2.0 | 1095 | $1,550 | $1.42 | 24d | 1 | 1.18mi |
| 2610 Eastbrook Blvd Unit 216 Winter Park, FL | 2.0 | 1.0 | 850 | $1,300 | $1.53 | 24d | 1 | 1.19mi |
| 602 Desoto Dr Casselberry, FL | 3.0 | 2.0 | 1405 | $2,500 | $1.78 | 5d | 1 | 1.22mi |
| 3449 Allston Ln Winter Park, FL | 3.0 | 2.5 | 1482 | $2,350 | $1.59 | 22d | 1 | 1.30mi |
| 202 Esplanade Way Unit Esplanade Way-202 Casselberry, FL | 1.0 | 1.0 | 722 | $1,200 | $1.66 | 24d | 1 | 1.36mi |
| 800 Semoran Park Dr Winter Park, FL | 1.0–2.0 | 1.0–2.0 | 880 | $1,667 | $1.89 | 2d | 6 | 1.42mi |
| 3250 Bishop Park Dr Winter Park, FL | 1.0–2.0 | 1.0–2.0 | 880 | $2,117 | $2.41 | 2d | 17 | 1.48mi |
| 1124 Shoreview Cir Casselberry, FL | 1.0–3.0 | 1.0–2.0 | 1068 | $2,280 | $2.13 | 2d | 23 | 1.49mi |
| 1671 Dale Ave Winter Park, FL | 2.0 | 1.0 | 1131 | $2,250 | $1.99 | 18d | 1 | 1.50mi |
HOA detail condo
- Monthly dues
- $470 · $5,640/yr
- Likely covers
- poolgym
- Assessments
- None detected in remarks — confirm with the listing agent.
Listing history 13 events
-
2026-05-14status Pending
-
2026-05-13$107,000 Active
-
2026-01-30status Active
-
2026-01-30historical
-
2026-01-22status Pending
-
2026-01-15$125,000 Active
-
2026-01-08historical
-
2025-12-29$185,000 Active
-
2025-09-22price $185,000
-
2009-01-07historical
-
2008-12-22$75,000
-
2008-11-07soldstatus $53,000
-
2008-10-03$54,900
ⓘ Source: listings_history table (triggers on properties + properties_extension) + one-shot
backfill from property_details.listing_events for pre-trigger history.
Tax reassessment forecast FL · Resets to sale price
- Current annual tax
- $2,287 · $191/mo
- Projected year-2 tax
- $2,287 · $191/mo
- Expected delta
- $0/yr ($0/mo · 0.0%)
ⓘ Screening estimate from a state-policy table — verify with the county assessor before closing.
Climate risk First Street
- Flood 1/10 Low FEMA zone X (unshaded) · 0% chance over 30 yrs
- Wildfire 2/10 Low
- Heat 9/10 Extreme 7 d/yr ≥107°F today · 23 d/yr by 30 yrs out
- Wind 9/10 Extreme 99% chance of damaging wind over 30 yrs
- Air quality 2/10 Low 0 unhealthy d/yr today · 1 by 30 yrs out
Nearby sold comps map
Loading sold comps map…
Walkable amenities ~0.75 mi
Loading nearby amenities…
Taxation est. · year 1
- Rental income
- $21,278
- − Mortgage interest
- −$5,994
- − Property taxes
- −$2,287
- − Insurance
- −$535
- − Repairs & maintenance
- −$1,702
- − Management
- −$1,702
- − HOA
- −$5,640
- − Depreciation
- −$3,113
- Taxable income
- $305
- Est. tax owed @ 24.0%
- −$73
- After-tax cash flow
- $1,541/yr
For passive investors: Depreciation is non-cash, so a rental often shows a tax loss while cash-flowing — sheltering income. Rental losses are passive: they offset passive income freely, and up to $25,000/yr can offset ordinary (W-2) income if you actively participate and your MAGI is under $100k (phasing out to $0 by $150k); unused losses carry forward. On sale, claimed depreciation is recaptured at up to 25%, and gains may owe capital-gains tax (a 1031 exchange can defer both). Figures are a year-1 estimate at your 24.0% rate — not tax advice; consult a CPA.
Schools (NCES district)
- District
- Seminole
- NCES district ID
- 1201710
- Math proficiency
- 57% ▼ -7.00%
- Reading proficiency
- 61% ▼ -1.00%
- Median HH income
- $58,478
- Composite
- 51.05/100
- National rank
- #1769
- State rank
- #13 of 73 in FL
Livability — Casselberry
- Score
- 73/100
- State rank
- #314
- US rank
- #5320
Category grades
Schools grade is shown separately in the Schools card above.
Census & demographics
- Census place
- Casselberry, FL
- County
- Orange County · 1,471,359 people
- City population
- 45,584
- Metro
- Orlando-Kissimmee-Sanford, FL
- Population (ZIP)
- 22,103
- Household income
- $95,387
- Rent vs Own
- Severe rent burden
- 950.0
Population outlook (Seminole County) Hauer SSP2
- Today (2025)
- 515,494 people
- By 2030
- 545,713 · +5.9%
- By 2040
- 598,068 · +16.0%
- By 2050
- 640,663 · +24.3%
- By 2075
- 724,461 · +40.5%
- By 2100
- 755,530 · +46.6%
Race, ethnicity, and origin ACS 2023
- Neighborhood character
- Majority White (64%)
- Race & ethnicity
- White 64% Hispanic / Latino 15% Black 13% Two or more races 11% Asian 3%
- Hispanic origin (detail)
- Mexican 1% Puerto Rican 6% Cuban 1% Dominican 1%
- Common ancestry
- Italian 3% Slovak 2% Lithuanian 2%
- Foreign-born
- 9% · Canada, China, Jamaica
- Languages at home
- 83% English-only · Spanish 12% Other Indo-European 2% Chinese 1%
Political lean MEDSL · Seminole
- 2024 margin
- Toss-up / Even · D 47.6% · R 51.1% · Other 1.3%
- 2008→2024 swing
- -0.8pp no change · 2008: -2.8pp · 2024: -3.5pp
- All cycles
- 2024: R+3.5 2020: D+2.8 2016: R+1.6 2012: R+6.5 2008: R+2.8
Not yet ingested
- Civics
- —
Market trends
- HPI YoY
- ▼ -342.25%
- Current HPI
- 316.2808
- Rent YoY
- ▲ 1.86%
- Metro
- Orlando-Kissimmee-Sanford, FL
- State GDP YoY
- ▲ 3.28%
- F500 in state
- 36
Industry mix (Fortune 500 HQ in FL)
| Industry | F500 HQs | Revenue |
|---|---|---|
| Industrial Technology | 2 | $29B |
|
||
| Insurance | 2 | $17B |
|
||
| Retail | 1 | $60B |
|
||
| Technology Distribution | 1 | $58B |
|
||
| Homebuilding | 1 | $35B |
|
||
| Technology Manufacturing | 1 | $35B |
|
||
Price history
+94.9% since first listed13 events — show timeline
- 2026-05-14 Pending — Stellar MLS as Distributed by MLS Grid
- 2026-05-13 Listed $107,000 Stellar MLS as Distributed by MLS Grid
- 2026-01-30 Relisted — Stellar MLS as Distributed by MLS Grid
- 2026-01-30 Listing Removed — Stellar MLS as Distributed by MLS Grid
- 2026-01-22 Pending — Stellar MLS as Distributed by MLS Grid
- 2026-01-15 Listed $125,000 Stellar MLS as Distributed by MLS Grid
- 2026-01-08 Listing Removed — Stellar MLS as Distributed by MLS Grid
- 2025-12-29 Listed $185,000 Stellar MLS as Distributed by MLS Grid
- 2025-09-22 Price Changed $185,000 Stellar MLS as Distributed by MLS Grid
- 2009-01-07 Listing Removed — Stellar MLS as Distributed by MLS Grid
- 2008-12-22 Listed $75,000 Stellar MLS as Distributed by MLS Grid
- 2008-11-07 Sold (MLS) $53,000 Stellar MLS as Distributed by MLS Grid
- 2008-10-03 Listed $54,900 Stellar MLS as Distributed by MLS Grid
Property tax history
+9.8%/yrLatest (2025): $2,287 · -0.4% YoY. Source: county tax records.
Cash-flow waterfall
monthlySold comps — $/sqft
last 12 mo · ≤1 miLoading sold comps…