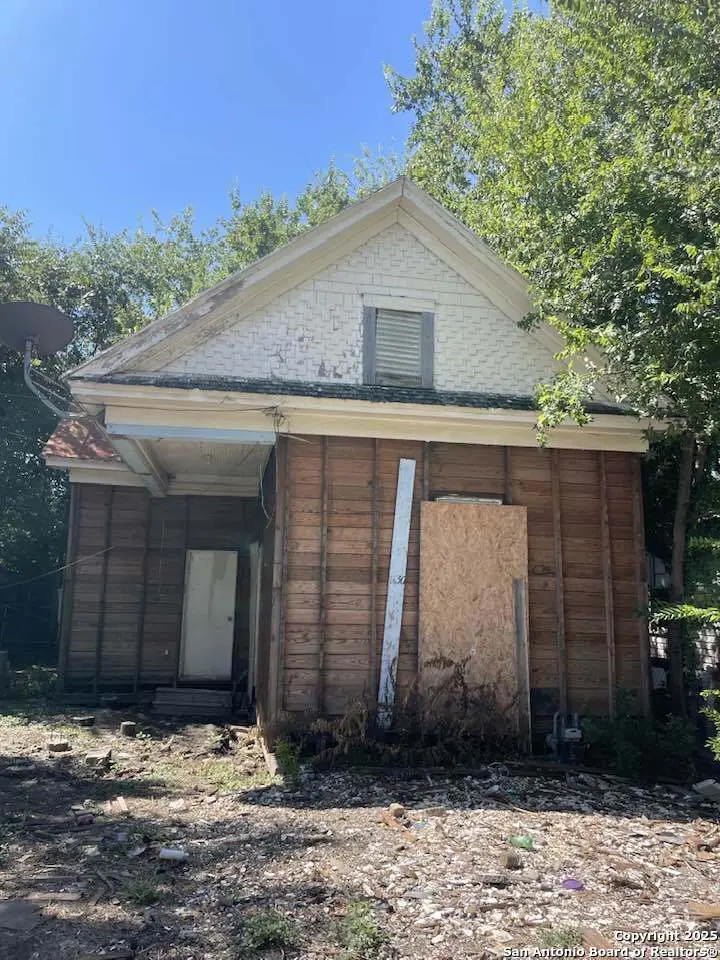
1130 Delaware · San Antonio, TX
Flood risk 4/10 · Minor
- FEMA flood zone
- X (unshaded)
- Chance of flooding over 30 yrs
- 0.22%
- Est. flood insurance / yr
- $507 – $1,088
Fire risk 1/10 · Minimal
- Est. fire insurance / yr
- $1,222 – $2,270
Heat risk 8/10 · Major
- Hot days now (above 108°F)
- 7 days/yr
- Hot days in 30 yrs
- 22 days/yr
Wind risk 8/10 · Major
- Chance of severe wind over 30 yrs
- 80.0%
Air-quality risk 2/10 · Minimal
- Unhealthy air days now
- 1 days/yr
- Unhealthy air days in 30 yrs
- 2 days/yr
Risk factors via First Street. Map © Google.
Why this score? — see what drove the B- grade
The composite is a weighted blend of 9 inputs, each scored 0–100. Each bar is that input's sub-score; the figure is the points it added to the 100-point composite (weight × sub-score).
- Cash flow +30.0/30.0
- 1% rule +10.0/10.0
- DSCR +10.0/10.0
- ARV discount +7.5/15.0
- Livability +4.0/5.0
- Rent growth +2.8/5.0
- Condition / age +2.5/5.0
- Schools +1.4/10.0
- Appreciation +0.0/10.0
$59,900
🖨 Deal sheet 📄 Offer letter ✓ Due diligence
Listing remarks MLS
Investor-grade home just a few miles from downtown. Will need a severe amount of repairs. Cash only sale. Not in habitable or lendable condition. Sold as-is, Seller will not perform, contribute to, or allow Buyer to perform repairs prior to closing. Proof of funds and copy of EM check required with all offers. Seller's addendum to be completed upon negotiated offer.
Key facts
- 2,482 sq ft lot
- Built 1908
- Listed 281 days
Neighborhood map
What this means for you Summary
Snapshot
- This is a 2-bed/1.0-bath single-family listed at $60k.
Deal economics
- At list price, monthly cash flow is $347 ($4k/yr) — positive.
- The deal already cash-flows at list — no discount required.
- Meets the 1% rule at list price ($1k rent vs $60k).
- Recommended offer: $53k (12.0% below list) — sets the bar for market timing.
- Cap rate 13.2% vs local median 3.8% in San Antonio — top-decile yield for the area; either an underpriced asset or a hidden risk that comps aren't pricing in. Stress-test before assuming the spread holds.
Location & tenants
- Location reads 80/100 on livability (#31 in TX, #1,616 nationally) — a professional / high-income tenant draw. Strengths: amenities A+, commute A+, cost of living A+; Watch: schools C-, crime F.
- San Antonio ISD (urban): math 12% / reading 22% proficiency, ranked #805 of 826 in TX (top 98%) — low school quality limits family demand, transient renter base, plan for 1-2y turnover; 80% free/reduced lunch — lower-income household profile, screen leases tightly.
- Market conditions: Rents rising (+1.1%/yr); 269 active listings in the ZIP; 40 comparable units currently listed for rent nearby; rentals at typical pace (median 24d on market — plan ~3-4 weeks tenant-placement turnaround); 8,308 units permitted in Bexar County in 2024 (2,506 in 5+ unit buildings).
Forward outlook
- Local home prices are declining (-3.0%/yr); year-one equity from $414 of loan paydown is wiped out by about $2k of value loss. Plan a longer hold.
- Bexar County population projected at +50% by 2050 — long-run rental-demand tailwind backs the buy-and-hold thesis.
- At projected returns (-3.0% appreciation + 1.1% rent growth), your $17k cash investment doubles in ~6 years — after that, you're playing with house money.
Negotiation context
- It's been on market 281 days — a 12% lower offer ($53k) is reasonable based on typical stale-listing flexibility.
- 4 sale attempts since 2y ago; this cycle's ask has dropped $20k (25%) from the opening price — seller is motivated, your offer sets the floor, not the list.
Risks & watch-outs
- Watch-outs: property tax is 3.4% of price; built in 1908 — expect roof / HVAC / electrical / plumbing capex.
- Climate carrying-cost: severe wind risk, 80% chance of damaging wind over 30y; extreme-heat days projected 7→22/yr by 2055 (HVAC capex compounding) — expect insurance premiums to compound above CPI over the hold.
Questions for the listing agent
- It's been on market 281 days. Have you received any prior offers? Is the seller open to a 12% concession, seller financing, or rate buy-down credit?
- Built in 1908 — when were the roof, HVAC, electrical panel, plumbing, and water heater last replaced?
- Property tax is high relative to price — has the assessment been appealed recently, and will the sale trigger a re-assessment?
- Why hasn't it sold? Are there any deal-killer items the seller is aware of (foundation, flood, title, zoning, code violations)?
- Is there a deadline driving the sale (1031 exchange, divorce, estate, relocation)? That informs how much negotiation room exists.
- Crime grade is F in this area — have there been break-ins, vandalism, or insurance claims at this property in the last 3 years? What carrier currently insures it and at what premium?
- What's the average days-on-market for RENTAL listings here right now (not sales)? A rising rental-DOM trend means longer vacancies and softer asking-rent achievability than the comps imply.
- What's the recent tenant-quality profile in this submarket — average credit score on applications, eviction rate, late-payment / NSF rate, and stable-employment percentage? A property-management company in the area should have these aggregated.
- How much new for-sale + rental construction is in the pipeline within 1–3 miles? Heavy new supply typically softens prices + rents 12–24 months out; constrained supply supports both.
Investment metrics
- 1% rule
- 1.81% ✓
- Cap rate
- 13.25%
- Cash-on-cash
- 24.84%
- DSCR
- 2.11
- GRM
- 4.6
CMA / ARV
- ARV (median comp)
- $138,799
- List price
- $59,900
- Delta
- -56.84%
- Verdict
- UNDERPRICED
- Comps
- 20 within 1.0 mi
Show comp detail 4 sales within ~0.75 mi
| Address | Dist | Beds/Ba | Sqft | Sold | Price | $/sf | Match |
|---|---|---|---|---|---|---|---|
| 228 Spruce | 0.42mi | 2/1.0 | 708 (+7%) | 9mo | $149,000 | $210 | 61 |
| 620 S Mesquite St | 0.53mi | 2/1.0 | 696 (+6%) | 18mo | $239,000 | $343 | 51 |
| 339 Cooper St | 0.71mi | 2/1.0 | 665 (+1%) | 20mo | $130,000 | $195 | 49 |
| 1510 S Olive | 0.40mi | 2/2.0 | 748 (+14%) | 13mo | $150,000 | $201 | 44 |
Match score weights: distance 35% · size 25% · config 20% · recency 20%. Top-matched comps best support the ARV.
Projected returns pro-forma
-3.0% appreciation · 1.07% rent growth · sell at horizon
- IRR
- 15.9%
- Equity multiple
- 1.62×
- Total profit
- $10,415
- Equity at exit
- $8,931
- IRR
- 22.9%
- Equity multiple
- 2.77×
- Total profit
- $29,685
- Equity at exit
- $5,179
Cash invested: $16,772 (down + closing). Projections, not guarantees.
Landlord ↔ Tenant lean methodology
- Overall (STATE)
- 87 Strongly Landlord-Friendly
- State Texas
- 87 Strongly Landlord-Friendly · R+5
- County
- — inherits STATE
- City
- — inherits STATE
ZIP-level market 78210
- Rents YoY
- 1.1%
- Active inventory
- 269
- Price-to-rent
- 4.6×
Monthly cashflow live
- Estimated rent
- $1,086 high interval (Pro) →
- Mortgage (P&I)
- −$314
- Tax from tax record
- −$172 /mo · $2,064/yr
- Insurance
- −$25
- HOA
- −$0
- Vacancy / Maint / Mgmt
- −$228
- Net cashflow
- $347
Break-even live
UW: 25.0% down · 7.5% · 30yr · 1.5% tax · 5.0% vac · 8.0% maint · 8.0% mgmt
Financing live
Cash to close
- Down payment
- $14,975
- Closing costs
- $1,797
- Reserves months
- —
- Total cash needed
- —
Loan-product check · same deal, 3 products live
Conventional
25% down · 7.5% · 30yr
- Down + closing
- —
- Monthly P&I
- —
- Monthly cashflow
- —
- DSCR
- —
- Eligible?
- —
Personal DTI + credit; lowest rate.
DSCR
20% down · 8.5% · 30yr
- Down + closing
- —
- Monthly P&I
- —
- Monthly cashflow
- —
- DSCR
- —
- Eligible?
- —
No personal income docs; deal must DSCR.
Hard money
10% down · 12.0% · 12mo
- Down + closing
- —
- Monthly P&I
- —
- Monthly cashflow
- —
- DSCR
- —
- Eligible?
- —
Short-term bridge; refi at stabilization.
Rent comps 40 comps
| Address | Beds | Baths | Sqft | Rent | $/sqft | DOM | Units | Dist |
|---|---|---|---|---|---|---|---|---|
| 710 Virginia Blvd San Antonio, TX | 2.0 | 1.0 | 700 | $1,100 | $1.57 | 44d | 1 | 0.23mi |
| 121 Douglas Way St San Antonio, TX | 1.0 | 1.0 | 400 | $825 | $2.06 | 44d | 1 | 0.27mi |
| 707 S Olive St Unit A San Antonio, TX | 2.0 | 2.0 | 740 | $1,300 | $1.76 | 24d | 1 | 0.31mi |
| 726 Denver Blvd Unit 3 San Antonio, TX | 1.0 | 1.0 | 525 | $865 | $1.65 | 44d | 1 | 0.37mi |
| 1716 S Olive St Unit 3 San Antonio, TX | 1.0 | 1.0 | 590 | $775 | $1.31 | 44d | 1 | 0.58mi |
| 1218 Wyoming St Unit 1 San Antonio, TX | 1.0 | 1.0 | 744 | $1,299 | $1.75 | 44d | 1 | 0.60mi |
| 413 Nopal St Unit 102 San Antonio, TX | 2.0 | 1.0 | 743 | $1,450 | $1.95 | 2d | 1 | 0.62mi |
| 616 Porter St Unit 618-p San Antonio, TX | 1.0 | 1.0 | 680 | $895 | $1.32 | 4d | 1 | 0.67mi |
| 325 S Hackberry St San Antonio, TX | 2.0 | 1.0 | 621 | $1,200 | $1.93 | 12d | 1 | 0.71mi |
| 647 Hammond Ave Unit 101 San Antonio, TX | 2.0 | 1.0 | 660 | $1,040 | $1.58 | 24d | 1 | 0.73mi |
| 647 Hammond Ave San Antonio, TX | 2.0 | 1.0 | 660 | $1,040 | $1.58 | 18d | 1 | 0.73mi |
| 601 E Highland Blvd Unit B San Antonio, TX | 1.0 | 1.0 | 425 | $950 | $2.24 | 24d | 1 | 0.80mi |
| 601 E Highland Blvd Unit B San Antonio, TX | 1.0 | 1.0 | 425 | $950 | $2.24 | 44d | 1 | 0.80mi |
| 538 Kayton Ave San Antonio, TX | 1.0 | 1.0 | 735 | $925 | $1.26 | 16d | 1 | 0.81mi |
| 538 Kayton Ave Unit 540 San Antonio, TX | 1.0 | 1.0 | 731 | $925 | $1.27 | 18d | 1 | 0.81mi |
| 540 Kayton Ave Unit 540 San Antonio, TX | 1.0 | 1.0 | 730 | $925 | $1.27 | 18d | 1 | 0.81mi |
| 540 Kayton Ave San Antonio, TX | 1.0 | 1.0 | 730 | $950 | $1.30 | 18d | 1 | 0.81mi |
| 113 S Olive St San Antonio, TX | 1.0 | 1.0 | 444 | $695 | $1.57 | 24d | 1 | 0.81mi |
| 111 S Olive St San Antonio, TX | 1.0 | 1.0 | 481 | $749 | $1.56 | 44d | 1 | 0.82mi |
| 111 S Olive St Unit A San Antonio, TX | 1.0 | 1.0 | 481 | $730 | $1.52 | 44d | 1 | 0.82mi |
| 1121 Essex St Apt 3 San Antonio, TX | 1.0 | 1.0 | 432 | $895 | $2.07 | 44d | 1 | 0.84mi |
| 1121 Essex St Apt 3 San Antonio, TX | 1.0 | 1.0 | 432 | $870 | $2.01 | 20d | 1 | 0.84mi |
| 401 Santos St San Antonio, TX | 1.0–2.0 | 1.0–2.0 | 927 | $1,478 | $1.59 | 4d | 12 | 0.90mi |
| 142 Avant Ave Unit 3 San Antonio, TX | 1.0 | 1.0 | 700 | $950 | $1.36 | 44d | 1 | 0.91mi |
| 407 Santos St San Antonio, TX | 1.0 | 1.0 | 684 | $998 | $1.46 | 44d | 1 | 0.91mi |
| 506 W Drexel Ave Unit 1 San Antonio, TX | 1.0 | 1.0 | 740 | $795 | $1.07 | 24d | 1 | 0.91mi |
| 506 W Drexel Ave San Antonio, TX | 2.0 | 1.0 | 740 | $750 | $1.01 | 24d | 1 | 0.91mi |
| 506 W Drexel Ave San Antonio, TX | 1.0 | 1.0 | 740 | $795 | $1.07 | 22d | 1 | 0.91mi |
| 300 Labor St San Antonio, TX | 1.0–2.0 | 1.0–2.0 | 829 | $1,390 | $1.68 | 2d | 15 | 0.91mi |
| 526 Cooper St Unit B San Antonio, TX | 1.0 | 1.0 | 600 | $895 | $1.49 | 44d | 1 | 0.94mi |
| 843 Rigsby Ave Unit 2 San Antonio, TX | 1.0 | 1.0 | 600 | $1,100 | $1.83 | 24d | 1 | 0.96mi |
| 114 Jacobs St Unit 201 San Antonio, TX | 1.0 | 1.0 | 700 | $1,350 | $1.93 | 4d | 1 | 0.97mi |
| 318 Ferguson Ave Unit 2 San Antonio, TX | 1.0 | 1.0 | 420 | $700 | $1.67 | 22d | 1 | 1.01mi |
| 110 Labor St Unit 610 San Antonio, TX | 1.0 | 1.0 | 621 | $1,281 | $2.06 | 3d | 1 | 1.01mi |
| 203 Devine St Unit 2 San Antonio, TX | 1.0 | 1.0 | 613 | $975 | $1.59 | 24d | 1 | 1.06mi |
| 203 Devine St Unit 1 San Antonio, TX | 2.0 | 1.0 | 665 | $1,250 | $1.88 | 24d | 1 | 1.06mi |
| 2023 Beaver Ln San Antonio, TX | 1.0 | 1.0 | 600 | $960 | $1.60 | 44d | 1 | 1.07mi |
| 1326 S Saint Mary's St Apt 6 San Antonio, TX | 1.0 | 1.0 | 720 | $998 | $1.39 | 22d | 1 | 1.07mi |
| 622 Potomac St San Antonio, TX | 1.0 | 1.0 | 700 | $975 | $1.39 | 44d | 1 | 1.08mi |
| 1506 Schley Ave San Antonio, TX | 1.0 | 1.0 | 725 | $850 | $1.17 | 44d | 1 | 1.12mi |
Listing history 22 events
-
2026-06-15statusdays on market $59,900 Pending 281 DOM
-
2026-06-13days on market $59,900 Active 280 DOM
-
2026-06-09days on market $59,900 Active 276 DOM
-
2026-06-08days on market $59,900 Active 275 DOM
-
2026-06-07days on market $59,900 Active 274 DOM
-
2026-06-04days on market $59,900 Active 271 DOM
-
2026-06-03days on market $59,900 Active 270 DOM
-
2026-06-02days on market $59,900 Active 269 DOM
-
2026-06-01days on market $59,900 Active 268 DOM
-
2026-05-31days on market $59,900 Active 267 DOM
-
2026-03-20status Back on Market 368-char remark
Show marketing remark (368 chars)
Investor-grade home just a few miles from downtown. Will need a severe amount of repairs. Cash only sale. Not in habitable or lendable condition. Sold as-is, Seller will not perform, contribute to, or allow Buyer to perform repairs prior to closing. Proof of funds and copy of EM check required with all offers. Seller's addendum to be completed upon negotiated offer.
-
2026-02-25historical Active Option 368-char remark
Show marketing remark (368 chars)
Investor-grade home just a few miles from downtown. Will need a severe amount of repairs. Cash only sale. Not in habitable or lendable condition. Sold as-is, Seller will not perform, contribute to, or allow Buyer to perform repairs prior to closing. Proof of funds and copy of EM check required with all offers. Seller's addendum to be completed upon negotiated offer.
-
2026-01-07price $59,900 368-char remark
Show marketing remark (368 chars)
Investor-grade home just a few miles from downtown. Will need a severe amount of repairs. Cash only sale. Not in habitable or lendable condition. Sold as-is, Seller will not perform, contribute to, or allow Buyer to perform repairs prior to closing. Proof of funds and copy of EM check required with all offers. Seller's addendum to be completed upon negotiated offer.
-
2025-12-18price $75,000 368-char remark
Show marketing remark (368 chars)
Investor-grade home just a few miles from downtown. Will need a severe amount of repairs. Cash only sale. Not in habitable or lendable condition. Sold as-is, Seller will not perform, contribute to, or allow Buyer to perform repairs prior to closing. Proof of funds and copy of EM check required with all offers. Seller's addendum to be completed upon negotiated offer.
-
2025-09-06$80,000 New 368-char remark
Show marketing remark (368 chars)
Investor-grade home just a few miles from downtown. Will need a severe amount of repairs. Cash only sale. Not in habitable or lendable condition. Sold as-is, Seller will not perform, contribute to, or allow Buyer to perform repairs prior to closing. Proof of funds and copy of EM check required with all offers. Seller's addendum to be completed upon negotiated offer.
-
2025-09-03historical
-
2025-05-01price $85,000
-
2025-04-19$236,000 New
-
2024-04-23soldstatus Sold
-
2024-04-20status Pending
-
2024-02-22$120,000 New
-
2018-10-22soldstatus
ⓘ Source: listings_history table (triggers on properties + properties_extension) + one-shot
backfill from property_details.listing_events for pre-trigger history.
Tax reassessment forecast TX · Resets to sale price
- Current annual tax
- $2,064 · $172/mo
- Projected year-2 tax
- $2,064 · $172/mo
- Expected delta
- $0/yr ($0/mo · 0.0%)
ⓘ Screening estimate from a state-policy table — verify with the county assessor before closing.
Climate risk First Street
- Flood 4/10 Moderate FEMA zone X (unshaded) · 22% chance over 30 yrs
- Wildfire 1/10 Low
- Heat 8/10 Severe 7 d/yr ≥108°F today · 22 d/yr by 30 yrs out
- Wind 8/10 Severe 80% chance of damaging wind over 30 yrs
- Air quality 2/10 Low 1 unhealthy d/yr today · 2 by 30 yrs out
Nearby sold comps map
Loading sold comps map…
Walkable amenities ~0.75 mi
Loading nearby amenities…
Taxation est. · year 1
- Rental income
- $13,038
- − Mortgage interest
- −$3,355
- − Property taxes
- −$2,064
- − Insurance
- −$300
- − Repairs & maintenance
- −$1,043
- − Management
- −$1,043
- − Depreciation
- −$1,743
- Taxable income
- $3,490
- Est. tax owed @ 24.0%
- −$838
- After-tax cash flow
- $3,329/yr
For passive investors: Depreciation is non-cash, so a rental often shows a tax loss while cash-flowing — sheltering income. Rental losses are passive: they offset passive income freely, and up to $25,000/yr can offset ordinary (W-2) income if you actively participate and your MAGI is under $100k (phasing out to $0 by $150k); unused losses carry forward. On sale, claimed depreciation is recaptured at up to 25%, and gains may owe capital-gains tax (a 1031 exchange can defer both). Figures are a year-1 estimate at your 24.0% rate — not tax advice; consult a CPA.
Schools (NCES district)
- District
- San Antonio ISD
- NCES district ID
- 4838730
- Math proficiency
- 12% ▼ -21.00%
- Reading proficiency
- 22% ▼ -7.00%
- Median HH income
- $30,952
- Composite
- 13.57/100
- National rank
- #9512
- State rank
- #805 of 826 in TX
Livability — San Antonio
- Score
- 80/100
- State rank
- #31
- US rank
- #1616
Category grades
Schools grade is shown separately in the Schools card above.
Census & demographics
- Census place
- San Antonio, TX
- County
- Bexar County · 1,990,555 people
- City population
- 1,806,925
- Metro
- San Antonio-New Braunfels, TX
- Population (ZIP)
- 34,940
- Household income
- $55,028
- Rent vs Own
- Severe rent burden
- 1708.0
Population outlook (Bexar County) Hauer SSP2
- Today (2025)
- 2,336,851 people
- By 2030
- 2,560,728 · +9.6%
- By 2040
- 3,020,569 · +29.3%
- By 2050
- 3,493,522 · +49.5%
- By 2075
- 4,668,459 · +99.8%
- By 2100
- 5,533,242 · +136.8%
Race, ethnicity, and origin ACS 2023
- Neighborhood character
- Predominantly Hispanic (83%)
- Race & ethnicity
- Hispanic / Latino 83% Two or more races 29% White 11% Black 4% Native American 2%
- Hispanic origin (detail)
- Mexican 72% Puerto Rican 2%
- Common ancestry
- Lithuanian 1%
- Foreign-born
- 12% · Canada
- Languages at home
- 55% English-only · Spanish 44%
Political lean MEDSL · Bexar
- 2024 margin
- Lean D (+9.8) · D 54.3% · R 44.6% · Other 1.1%
- 2008→2024 swing
- +4.2pp toward D · 2008: 5.6pp · 2024: 9.8pp
- All cycles
- 2024: D+9.8 2020: D+18.2 2016: D+13.5 2012: D+4.6 2008: D+5.6
Not yet ingested
- Civics
- —
Market trends
- HPI YoY
- ▼ -163.42%
- Current HPI
- 286.299
- Rent YoY
- ▲ 1.07%
- Metro
- San Antonio-New Braunfels, TX
- State GDP YoY
- ▲ 3.95%
- F500 in state
- 110
Industry mix (Fortune 500 HQ in TX)
| Industry | F500 HQs | Revenue |
|---|---|---|
| Energy | 16 | $1,198B |
|
||
| Technology | 5 | $198B |
|
||
| Engineering / Construction | 4 | $72B |
|
||
| Energy Services | 3 | $60B |
|
||
| Utilities | 3 | $41B |
|
||
| Healthcare | 2 | $330B |
|
||
Price history
-50.1% since first listed12 events — show timeline
- 2026-03-20 Relisted — LERA
- 2026-02-25 Contingent — LERA
- 2026-01-07 Price Changed $59,900 LERA
- 2025-12-18 Price Changed $75,000 LERA
- 2025-09-06 Listed $80,000 LERA
- 2025-09-03 Listing Removed — LERA
- 2025-05-01 Price Changed $85,000 LERA
- 2025-04-19 Listed $236,000 LERA
- 2024-04-23 Sold (MLS) — LERA
- 2024-04-20 Pending — LERA
- 2024-02-22 Listed $120,000 LERA
- 2018-10-22 Sold (Public Records) — Public Records
Property tax history
+2.6%/yrLatest (2025): $2,064 · -16.0% YoY. Source: county tax records.
Cash-flow waterfall
monthlySold comps — $/sqft
last 12 mo · ≤1 miLoading sold comps…