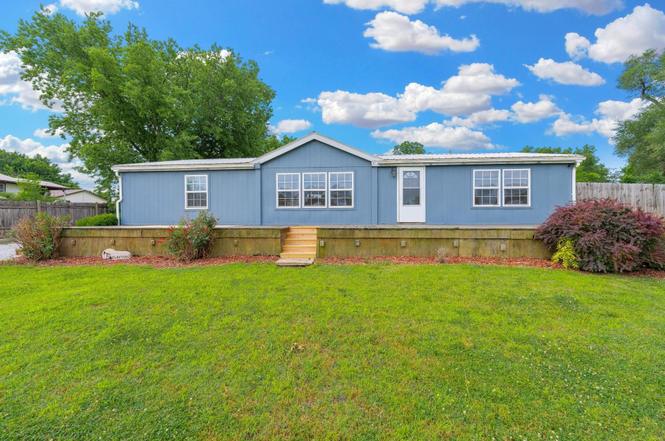
309 W Spring · Geuda Springs, KS
Flood risk 1/10 · Minimal
- FEMA flood zone
- X (unshaded)
- Chance of flooding over 30 yrs
- 0.0%
- Est. flood insurance / yr
- $507 – $1,088
Fire risk 5/10 · Moderate
- Est. fire insurance / yr
- $1,154 – $2,142
Heat risk 5/10 · Moderate
- Hot days now (above 108°F)
- 7 days/yr
- Hot days in 30 yrs
- 19 days/yr
Wind risk 2/10 · Minimal
- Chance of severe wind over 30 yrs
- 1.0%
Air-quality risk 2/10 · Minimal
- Unhealthy air days now
- 1 days/yr
- Unhealthy air days in 30 yrs
- 1 days/yr
Risk factors via First Street. Map © Google.
Why this score? — see what drove the C+ grade
The composite is a weighted blend of 9 inputs, each scored 0–100. Each bar is that input's sub-score; the figure is the points it added to the 100-point composite (weight × sub-score).
- Cash flow +25.0/30.0
- DSCR +8.1/10.0
- ARV discount +7.5/15.0
- 1% rule +6.5/10.0
- Appreciation +5.0/10.0
- Condition / age +3.8/5.0
- Livability +2.8/5.0
- Rent growth +2.5/5.0
- Schools +2.5/10.0
$99,000
🖨 Deal sheet 📄 Offer letter ✓ Due diligence
Key facts
- Large back deck
- Spacious backyard
- Three peach trees
Tags
Property features AI
Exterior
- Parking: 2-car garage
- Utilities: Natural gas available; Public water; Sewer available
- Home design: Single-family offsite-built home
- Construction: Composition roof; No basement / no foundation details listed
- Exterior features: One-level layout; Deck; Storm door(s)
Interior
- Kitchen: Dishwasher; Microwave; Range; Refrigerator
- Bathrooms: 2 full bathrooms
- Heating & cooling: Central air conditioning; Forced air heating (natural gas)
- Interior features: Dishwasher; Microwave; Range; Refrigerator
- Laundry & utility: Laundry on the main floor
Neighborhood map
What this means for you Summary
Snapshot
- This is a 3-bed/2.0-bath single-family listed at $99k. Condition is rated good.
Deal economics
- At list price, monthly cash flow is $215 ($3k/yr) — positive.
- The deal already cash-flows at list — no discount required.
- Meets the 1% rule at list price ($1k rent vs $99k).
Location & tenants
- Location reads 56/100 on livability (#543 in KS) — a working-class tenant base; expect higher turnover. Strengths: cost of living A+, housing A+; Watch: employment D+, crime F, amenities F.
- Oxford (rural): math 30% / reading 28% proficiency, ranked #102 of 169 in KS (top 60%) — low school quality limits family demand, transient renter base, plan for 1-2y turnover.
- Zoned schools: Oxford Elem (math 37% / reading 32%, grade F, #388 of 684 statewide, top 61%, 207 students, 44% FRL); Oxford Jr/Sr High (math 22% / reading 22%, grade F, #165 of 327 statewide, top 55%, 212 students, 39% FRL).
- Market conditions: 2 active listings in the ZIP; 14 units permitted in Sumner County in 2024 (0 in 5+ unit buildings).
Forward outlook
- In year one you build about $4k of equity ($684 loan paydown + $3k appreciation (3.0% local appreciation)).
- Sumner County population projected at -13% by 2050 — secular population decline; favor cash flow + early exit over multi-decade hold.
- At projected returns (3.0% appreciation + 3.0% rent growth), your $28k cash investment doubles in ~5 years — after that, you're playing with house money.
- By year 9, paydown + projected appreciation supports a ~$31k cash-out refi (75% LTV) — recoverable capital for the next deal without selling this one.
Negotiation context
- Only 1 days on market — expect competitive offers; lowballing is unlikely to land.
Risks & watch-outs
- Climate carrying-cost: moderate wildfire risk; extreme-heat days projected 7→19/yr by 2055 (HVAC capex compounding) — expect insurance premiums to compound above CPI over the hold.
Questions for the listing agent
- Is there a deadline driving the sale (1031 exchange, divorce, estate, relocation)? That informs how much negotiation room exists.
- Schools are F-rated, which usually means shorter tenancies and higher turnover. Who's the typical renter profile here, and what's been the actual vacancy rate?
- Crime grade is F in this area — have there been break-ins, vandalism, or insurance claims at this property in the last 3 years? What carrier currently insures it and at what premium?
- What's the average days-on-market for RENTAL listings here right now (not sales)? A rising rental-DOM trend means longer vacancies and softer asking-rent achievability than the comps imply.
- What's the recent tenant-quality profile in this submarket — average credit score on applications, eviction rate, late-payment / NSF rate, and stable-employment percentage? A property-management company in the area should have these aggregated.
- How much new for-sale + rental construction is in the pipeline within 1–3 miles? Heavy new supply typically softens prices + rents 12–24 months out; constrained supply supports both.
Investment metrics
- 1% rule
- 1.15% ✓
- Cap rate
- 8.90%
- Cash-on-cash
- 9.32%
- DSCR
- 1.41
- GRM
- 7.2
CMA / ARV
No comps found within radius.
Projected returns pro-forma
3.0% appreciation · 3.0% rent growth · sell at horizon
- IRR
- 16.2%
- Equity multiple
- 1.93×
- Total profit
- $25,658
- Equity at exit
- $44,515
- IRR
- 17.8%
- Equity multiple
- 3.60×
- Total profit
- $72,159
- Equity at exit
- $68,602
Cash invested: $27,720 (down + closing). Projections, not guarantees.
Landlord ↔ Tenant lean methodology
- Overall (STATE)
- 83 Strongly Landlord-Friendly
- State Kansas
- 83 Strongly Landlord-Friendly · R+10
- County
- — inherits STATE
- City
- — inherits STATE
ZIP-level market 67051
- Active inventory
- 2
- Price-to-rent
- 7.2×
Monthly cashflow live
- Estimated rent
- $1,139 medium interval (Pro) →
- Mortgage (P&I)
- −$519
- Tax est. 1.5%
- −$124 /mo · $1,485/yr
- Insurance
- −$41
- HOA
- −$0
- Vacancy / Maint / Mgmt
- −$239
- Net cashflow
- $215
Break-even live
UW: 25.0% down · 7.5% · 30yr · 1.5% tax · 5.0% vac · 8.0% maint · 8.0% mgmt
Financing live
Cash to close
- Down payment
- $24,750
- Closing costs
- $2,970
- Reserves months
- —
- Total cash needed
- —
Loan-product check · same deal, 3 products live
Conventional
25% down · 7.5% · 30yr
- Down + closing
- —
- Monthly P&I
- —
- Monthly cashflow
- —
- DSCR
- —
- Eligible?
- —
Personal DTI + credit; lowest rate.
DSCR
20% down · 8.5% · 30yr
- Down + closing
- —
- Monthly P&I
- —
- Monthly cashflow
- —
- DSCR
- —
- Eligible?
- —
No personal income docs; deal must DSCR.
Hard money
10% down · 12.0% · 12mo
- Down + closing
- —
- Monthly P&I
- —
- Monthly cashflow
- —
- DSCR
- —
- Eligible?
- —
Short-term bridge; refi at stabilization.
Listing history 1 events
-
2026-06-17$99,000 Active 1 DOM
ⓘ Source: listings_history table (triggers on properties + properties_extension) + one-shot
backfill from property_details.listing_events for pre-trigger history.
Climate risk First Street
- Flood 1/10 Low FEMA zone X (unshaded) · 0% chance over 30 yrs
- Wildfire 5/10 Major
- Heat 5/10 Major 7 d/yr ≥108°F today · 19 d/yr by 30 yrs out
- Wind 2/10 Low 100% chance of damaging wind over 30 yrs
- Air quality 2/10 Low 1 unhealthy d/yr today · 1 by 30 yrs out
Nearby sold comps map
Loading sold comps map…
Walkable amenities ~0.75 mi
Loading nearby amenities…
Taxation est. · year 1
- Rental income
- $13,663
- − Mortgage interest
- −$5,546
- − Property taxes
- −$1,485
- − Insurance
- −$495
- − Repairs & maintenance
- −$1,093
- − Management
- −$1,093
- − Depreciation
- −$2,880
- Taxable income
- $1,072
- Est. tax owed @ 24.0%
- −$257
- After-tax cash flow
- $2,327/yr
For passive investors: Depreciation is non-cash, so a rental often shows a tax loss while cash-flowing — sheltering income. Rental losses are passive: they offset passive income freely, and up to $25,000/yr can offset ordinary (W-2) income if you actively participate and your MAGI is under $100k (phasing out to $0 by $150k); unused losses carry forward. On sale, claimed depreciation is recaptured at up to 25%, and gains may owe capital-gains tax (a 1031 exchange can defer both). Figures are a year-1 estimate at your 24.0% rate — not tax advice; consult a CPA.
Condition & rehab AI · 12 photos
This single-family home in Geuda Springs, KS, is in good condition with a good condition score of 75. It has a good roof, exterior, and interior walls, and is well-maintained. The home has a good kitchen and bathroom, and the landscaping and curb appeal are good. The home is move-in ready and has a good resale and rental value. The highest-ROI updates would be to paint the exterior, replace the carpet, update the kitchen cabinets, install new flooring in the living room, and replace the windows.
Value-add opportunities
- Both Paint exterior — Enhances curb appeal and value
- Both Replace carpet — Improves comfort and aesthetics
- Both Update kitchen cabinets — Modernizes the space and adds value
- Both Install new flooring in living room — Enhances comfort and aesthetics
- Both Replace windows — Improves energy efficiency and aesthetics
Renovation cost estimate screening
Value-add ROI direction
- Both Paint exterior — Enhances curb appeal and value ↑
- Both Replace carpet — Improves comfort and aesthetics ↑
- Both Update kitchen cabinets — Modernizes the space and adds value ↑
- Both Install new flooring in living room — Enhances comfort and aesthetics ↑
- Both Replace windows — Improves energy efficiency and aesthetics ↑
ⓘ Cost ranges are severity-bucket heuristics (US national rule-of-thumb). Get contractor quotes + a written scope before underwriting a rehab budget.
Schools (NCES district)
- District
- Oxford
- NCES district ID
- 2010440
- Math proficiency
- 30% ▲ 5.00%
- Reading proficiency
- 28% ▲ 3.00%
- Median HH income
- $50,686
- Composite
- 25.46/100
- National rank
- #7448
- State rank
- #102 of 169 in KS
Livability — Geuda Springs
- Score
- 56/100
- State rank
- #543
- US rank
- #22394
Category grades
Schools grade is shown separately in the Schools card above.
Census & demographics
- Census place
- Geuda Springs, KS
- Population (ZIP)
- 363
Population outlook (Sumner County) Hauer SSP2
- Today (2025)
- 22,787 people
- By 2030
- 22,292 · -2.2%
- By 2040
- 21,113 · -7.3%
- By 2050
- 19,916 · -12.6%
- By 2075
- 18,286 · -19.8%
- By 2100
- 16,450 · -27.8%
Race, ethnicity, and origin ACS 2023
- Neighborhood character
- Predominantly White (92%)
- Race & ethnicity
- White 92% Two or more races 7% Native American 1%
- Common ancestry
- Lithuanian 12% Polish 2% Iranian 1%
Political lean MEDSL · Sumner
- 2024 margin
- Solid R (+50.1) · D 23.9% · R 74.0% · Other 2.0%
- 2008→2024 swing
- -17.4pp toward R · 2008: -32.7pp · 2024: -50.1pp
- All cycles
- 2024: R+50.1 2020: R+50.5 2016: R+50.6 2012: R+39.4 2008: R+32.7
Not yet ingested
- Civics
- —
Market trends
- HPI YoY
- —
- Current HPI
- —
- Rent YoY
- —
- Metro
- —
- State GDP YoY
- —
- F500 in state
- 0
Price history
1 event — show timeline
- 2026-06-17 Listed $99,000 SCKMLS as Distributed by MLS Grid
Cash-flow waterfall
monthlySold comps — $/sqft
last 12 mo · ≤1 miLoading sold comps…