 Duplex
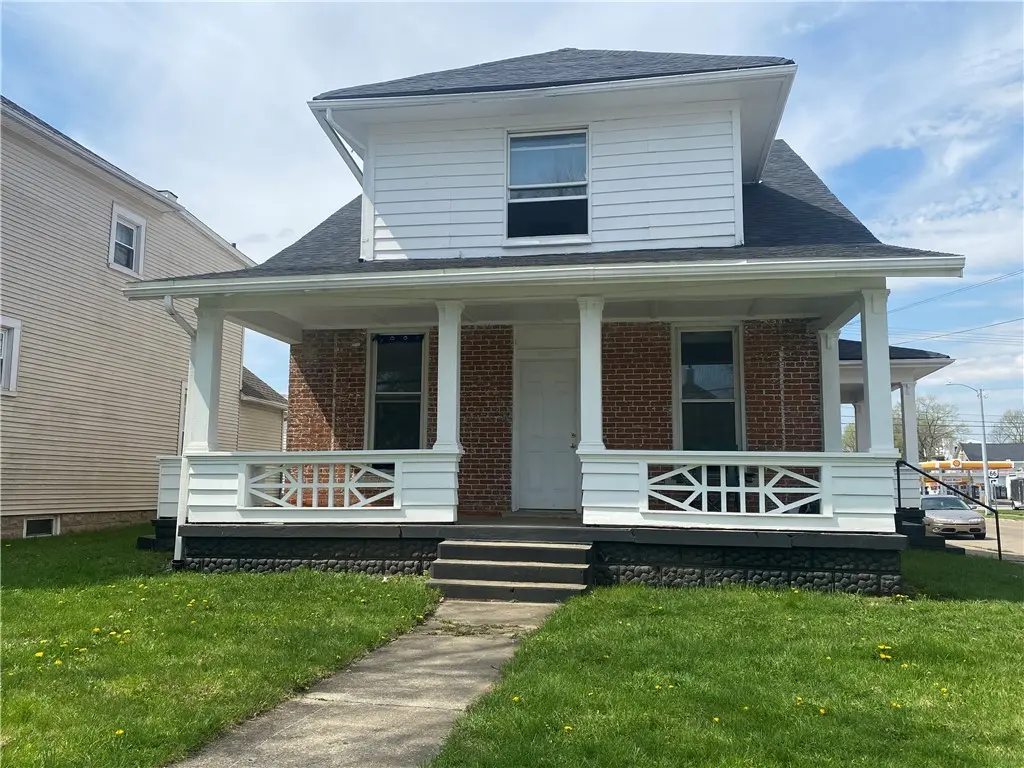
123 E North St · Piqua, OH
Flood risk 1/10 · Minimal
- FEMA flood zone
- X (unshaded)
- Chance of flooding over 30 yrs
- 0.0%
- Est. flood insurance / yr
- $473 – $860
Fire risk 1/10 · Minimal
- Est. fire insurance / yr
- $713 – $1,323
Heat risk 3/10 · Minor
- Hot days now (above 100°F)
- 7 days/yr
- Hot days in 30 yrs
- 18 days/yr
Wind risk 2/10 · Minimal
- Chance of severe wind over 30 yrs
- —
Air-quality risk 2/10 · Minimal
- Unhealthy air days now
- 1 days/yr
- Unhealthy air days in 30 yrs
- 2 days/yr
Risk factors via First Street. Map © Google.
Why this score? — see what drove the C- grade
The composite is a weighted blend of 9 inputs, each scored 0–100. Each bar is that input's sub-score; the figure is the points it added to the 100-point composite (weight × sub-score).
- Cash flow +26.0/30.0
- DSCR +8.8/10.0
- 1% rule +5.7/10.0
- Schools +4.0/10.0
- Livability +3.1/5.0
- Rent growth +2.5/5.0
- Condition / age +2.5/5.0
- ARV discount +0.0/15.0
- Appreciation +0.0/10.0
$199,900
🖨 Deal sheet 📄 Offer letter ✓ Due diligence
Multi-family units
County records classify this as Multi-Family (2-4 Unit). Listing-text estimate: 2 units. confirmed
Listing remarks MLS
Great investment opportunity! This duplex offers strong rental potential with a versatile layout. The lower unit features 3 spacious bedrooms, a large eat-in kitchen, 1 full bath, and access to a 1-car garage--ideal for owner-occupants or tenants seeking extra space. The upper unit includes 1 bedroom and 1 full bath, perfect for additional rental income. A solid addition to any investment portfolio!
Key facts
- 3,920 sq ft lot
- Garage
- Built 1920
Neighborhood map
What this means for you Summary
Snapshot
- This is a 2 × 2-bed/1.0-bath units multifamily listed at $200k.
Deal economics
- At list price, monthly cash flow is $498 ($6k/yr) — positive. Per door: $249/mo.
- The deal already cash-flows at list — no discount required.
- Meets the 1% rule at list price ($2k rent vs $200k).
- Recommended offer: $188k (6.0% below list) — sets the bar for market timing.
- Cap rate 9.3% vs local median 4.7% in Piqua — top-decile yield for the area; either an underpriced asset or a hidden risk that comps aren't pricing in. Stress-test before assuming the spread holds.
Location & tenants
- Location reads 62/100 on livability (#887 in OH) — a middle-class / working-renter tenant base. Strengths: cost of living A+, housing A+; Watch: employment D+, crime F, amenities F.
- Piqua City (rural): math 45% / reading 50% proficiency, ranked #482 of 656 in OH (top 74%) — families likely to look elsewhere, expect single-tenant / working-renter base with shorter leases.
- Market conditions: 139 active listings in the ZIP; 1 comparable units currently listed for rent nearby; 326 units permitted in Miami County in 2024 (0 in 5+ unit buildings).
- This rent runs 37% of the median local income ($69k/yr) — at the standard rent-burdened threshold; future hikes will face affordability resistance.
Forward outlook
- Local home prices are declining (-3.0%/yr); year-one equity from $1k of loan paydown is wiped out by about $6k of value loss. Plan a longer hold.
Negotiation context
- It's been on market 66 days — a 6% lower offer ($188k) is reasonable based on typical stale-listing flexibility.
- 5 sale attempts since 4y ago; this cycle's ask has dropped $25k (11%) from the opening price — seller is motivated, your offer sets the floor, not the list.
- Current owner paid $75k; list at $200k implies a 167% gain — meaningful room to come down on a strong offer.
Risks & watch-outs
- Watch-outs: built in 1920 — expect roof / HVAC / electrical / plumbing capex.
Questions for the listing agent
- It's been on market 66 days. Have you received any prior offers? Is the seller open to a 6% concession, seller financing, or rate buy-down credit?
- Can we see the unit-by-unit rent roll, current vacancy, and any below-market leases? What's the average tenancy length?
- What capital expenditures (roof, boiler, parking lot, exteriors) have been made in the last 5 years, and what's planned in the next 2?
- Built in 1920 — when were the roof, HVAC, electrical panel, plumbing, and water heater last replaced?
- Why hasn't it sold? Are there any deal-killer items the seller is aware of (foundation, flood, title, zoning, code violations)?
- Is there a deadline driving the sale (1031 exchange, divorce, estate, relocation)? That informs how much negotiation room exists.
- Crime grade is F in this area — have there been break-ins, vandalism, or insurance claims at this property in the last 3 years? What carrier currently insures it and at what premium?
- What's the average days-on-market for RENTAL listings here right now (not sales)? A rising rental-DOM trend means longer vacancies and softer asking-rent achievability than the comps imply.
- What's the recent tenant-quality profile in this submarket — average credit score on applications, eviction rate, late-payment / NSF rate, and stable-employment percentage? A property-management company in the area should have these aggregated.
- How much new apartment / multifamily construction is in the pipeline within 1–3 miles? Heavy new supply (>2% of stock underway) typically softens rents 12–24 months out; light construction supports rent growth.
Investment metrics
- 1% rule
- 1.07% ✓
- Cap rate
- 9.28%
- Cash-on-cash
- 10.69%
- DSCR
- 1.48
- GRM
- 7.8
CMA / ARV
- ARV (median comp)
- $163,248
- List price
- $199,900
- Delta
- 22.45%
- Verdict
- OVERPRICED
- Comps
- 20 within 1.0 mi
Show comp detail 9 sales within ~0.75 mi
| Address | Dist | Beds/Ba | Sqft | Sold | Price | $/sf | Match |
|---|---|---|---|---|---|---|---|
| 421 N Downing St | 0.21mi | 4/2.0 (+1) | 2,198 (-0%) | 20mo | $185,000 | $84 | 69 |
| 726 N Wayne St | 0.20mi | 3/3.0 | 2,384 (+8%) | 14mo | $165,000 | $69 | 62 |
| 650 N Main St | 0.11mi | 3/2.0 | 1,892 (-14%) | 14mo | $100,000 | $53 | 60 |
| 508 W High St | 0.43mi | 4/2.0 (+1) | 2,076 (-6%) | 15mo | $122,500 | $59 | 53 |
| 127-129 1st St | 0.46mi | 4/2.0 (+1) | 2,036 (-8%) | 17mo | $84,750 | $42 | 47 |
| 127 First St | 0.47mi | 4/2.0 (+1) | 2,036 (-8%) | 17mo | $84,750 | $42 | 47 |
| 444 E Ash St | 0.29mi | 4/3.0 (+1) | 1,956 (-11%) | 18mo | $185,000 | $95 | 44 |
| 826 Nicklin Ave | 0.60mi | 4/2.0 (+1) | 2,067 (-6%) | 18mo | $235,000 | $114 | 42 |
| 519 Miami St | 0.73mi | 4/2.0 (+1) | 1,870 (-15%) | 12mo | $100,000 | $53 | 26 |
Match score weights: distance 35% · size 25% · config 20% · recency 20%. Top-matched comps best support the ARV.
Projected returns pro-forma
-3.0% appreciation · 3.0% rent growth · sell at horizon
- IRR
- -0.3%
- Equity multiple
- 0.99×
- Total profit
- $-732
- Equity at exit
- $29,806
- IRR
- 9.3%
- Equity multiple
- 1.71×
- Total profit
- $39,898
- Equity at exit
- $17,284
Cash invested: $55,972 (down + closing). Projections, not guarantees.
Landlord ↔ Tenant lean methodology
- Overall (STATE)
- 73 Landlord-Friendly
- State Ohio
- 73 Landlord-Friendly · R+6
- County
- — inherits STATE
- City
- — inherits STATE
ZIP-level market 45356
- Active inventory
- 139
- Price-to-rent
- 15.6×
Monthly cashflow live
- Estimated rent
- $2,140 high interval (Pro) →
- Mortgage (P&I)
- −$1,048
- Tax from tax record
- −$61 /mo · $727/yr
- Insurance
- −$83
- HOA
- −$0
- Vacancy / Maint / Mgmt
- −$449
- Net cashflow
- $498
Break-even live
2-unit breakdown (identical units grouped — click to expand)
| Units | Beds | Baths | Est. rent |
|---|---|---|---|
| 2× units | 2 | 1 | $2,140 |
| #1 | 2 | 1 | $1,070 |
| #2 | 2 | 1 | $1,070 |
| Total (2 units) | $2,140 | ||
UW: 25.0% down · 7.5% · 30yr · 1.5% tax · 5.0% vac · 8.0% maint · 8.0% mgmt
Financing live
Cash to close
- Down payment
- $49,975
- Closing costs
- $5,997
- Reserves months
- —
- Total cash needed
- —
Loan-product check · same deal, 3 products live
Conventional
25% down · 7.5% · 30yr
- Down + closing
- —
- Monthly P&I
- —
- Monthly cashflow
- —
- DSCR
- —
- Eligible?
- —
Personal DTI + credit; lowest rate.
DSCR
20% down · 8.5% · 30yr
- Down + closing
- —
- Monthly P&I
- —
- Monthly cashflow
- —
- DSCR
- —
- Eligible?
- —
No personal income docs; deal must DSCR.
Hard money
10% down · 12.0% · 12mo
- Down + closing
- —
- Monthly P&I
- —
- Monthly cashflow
- —
- DSCR
- —
- Eligible?
- —
Short-term bridge; refi at stabilization.
Rent comps 1 comps
| Address | Beds | Baths | Sqft | Rent | $/sqft | DOM | Units | Dist |
|---|---|---|---|---|---|---|---|---|
| 200 E High St Piqua, OH | 3.0 | 1.0 | 1500 | $1,365 | $0.91 | 3d | 1 | 0.22mi |
Listing history 34 events
-
2026-06-18days on market $199,900 Active 66 DOM
-
2026-06-17days on market $199,900 Active 65 DOM
-
2026-06-16days on market $199,900 Active 64 DOM
-
2026-06-15days on market $199,900 Active 63 DOM
-
2026-06-14days on market $199,900 Active 61 DOM
-
2026-06-13days on market $199,900 Active 60 DOM
-
2026-06-10days on market $199,900 Active 58 DOM
-
2026-06-09days on market $199,900 Active 57 DOM
-
2026-06-08days on market $199,900 Active 56 DOM
-
2026-06-07days on market $199,900 Active 55 DOM
-
2026-06-05days on market $199,900 Active 52 DOM
-
2026-06-03days on market $199,900 Active 51 DOM
-
2026-06-02days on market $199,900 Active 50 DOM
-
2026-06-01days on market $199,900 Active 49 DOM
-
2026-05-31days on market $199,900 Active 48 DOM
-
2026-05-31days on market $199,900 Active 47 DOM
-
2026-04-28price $199,900 402-char remark
Show marketing remark (24 chars)
Duplex lower unit offers
-
2026-04-28price $199,900 24-char remark
Show marketing remark (24 chars)
Duplex lower unit offers
-
2026-04-12$224,900 Active 402-char remark
Show marketing remark (24 chars)
Duplex lower unit offers
-
2026-04-12$224,900 Active 24-char remark
Show marketing remark (24 chars)
Duplex lower unit offers
-
2025-05-29soldstatus $75,000 Closed
-
2025-05-29soldstatus $75,000 Closed
-
2025-05-01status Pending
-
2025-05-01status Pending
-
2025-04-15$63,000 Active
-
2025-04-15$63,000 Active
-
2022-11-01historical
-
2022-11-01status Pending
-
2022-09-12price $76,000
-
2022-09-07price $81,000
-
2022-07-28price $85,000
-
2022-06-23$90,000 Active
-
2002-09-13soldstatus $63,500
-
1983-11-04soldstatus $33,000
ⓘ Source: listings_history table (triggers on properties + properties_extension) + one-shot
backfill from property_details.listing_events for pre-trigger history.
Tax reassessment forecast OH · Partial reset (capped growth)
- Current annual tax
- $727 · $61/mo
- Projected year-2 tax
- $1,923 · $160/mo
- Expected delta
- +$1,196/yr (+$100/mo · 164.5%)
ⓘ Screening estimate from a state-policy table — verify with the county assessor before closing.
Climate risk First Street
- Flood 1/10 Low FEMA zone X (unshaded) · 0% chance over 30 yrs
- Wildfire 1/10 Low
- Heat 3/10 Moderate 7 d/yr ≥100°F today · 18 d/yr by 30 yrs out
- Wind 2/10 Low
- Air quality 2/10 Low 1 unhealthy d/yr today · 2 by 30 yrs out
Nearby sold comps map
Loading sold comps map…
Walkable amenities ~0.75 mi
Loading nearby amenities…
Taxation est. · year 1
- Rental income
- $25,680
- − Mortgage interest
- −$11,198
- − Property taxes
- −$727
- − Insurance
- −$1,000
- − Repairs & maintenance
- −$2,054
- − Management
- −$2,054
- − Depreciation
- −$5,815
- Taxable income
- $2,832
- Est. tax owed @ 24.0%
- −$680
- After-tax cash flow
- $5,301/yr
For passive investors: Depreciation is non-cash, so a rental often shows a tax loss while cash-flowing — sheltering income. Rental losses are passive: they offset passive income freely, and up to $25,000/yr can offset ordinary (W-2) income if you actively participate and your MAGI is under $100k (phasing out to $0 by $150k); unused losses carry forward. On sale, claimed depreciation is recaptured at up to 25%, and gains may owe capital-gains tax (a 1031 exchange can defer both). Figures are a year-1 estimate at your 24.0% rate — not tax advice; consult a CPA.
Schools (NCES district)
- District
- Piqua City
- NCES district ID
- 3904464
- Math proficiency
- 45% ▼ -11.00%
- Reading proficiency
- 50% ▼ -7.00%
- Median HH income
- $41,751
- Composite
- 39.91/100
- National rank
- #3855
- State rank
- #482 of 656 in OH
Livability — Piqua
- Score
- 62/100
- State rank
- #887
- US rank
- #16830
Category grades
Schools grade is shown separately in the Schools card above.
Census & demographics
- Census place
- Piqua, OH
- County
- Miami County · 85,667 people
- City population
- 25,237
- Metro
- Dayton-Kettering, OH
- Population (ZIP)
- 25,237
- Household income
- $69,188
- Rent vs Own
- Severe rent burden
- 748.0
Population outlook (Miami County) Hauer SSP2
- Today (2025)
- 107,816 people
- By 2030
- 108,896 · +1.0%
- By 2040
- 109,581 · +1.6%
- By 2050
- 108,110 · +0.3%
- By 2075
- 101,523 · -5.8%
- By 2100
- 85,787 · -20.4%
Race, ethnicity, and origin ACS 2023
- Neighborhood character
- Predominantly White (92%)
- Race & ethnicity
- White 92% Two or more races 3% Black 2% Hispanic / Latino 1%
- Common ancestry
- Iranian 2% Italian 2% Lithuanian 2%
- Foreign-born
- 1%
- Languages at home
- 99% English-only · Spanish 1% Vietnamese 0%
Political lean MEDSL · Miami
- 2024 margin
- Solid R (+45.1) · D 27.0% · R 72.1%
- 2008→2024 swing
- -16.6pp toward R · 2008: -28.5pp · 2024: -45.1pp
- All cycles
- 2024: R+45.1 2020: R+44.3 2016: R+45.6 2012: R+35.6 2008: R+28.5
Not yet ingested
- Civics
- —
Market trends
- HPI YoY
- ▼ -137.96%
- Current HPI
- 251.435
- Rent YoY
- —
- Metro
- Dayton-Kettering, OH
- State GDP YoY
- ▲ 1.98%
- F500 in state
- 48
Industry mix (Fortune 500 HQ in OH)
| Industry | F500 HQs | Revenue |
|---|---|---|
| Insurance | 3 | $145B |
|
||
| Industrial Machinery | 3 | $49B |
|
||
| Financial Services | 3 | $24B |
|
||
| Consumer Goods | 2 | $93B |
|
||
| Aerospace / Defense | 2 | $47B |
|
||
| Utilities | 2 | $33B |
|
||
Price history
+505.8% since first listed18 events — show timeline
- 2026-04-28 Price Changed $199,900 WRIST
- 2026-04-28 Price Changed $199,900 Dayton MLS
- 2026-04-12 Listed $224,900 Dayton MLS
- 2026-04-12 Listed $224,900 WRIST
- 2025-05-29 Sold (MLS) $75,000 Dayton MLS
- 2025-05-29 Sold (MLS) $75,000 WRIST
- 2025-05-01 Pending — WRIST
- 2025-05-01 Pending — Dayton MLS
- 2025-04-15 Listed $63,000 Dayton MLS
- 2025-04-15 Listed $63,000 WRIST
- 2022-11-01 Listing Removed — Dayton MLS
- 2022-11-01 Pending — Dayton MLS
- 2022-09-12 Price Changed $76,000 Dayton MLS
- 2022-09-07 Price Changed $81,000 Dayton MLS
- 2022-07-28 Price Changed $85,000 Dayton MLS
- 2022-06-23 Listed $90,000 Dayton MLS
- 2002-09-13 Sold (Public Records) $63,500 Public Records
- 1983-11-04 Sold (Public Records) $33,000 Public Records
Property tax history
-1.9%/yrLatest (2025): $727 · -60.3% YoY. Source: county tax records.
Cash-flow waterfall
monthlySold comps — $/sqft
last 12 mo · ≤1 miLoading sold comps…