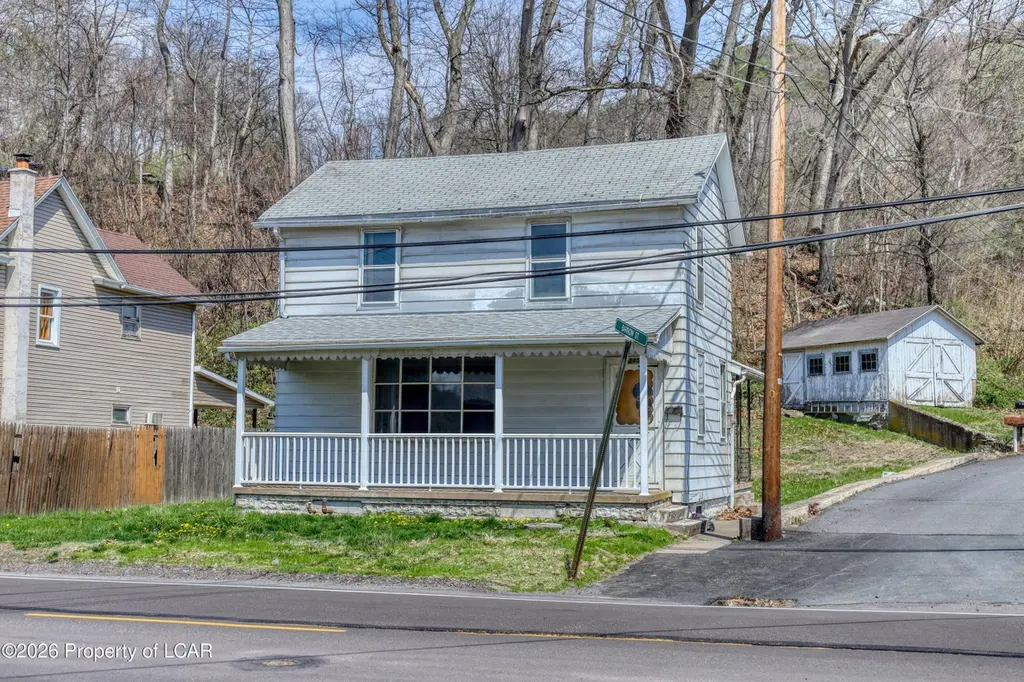
315 Poplar St · Plymouth, PA
Flood risk 9/10 · Severe
- FEMA flood zone
- X (shaded)
- Chance of flooding over 30 yrs
- 0.99%
- Est. flood insurance / yr
- $507 – $1,088
Fire risk 3/10 · Minor
- Est. fire insurance / yr
- $511 – $949
Heat risk 4/10 · Minor
- Hot days now (above 98°F)
- 8 days/yr
- Hot days in 30 yrs
- 17 days/yr
Wind risk 3/10 · Minor
- Chance of severe wind over 30 yrs
- 5.0%
Air-quality risk 1/10 · Minimal
- Unhealthy air days now
- 0 days/yr
- Unhealthy air days in 30 yrs
- 0 days/yr
Risk factors via First Street. Map © Google.
Why this score? — see what drove the B grade
The composite is a weighted blend of 9 inputs, each scored 0–100. Each bar is that input's sub-score; the figure is the points it added to the 100-point composite (weight × sub-score).
- Cash flow +30.0/30.0
- ARV discount +15.0/15.0
- DSCR +10.0/10.0
- 1% rule +9.0/10.0
- Livability +3.3/5.0
- Rent growth +2.5/5.0
- Condition / age +2.5/5.0
- Schools +2.0/10.0
- Appreciation +0.0/10.0
$89,900
🖨 Deal sheet 📄 Offer letter ✓ Due diligence
Listing remarks
Two-story home on a corner lot featuring 3 bedrooms and 1.5 bathrooms. The main level includes a living room, dining room, and kitchen with laundry hookups. The second floor houses three bedrooms and a full bath. Exterior features include a 1-car detached garage at the rear. Call today to schedule a private tour!
Key facts
- 3,712 sq ft lot
- Garage
- Listed 7 days
Neighborhood map
What this means for you Summary
Snapshot
- This is a 3-bed/1.5-bath single-family listed at $90k.
Deal economics
- At list price, monthly cash flow is $319 ($4k/yr) — positive.
- The deal already cash-flows at list — no discount required.
- Meets the 1% rule at list price ($1k rent vs $90k).
- Cap rate 11.4% vs local median 8.3% in Plymouth — top-decile yield for the area; either an underpriced asset or a hidden risk that comps aren't pricing in. Stress-test before assuming the spread holds.
Location & tenants
- Location reads 66/100 on livability (#1,068 in PA) — a middle-class / working-renter tenant base. Strengths: cost of living A+, health & safety A+, housing B+; Watch: employment D, crime F, amenities F.
- Greater Nanticoke Area SD (suburban): math 14% / reading 34% proficiency, ranked #479 of 539 in PA (top 89%) — low school quality limits family demand, transient renter base, plan for 1-2y turnover.
- Market conditions: 59 active listings in the ZIP; 11 comparable units currently listed for rent nearby; rentals leasing fast (median 14d on market — plan ~1-2 weeks tenant-placement turnaround); 349 units permitted in Luzerne County in 2024 (16 in 5+ unit buildings).
Forward outlook
- Local home prices are declining (-3.0%/yr); year-one equity from $622 of loan paydown is wiped out by about $3k of value loss. Plan a longer hold.
- Luzerne County population projected at +4% by 2050 — modest demand growth; plan on rents tracking national, not racing it.
- At projected returns (-3.0% appreciation + 3.0% rent growth), your $25k cash investment doubles in ~8 years — after that, you're playing with house money.
Negotiation context
- Only 7 days on market — expect competitive offers; lowballing is unlikely to land.
Risks & watch-outs
- Watch-outs: flood insurance adds $66/mo; built in 1900 — expect roof / HVAC / electrical / plumbing capex.
- Climate carrying-cost: severe flood risk — expect insurance premiums to compound above CPI over the hold.
Questions for the listing agent
- Built in 1900 — when were the roof, HVAC, electrical panel, plumbing, and water heater last replaced?
- What's the actual annual flood-insurance premium (NFIP or private), and is the property in a SFHA with mandatory coverage?
- Is there a deadline driving the sale (1031 exchange, divorce, estate, relocation)? That informs how much negotiation room exists.
- Crime grade is F in this area — have there been break-ins, vandalism, or insurance claims at this property in the last 3 years? What carrier currently insures it and at what premium?
- What's the average days-on-market for RENTAL listings here right now (not sales)? A rising rental-DOM trend means longer vacancies and softer asking-rent achievability than the comps imply.
- What's the recent tenant-quality profile in this submarket — average credit score on applications, eviction rate, late-payment / NSF rate, and stable-employment percentage? A property-management company in the area should have these aggregated.
- How much new for-sale + rental construction is in the pipeline within 1–3 miles? Heavy new supply typically softens prices + rents 12–24 months out; constrained supply supports both.
Investment metrics
- 1% rule
- 1.40% ✓
- Cap rate
- 11.43%
- Cash-on-cash
- 18.36%
- DSCR
- 1.82
- GRM
- 5.9
CMA / ARV
- ARV (on-the-fly)
- $170,328
- Comps found
- 8
Show comp detail 8 sales within ~0.75 mi
| Address | Dist | Beds/Ba | Sqft | Sold | Price | $/sf | Match |
|---|---|---|---|---|---|---|---|
| 315 Poplar St | 0.00mi | 3/1.5 | 1,208 (0%) | 1mo | $80,000 | $66 | 99 |
| 399 Garfield St | 0.67mi | 3/1.0 | 1,151 (-5%) | 5mo | $168,700 | $147 | 55 |
| 125 Honey Pot St | 0.69mi | 3/2.0 | 1,280 (+6%) | 2mo | $180,000 | $141 | 54 |
| 108 N Mill St | 0.70mi | 3/1.5 | 1,141 (-6%) | 8mo | $125,000 | $110 | 51 |
| 93 Garfield St | 0.41mi | 3/1.5 | 1,312 (+9%) | 23mo | $133,000 | $101 | 48 |
| 36 Maude St | 0.75mi | 3/1.0 | 1,250 (+4%) | 15mo | $185,500 | $148 | 45 |
| 21 Orange St | 0.54mi | 3/1.0 | 1,113 (-8%) | 21mo | $180,000 | $162 | 42 |
| 128 Garfield St | 0.38mi | 3/1.0 | 1,376 (+14%) | 23mo | $60,000 | $44 | 38 |
Match score weights: distance 35% · size 25% · config 20% · recency 20%. Top-matched comps best support the ARV.
Projected returns pro-forma
-3.0% appreciation · 3.0% rent growth · sell at horizon
- IRR
- 5.9%
- Equity multiple
- 1.23×
- Total profit
- $5,788
- Equity at exit
- $13,404
- IRR
- 15.3%
- Equity multiple
- 2.25×
- Total profit
- $31,402
- Equity at exit
- $7,773
Cash invested: $25,172 (down + closing). Projections, not guarantees.
Landlord ↔ Tenant lean methodology
- Overall (STATE)
- 62 Landlord-Friendly
- State Pennsylvania
- 62 Landlord-Friendly · EVEN
- County
- — inherits STATE
- City
- — inherits STATE
ZIP-level market 18634
- Home prices YoY
- -29.1%
- Active inventory
- 59
- Price-to-rent
- 5.9×
Monthly cashflow live
- Estimated rent
- $1,262 high interval (Pro) →
- Mortgage (P&I)
- −$471
- Tax from tax record
- −$103 /mo · $1,237/yr
- Insurance
- −$37
- Flood insurance flood zone
- −$66 /mo · $798/yr
- HOA
- −$0
- Vacancy / Maint / Mgmt
- −$265
- Net cashflow
- $319
Break-even live
UW: 25.0% down · 7.5% · 30yr · 1.5% tax · 5.0% vac · 8.0% maint · 8.0% mgmt
Financing live
Cash to close
- Down payment
- $22,475
- Closing costs
- $2,697
- Reserves months
- —
- Total cash needed
- —
Loan-product check · same deal, 3 products live
Conventional
25% down · 7.5% · 30yr
- Down + closing
- —
- Monthly P&I
- —
- Monthly cashflow
- —
- DSCR
- —
- Eligible?
- —
Personal DTI + credit; lowest rate.
DSCR
20% down · 8.5% · 30yr
- Down + closing
- —
- Monthly P&I
- —
- Monthly cashflow
- —
- DSCR
- —
- Eligible?
- —
No personal income docs; deal must DSCR.
Hard money
10% down · 12.0% · 12mo
- Down + closing
- —
- Monthly P&I
- —
- Monthly cashflow
- —
- DSCR
- —
- Eligible?
- —
Short-term bridge; refi at stabilization.
Rent comps 11 comps
| Address | Beds | Baths | Sqft | Rent | $/sqft | DOM | Units | Dist |
|---|---|---|---|---|---|---|---|---|
| 222 Honey Pot St Nanticoke, PA | 2.0 | 1.0 | 1072 | $1,200 | $1.12 | 13d | 1 | 0.57mi |
| 277 E Spring St Nanticoke, PA | 2.0 | 1.0 | 726 | $1,100 | $1.52 | 13d | 1 | 0.88mi |
| 61 W Main St Nanticoke, PA | 3.0 | 1.0 | 1300 | $1,350 | $1.04 | 13d | 1 | 0.89mi |
| 293 State St Nanticoke, PA | 2.0 | 1.0 | 1014 | $1,200 | $1.18 | 13d | 1 | 0.93mi |
| 260 E Green St Nanticoke, PA | 3.0 | 1.5 | 1350 | $1,400 | $1.04 | 43d | 1 | 1.04mi |
| 117 E Green St Nanticoke, PA | 2.0 | 1.0 | 1000 | $1,500 | $1.50 | 13d | 1 | 1.07mi |
| 12 1/2 W Church St Nanticoke, PA | 2.0 | 1.0 | 1025 | $1,000 | $0.98 | 13d | 1 | 1.12mi |
| 39 W Ridge St Unit 3 Nanticoke, PA | 2.0 | 1.0 | 900 | $1,050 | $1.17 | 43d | 1 | 1.29mi |
| 39 W Ridge St Nanticoke, PA | 2.0 | 1.0 | 900 | $1,050 | $1.17 | 21d | 1 | 1.29mi |
| 121 E Grand St Nanticoke, PA | 3.0 | 1.5 | 1350 | $1,500 | $1.11 | 43d | 1 | 1.39mi |
| 710 S Hanover St Nanticoke, PA | 3.0 | 2.0 | 800 | $1,600 | $2.00 | 13d | 1 | 1.39mi |
Listing history 2 events
-
2026-04-24status Pending
-
2026-04-17$89,900 Active
ⓘ Source: listings_history table (triggers on properties + properties_extension) + one-shot
backfill from property_details.listing_events for pre-trigger history.
Tax reassessment forecast PA · Partial reset (capped growth)
- Current annual tax
- $1,237 · $103/mo
- Projected year-2 tax
- $1,328 · $111/mo
- Expected delta
- +$92/yr (+$8/mo · 7.4%)
ⓘ Screening estimate from a state-policy table — verify with the county assessor before closing.
Climate risk First Street
- Flood 9/10 Extreme FEMA zone X (shaded) · 99% chance over 30 yrs
- Wildfire 3/10 Moderate
- Heat 4/10 Moderate 8 d/yr ≥98°F today · 17 d/yr by 30 yrs out
- Wind 3/10 Moderate 5% chance of damaging wind over 30 yrs
- Air quality 1/10 Low 0 unhealthy d/yr today · 0 by 30 yrs out
Nearby sold comps map
Loading sold comps map…
Walkable amenities ~0.75 mi
Loading nearby amenities…
Taxation est. · year 1
- Rental income
- $15,147
- − Mortgage interest
- −$5,036
- − Property taxes
- −$1,237
- − Insurance
- −$1,247
- − Repairs & maintenance
- −$1,212
- − Management
- −$1,212
- − Depreciation
- −$2,615
- Taxable income
- $2,589
- Est. tax owed @ 24.0%
- −$621
- After-tax cash flow
- $3,204/yr
For passive investors: Depreciation is non-cash, so a rental often shows a tax loss while cash-flowing — sheltering income. Rental losses are passive: they offset passive income freely, and up to $25,000/yr can offset ordinary (W-2) income if you actively participate and your MAGI is under $100k (phasing out to $0 by $150k); unused losses carry forward. On sale, claimed depreciation is recaptured at up to 25%, and gains may owe capital-gains tax (a 1031 exchange can defer both). Figures are a year-1 estimate at your 24.0% rate — not tax advice; consult a CPA.
Schools (NCES district)
- District
- Greater Nanticoke Area SD
- NCES district ID
- 4216290
- Math proficiency
- 14% ▼ -8.00%
- Reading proficiency
- 34% ▼ -14.00%
- Median HH income
- $38,990
- Composite
- 20.1/100
- National rank
- #8647
- State rank
- #479 of 539 in PA
Livability — Plymouth
- Score
- 66/100
- State rank
- #1068
- US rank
- #12056
Category grades
Schools grade is shown separately in the Schools card above.
Census & demographics
- Census place
- West Nanticoke, PA
- Population (ZIP)
- 13,638
Population outlook (Luzerne County) Hauer SSP2
- Today (2025)
- 319,505 people
- By 2030
- 319,943 · +0.1%
- By 2040
- 322,643 · +1.0%
- By 2050
- 330,817 · +3.5%
- By 2075
- 379,145 · +18.7%
- By 2100
- 431,908 · +35.2%
Race, ethnicity, and origin ACS 2023
- Neighborhood character
- Predominantly White (82%)
- Race & ethnicity
- White 82% Hispanic / Latino 10% Two or more races 7% Black 6%
- Hispanic origin (detail)
- Mexican 2% Puerto Rican 3% Dominican 3%
- Common ancestry
- Romanian 31% Polish 3% Hispanic 2%
- Foreign-born
- 3% · Canada, Jamaica
- Languages at home
- 91% English-only · Spanish 7% French/Haitian/Cajun 2%
Political lean MEDSL · Luzerne
- 2024 margin
- R (+19.2) · D 40.0% · R 59.2%
- 2008→2024 swing
- -27.6pp toward R · 2008: 8.4pp · 2024: -19.2pp
- All cycles
- 2024: R+19.2 2020: R+14.4 2016: R+19.6 2012: D+4.8 2008: D+8.4
Not yet ingested
- Civics
- —
Market trends
- HPI YoY
- ▼ -101.20%
- Current HPI
- 246.8063
- Rent YoY
- —
- Metro
- —
- State GDP YoY
- ▲ 1.68%
- F500 in state
- 34
Industry mix (Fortune 500 HQ in PA)
| Industry | F500 HQs | Revenue |
|---|---|---|
| Healthcare | 2 | $309B |
|
||
| Insurance | 2 | $27B |
|
||
| Telecommunications / Media | 1 | $124B |
|
||
| Industrial Distribution | 1 | $22B |
|
||
| Financial Services | 1 | $20B |
|
||
| Chemicals / Materials | 1 | $18B |
|
||
Price history
2 events — show timeline
- 2026-04-24 Pending — LCAR
- 2026-04-17 Listed $89,900 LCAR
Property tax history
+1.5%/yrLatest (2026): $1,237 · +0.5% YoY. Source: county tax records.
Cash-flow waterfall
monthlySold comps — $/sqft
last 12 mo · ≤1 miLoading sold comps…