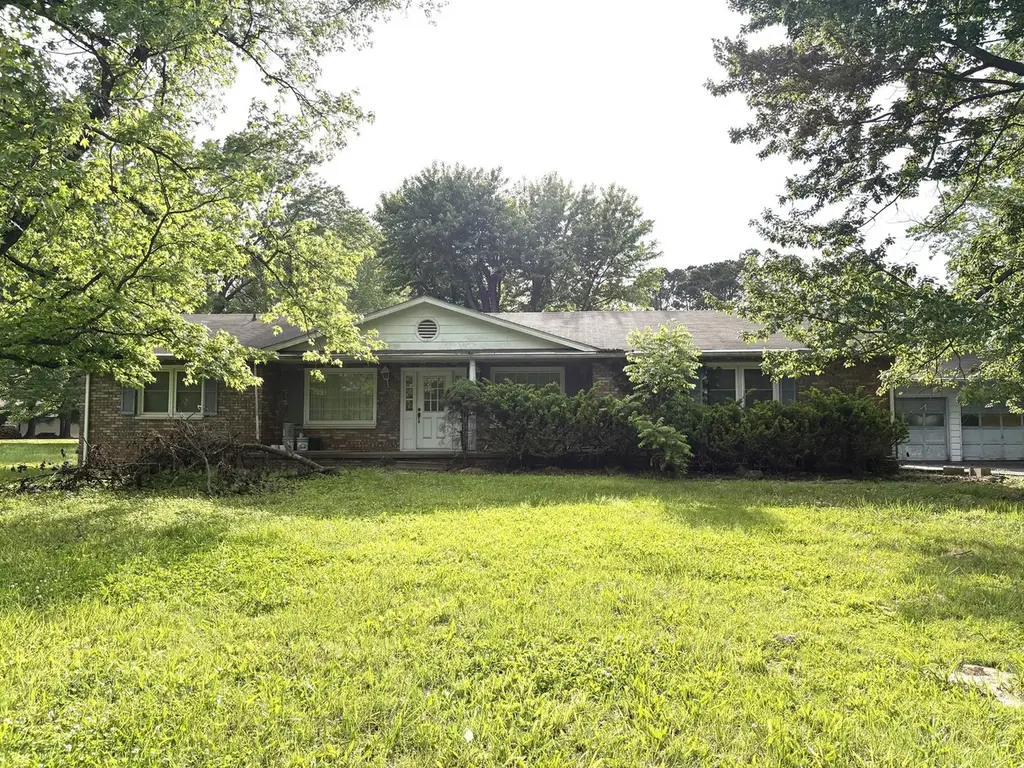
3917 Country Club Rd · Carbondale, IL
Flood risk 1/10 · Minimal
- FEMA flood zone
- X (unshaded)
- Chance of flooding over 30 yrs
- 0.0%
- Est. flood insurance / yr
- $507 – $1,088
Fire risk 1/10 · Minimal
- Est. fire insurance / yr
- $804 – $1,492
Heat risk 5/10 · Moderate
- Hot days now (above 107°F)
- 7 days/yr
- Hot days in 30 yrs
- 21 days/yr
Wind risk 2/10 · Minimal
- Chance of severe wind over 30 yrs
- 2.0%
Air-quality risk 2/10 · Minimal
- Unhealthy air days now
- 0 days/yr
- Unhealthy air days in 30 yrs
- 1 days/yr
Risk factors via First Street. Map © Google.
Why this score? — see what drove the D grade
The composite is a weighted blend of 9 inputs, each scored 0–100. Each bar is that input's sub-score; the figure is the points it added to the 100-point composite (weight × sub-score).
- Cash flow +12.0/30.0
- ARV discount +7.5/15.0
- 1% rule +5.8/10.0
- DSCR +3.6/10.0
- Rent growth +3.6/5.0
- Livability +3.5/5.0
- Condition / age +2.5/5.0
- Schools +2.4/10.0
- Appreciation +0.0/10.0
$109,000
🖨 Deal sheet 📄 Offer letter ✓ Due diligence
Key facts
- 0.93 acre lot
- 2 garage spots
- Pool
Property features AI
Finance
- Other: Lot size approximately 0.5–0.99 acre (dimensions 280 x 147); Listed possession at closing
- HOA & community: No master association fee required; Paved streets
Exterior
- Parking: Attached garage (owned) with 2 garage spaces; Asphalt parking
- Utilities: Public water; Public sewer
- Home design: Detached single-family home; One-story design; Fee simple ownership; School bus service available
- Construction: Built approximately 51–60 years ago; Aluminum siding and brick exterior; Asphalt roof; Block foundation
- Exterior features: In-ground pool; Patio and porch; Partial wood fencing; Corner lot with mature trees and level terrain
Interior
- Kitchen: Cooktop; Oven; Dishwasher; Refrigerator; Kitchen on main level (approx. 13 x 10)
- Bedrooms: 4 bedrooms, all on the main level; Master bedroom with shower-only bath (main level); Bedroom sizes include 16 x 14, 11 x 10, and 10 x 10
- Flooring: Carpet in living areas and bedrooms; Vinyl in kitchen and laundry
- Bathrooms: 3 full bathrooms; 1 half bathroom
- Heating & cooling: Natural gas forced-air heating; Central air conditioning
- Interior features: 9 total rooms; Drapes and window treatments; Wood-burning fireplace in the family room; Heated sun room (main level)
- Laundry & utility: Main-level laundry (approx. 9 x 7)
Neighborhood map
What this means for you Summary
Snapshot
- This is a 4-bed/3.5-bath other listed at $109k.
Deal economics
- At list price, monthly cash flow is $-25 ($-303/yr) — negative.
- To cash-flow at today's rent, offer at most $105k (4.1% below list).
- Meets the 1% rule at list price ($1k rent vs $109k).
- Recommended offer: $105k (4.1% below list) — sets the bar for cash-flow.
- Cap rate 6.0% vs local median 4.9% in Carbondale — meaningfully above typical; check what's discounted (condition, days-on-market, listing class) to confirm the premium yield is real.
Location & tenants
- Location reads 70/100 on livability (#375 in IL) — a middle-class / working-renter tenant base. Strengths: amenities A+, commute A+, cost of living A+; Watch: housing C-, crime F, employment F.
- Carbondale Chsd 165 (urban): math 26% / reading 35% proficiency, ranked #279 of 620 in IL (top 45%) — families likely to look elsewhere, expect single-tenant / working-renter base with shorter leases.
- Zoned schools: Carbondale Comm H S (math 26% / reading 35%, grade F, #175 of 693 statewide, top 26%, 997 students, 0% FRL).
- Market conditions: Rents rising fast (+4.5%/yr); 202 active listings in the ZIP; lower-income renter base — watch delinquency; 5 units permitted in Jackson County in 2024 (0 in 5+ unit buildings).
- This rent runs 40% of the median local income ($35k/yr) — at the standard rent-burdened threshold; future hikes will face affordability resistance.
Forward outlook
- Local home prices are declining (-3.0%/yr); year-one equity from $754 of loan paydown is wiped out by about $3k of value loss. Plan a longer hold.
Negotiation context
- It's been on market 43 days — a 3% lower offer ($106k) is reasonable based on typical stale-listing flexibility.
Risks & watch-outs
- Watch-outs: property tax is 3.7% of price.
- Climate carrying-cost: extreme-heat days projected 7→21/yr by 2055 (HVAC capex compounding) — expect insurance premiums to compound above CPI over the hold.
Questions for the listing agent
- What do current leases actually rent for vs. the listed asking? Can we see a recent rent roll and the last 12 months of T-12 income?
- It's been on market 43 days. Have you received any prior offers? Is the seller open to a 4% concession, seller financing, or rate buy-down credit?
- Built in 1966 — when were the roof, HVAC, electrical panel, plumbing, and water heater last replaced?
- Property tax is high relative to price — has the assessment been appealed recently, and will the sale trigger a re-assessment?
- Is there a deadline driving the sale (1031 exchange, divorce, estate, relocation)? That informs how much negotiation room exists.
- Schools are D-rated, which usually means shorter tenancies and higher turnover. Who's the typical renter profile here, and what's been the actual vacancy rate?
- Crime grade is F in this area — have there been break-ins, vandalism, or insurance claims at this property in the last 3 years? What carrier currently insures it and at what premium?
- The area grade is low — what's the realistic commute time and amenity access for the typical tenant pool here? Any planned neighborhood developments (good or bad) we should know about?
- What's the average days-on-market for RENTAL listings here right now (not sales)? A rising rental-DOM trend means longer vacancies and softer asking-rent achievability than the comps imply.
- What's the recent tenant-quality profile in this submarket — average credit score on applications, eviction rate, late-payment / NSF rate, and stable-employment percentage? A property-management company in the area should have these aggregated.
- How much new for-sale + rental construction is in the pipeline within 1–3 miles? Heavy new supply typically softens prices + rents 12–24 months out; constrained supply supports both.
Investment metrics
- 1% rule
- 1.08% ✓
- Cap rate
- 6.02%
- Cash-on-cash
- -0.99%
- DSCR
- 0.96
- GRM
- 7.7
CMA / ARV
No comps found within radius.
Projected returns pro-forma
-3.0% appreciation · 4.51% rent growth · sell at horizon
- IRR
- -15.6%
- Equity multiple
- 0.43×
- Total profit
- $-17,307
- Equity at exit
- $16,252
- IRR
- -4.0%
- Equity multiple
- 0.71×
- Total profit
- $-8,861
- Equity at exit
- $9,424
Cash invested: $30,520 (down + closing). Projections, not guarantees.
Landlord ↔ Tenant lean methodology
- Overall (STATE)
- 43 Moderately Tenant-Leaning
- State Illinois
- 43 Moderately Tenant-Leaning · D+7
- County
- — inherits STATE
- City
- — inherits STATE
ZIP-level market 62901
- Rents YoY
- 4.5%
- Active inventory
- 202
- Price-to-rent
- 7.7×
Monthly cashflow live
- Estimated rent
- $1,179 medium interval (Pro) →
- Mortgage (P&I)
- −$572
- Tax from tax record
- −$340 /mo · $4,080/yr
- Insurance
- −$45
- HOA
- −$0
- Vacancy / Maint / Mgmt
- −$248
- Net cashflow
- $-25
Break-even live
UW: 25.0% down · 7.5% · 30yr · 1.5% tax · 5.0% vac · 8.0% maint · 8.0% mgmt
Financing live
Cash to close
- Down payment
- $27,250
- Closing costs
- $3,270
- Reserves months
- —
- Total cash needed
- —
Loan-product check · same deal, 3 products live
Conventional
25% down · 7.5% · 30yr
- Down + closing
- —
- Monthly P&I
- —
- Monthly cashflow
- —
- DSCR
- —
- Eligible?
- —
Personal DTI + credit; lowest rate.
DSCR
20% down · 8.5% · 30yr
- Down + closing
- —
- Monthly P&I
- —
- Monthly cashflow
- —
- DSCR
- —
- Eligible?
- —
No personal income docs; deal must DSCR.
Hard money
10% down · 12.0% · 12mo
- Down + closing
- —
- Monthly P&I
- —
- Monthly cashflow
- —
- DSCR
- —
- Eligible?
- —
Short-term bridge; refi at stabilization.
Listing history 15 events
-
2026-06-19days on market $109,000 Active 43 DOM
-
2026-06-18days on market $109,000 Active 42 DOM
-
2026-06-17days on market $109,000 Active 41 DOM
-
2026-06-16days on market $109,000 Active 40 DOM
-
2026-06-15days on market $109,000 Active 39 DOM
-
2026-06-14days on market $109,000 Active 37 DOM
-
2026-06-13pricedays on market $109,000 Active 36 DOM
-
2026-06-10days on market $129,999 Active 34 DOM
-
2026-06-09days on market $129,999 Active 33 DOM
-
2026-06-08days on market $129,999 Active 32 DOM
-
2026-06-07days on market $129,999 Active 31 DOM
-
2026-06-02days on market $129,999 Active 26 DOM
-
2026-06-01days on market $129,999 Active 25 DOM
-
2026-05-31days on market $129,999 Active 24 DOM
-
2026-05-30days on market $129,999 Active 23 DOM
ⓘ Source: listings_history table (triggers on properties + properties_extension) + one-shot
backfill from property_details.listing_events for pre-trigger history.
Tax reassessment forecast IL · Partial reset (capped growth)
- Current annual tax
- $4,080 · $340/mo
- Projected year-2 tax
- $4,080 · $340/mo
- Expected delta
- $0/yr ($0/mo · 0.0%)
ⓘ Screening estimate from a state-policy table — verify with the county assessor before closing.
Climate risk First Street
- Flood 1/10 Low FEMA zone X (unshaded) · 0% chance over 30 yrs
- Wildfire 1/10 Low
- Heat 5/10 Major 7 d/yr ≥107°F today · 21 d/yr by 30 yrs out
- Wind 2/10 Low 2% chance of damaging wind over 30 yrs
- Air quality 2/10 Low 0 unhealthy d/yr today · 1 by 30 yrs out
Nearby sold comps map
Loading sold comps map…
Walkable amenities ~0.75 mi
Loading nearby amenities…
Taxation est. · year 1
- Rental income
- $14,154
- − Mortgage interest
- −$6,106
- − Property taxes
- −$4,080
- − Insurance
- −$545
- − Repairs & maintenance
- −$1,132
- − Management
- −$1,132
- − Depreciation
- −$3,171
- Taxable loss
- −$2,012
- Est. tax savings @ 24.0%
- +$483
- After-tax cash flow
- $180/yr
For passive investors: Depreciation is non-cash, so a rental often shows a tax loss while cash-flowing — sheltering income. Rental losses are passive: they offset passive income freely, and up to $25,000/yr can offset ordinary (W-2) income if you actively participate and your MAGI is under $100k (phasing out to $0 by $150k); unused losses carry forward. On sale, claimed depreciation is recaptured at up to 25%, and gains may owe capital-gains tax (a 1031 exchange can defer both). Figures are a year-1 estimate at your 24.0% rate — not tax advice; consult a CPA.
Schools (NCES district)
- District
- Carbondale Chsd 165
- NCES district ID
- 1708370
- Math proficiency
- 26% ▼ -10.00%
- Reading proficiency
- 35% ▼ -2.00%
- Median HH income
- $22,075
- Composite
- 23.92/100
- National rank
- #7787
- State rank
- #279 of 620 in IL
Livability — Carbondale
- Score
- 70/100
- State rank
- #375
- US rank
- #7806
Category grades
Schools grade is shown separately in the Schools card above.
Census & demographics
- County
- Jackson County · 22,946 people
- City population
- 22,946
- Metro
- Carbondale-Marion, IL
- Population (ZIP)
- 22,946
- Household income
- $35,089
- Rent vs Own
- Severe rent burden
- 2038.0
Population outlook (Jackson County) Hauer SSP2
- Today (2025)
- 59,093 people
- By 2030
- 59,628 · +0.9%
- By 2040
- 59,495 · +0.7%
- By 2050
- 58,811 · -0.5%
- By 2075
- 57,683 · -2.4%
- By 2100
- 55,337 · -6.4%
Race, ethnicity, and origin ACS 2023
- Neighborhood character
- Diverse neighborhood (Simpson 0.58)
- Race & ethnicity
- White 59% Black 26% Asian 6% Hispanic / Latino 5% Two or more races 5%
- Hispanic origin (detail)
- Mexican 4%
- Common ancestry
- Romanian 2% Italian 2% Slovak 2%
- Foreign-born
- 9% · Canada, China, South Korea
- Languages at home
- 87% English-only · Other Indo-European 4% Spanish 4% Arabic 2%
Political lean MEDSL · Jackson
- 2024 margin
- Toss-up / Even · D 51.0% · R 47.5% · Other 1.4%
- 2008→2024 swing
- -18.3pp toward R · 2008: 21.8pp · 2024: 3.5pp
- All cycles
- 2024: D+3.5 2020: D+1.3 2016: D+3.0 2012: D+10.3 2008: D+21.8
Not yet ingested
- Civics
- —
Market trends
- HPI YoY
- ▼ -75.62%
- Current HPI
- 88.7209
- Rent YoY
- ▲ 4.51%
- Metro
- Carbondale-Marion, IL
- State GDP YoY
- ▲ 1.59%
- F500 in state
- 60
Industry mix (Fortune 500 HQ in IL)
| Industry | F500 HQs | Revenue |
|---|---|---|
| Insurance | 4 | $201B |
|
||
| Consumer Goods | 4 | $87B |
|
||
| Industrial Machinery | 3 | $64B |
|
||
| Healthcare | 2 | $55B |
|
||
| Retail / Pharmacy | 1 | $148B |
|
||
| Agriculture / Food | 1 | $86B |
|
||
Property tax history
+6.8%/yrLatest (2024): $4,080 · +8.5% YoY. Source: county tax records.
Cash-flow waterfall
monthlySold comps — $/sqft
last 12 mo · ≤1 miLoading sold comps…