822 E Fannin St · La Grange, TX
Flood risk No data
- FEMA flood zone
- —
- Chance of flooding over 30 yrs
- —
- Est. flood insurance / yr
- —
Fire risk No data
- Est. fire insurance / yr
- —
Heat risk No data
- Hot days now (above threshold)
- —
- Hot days in 30 yrs
- —
Wind risk No data
- Chance of severe wind over 30 yrs
- —
Air-quality risk No data
- Unhealthy air days now
- —
- Unhealthy air days in 30 yrs
- —
Risk factors via First Street. Map © Google.
Why this score? — see what drove the D- grade
The composite is a weighted blend of 9 inputs, each scored 0–100. Each bar is that input's sub-score; the figure is the points it added to the 100-point composite (weight × sub-score).
- Cash flow +13.4/30.0
- ARV discount +7.5/15.0
- DSCR +4.0/10.0
- Schools +3.7/10.0
- Livability +3.1/5.0
- 1% rule +3.0/10.0
- Rent growth +2.5/5.0
- Condition / age +2.5/5.0
- Appreciation +0.0/10.0
$199,000
🖨 Deal sheet (PDF) 📄 Offer letter ✓ Due diligence
Listing remarks
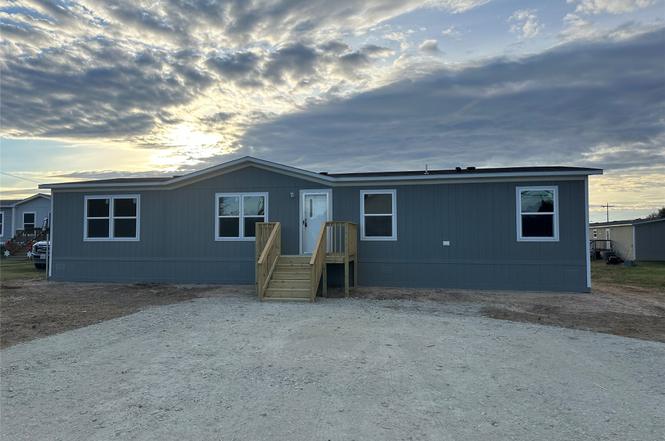
Welcome to 822 E Fannin Street in La Grange! This 2023 manufactured home offers a spacious 4-bedroom, 2-bath layout on an oversized lot, giving buyers room to enjoy outdoor space while still being close to the conveniences of town. The floor plan is designed for everyday living with a comfortable living room, separate den, open kitchen with island, utility area, and a private primary bedroom suite. The additional bedrooms provide flexibility for family, guests, office space, or hobbies. Located in the heart of La Grange, this property offers small-town charm with quick access to local schools, shopping, restaurants, downtown, parks, and major roadways. Whether you are looking for a primary
Key facts
- Oversized lot
- 9,347 sq ft lot
- Built 2023
Tags
Property features AI
Finance
- Financial info: Lease considered
Exterior
- Utilities: Public water; Public sewer
- Home design: Residential property; Single-story entry level
- Construction: Built in 2023; Cement siding; Composition roof
- Exterior features: Cleared lot
Interior
- Bedrooms: First-floor bedrooms: three 9x12 bedrooms and one 14x12 bedroom
- Bathrooms: 2 full bathrooms
- Heating & cooling: Central heating (electric); Central air conditioning (electric)
- Interior features: 4 total rooms
Neighborhood map
What this means for you Summary
Snapshot
- This is a 4-bed/2.0-bath manufactured listed at $199k.
Deal economics
- At list price, monthly cash flow is $5 ($55/yr) — positive.
- The deal already cash-flows at list — no discount required.
- To meet the 1% rule (rent ≥ 1% of price), the offer needs to be $159k (20.1% below list).
- Recommended offer: $159k (20.1% below list) — sets the bar for 1% rule.
- Cap rate 6.3% vs local median 1.6% in La Grange — top-decile yield for the area; either an underpriced asset or a hidden risk that comps aren't pricing in. Stress-test before assuming the spread holds.
Location & tenants
- Location reads 62/100 on livability (#920 in TX) — a middle-class / working-renter tenant base. Strengths: cost of living A+, housing A+; Watch: amenities F, commute F, employment F.
- La Grange ISD (town): math 43% / reading 43% proficiency, ranked #300 of 826 in TX (top 36%) — families likely to look elsewhere, expect single-tenant / working-renter base with shorter leases.
- Zoned schools: La Grange El (math 31% / reading 34%, grade F, #2,234 of 4,322 statewide, top 52%, 998 students, 62% FRL); La Grange Middle (math 59% / reading 55%, grade B, #212 of 1,662 statewide, top 13%, 300 students, 52% FRL); La Grange H S (math 57% / reading 52%, grade C-, #379 of 1,632 statewide, top 26%, 585 students, 53% FRL).
- Market conditions: 174 active listings in the ZIP; 23 units permitted in Fayette County in 2024 (0 in 5+ unit buildings).
Forward outlook
- Local home prices are declining (-3.0%/yr); year-one equity from $1k of loan paydown is wiped out by about $6k of value loss. Plan a longer hold.
- Fayette County population projected at +9% by 2050 — modest demand growth; plan on rents tracking national, not racing it.
Negotiation context
- Only 5 days on market — expect competitive offers; lowballing is unlikely to land.
- 2 sale attempts since 2y ago with the ask held roughly flat each time — persistent listings suggest the price (not the market) is what's stuck; bring a comps-based counter.
Questions for the listing agent
- Is there a deadline driving the sale (1031 exchange, divorce, estate, relocation)? That informs how much negotiation room exists.
- Schools are D-rated, which usually means shorter tenancies and higher turnover. Who's the typical renter profile here, and what's been the actual vacancy rate?
- The area grade is low — what's the realistic commute time and amenity access for the typical tenant pool here? Any planned neighborhood developments (good or bad) we should know about?
- What's the average days-on-market for RENTAL listings here right now (not sales)? A rising rental-DOM trend means longer vacancies and softer asking-rent achievability than the comps imply.
- What's the recent tenant-quality profile in this submarket — average credit score on applications, eviction rate, late-payment / NSF rate, and stable-employment percentage? A property-management company in the area should have these aggregated.
- How much new for-sale + rental construction is in the pipeline within 1–3 miles? Heavy new supply typically softens prices + rents 12–24 months out; constrained supply supports both.
Investment metrics
- 1% rule
- 0.80% ✗
- Cap rate
- 6.32%
- Cash-on-cash
- 0.10%
- DSCR
- 1.00
- GRM
- 10.4
CMA / ARV
No comps found within radius.
Projected returns pro-forma
-3.0% appreciation · 3.0% rent growth · sell at horizon
- IRR
- -16.2%
- Equity multiple
- 0.43×
- Total profit
- $-32,007
- Equity at exit
- $29,672
- IRR
- -7.9%
- Equity multiple
- 0.50×
- Total profit
- $-27,708
- Equity at exit
- $17,206
Cash invested: $55,720 (down + closing). Projections, not guarantees.
Landlord ↔ Tenant lean methodology
- Overall (STATE)
- 87 Strongly Landlord-Friendly
- State Texas
- 87 Strongly Landlord-Friendly · R+5
- County
- — inherits STATE
- City
- — inherits STATE
ZIP-level market 78945
- Home prices YoY
- -32.0%
- Active inventory
- 174
- Price-to-rent
- 10.4×
Monthly cashflow live
- Estimated rent
- $1,590 medium interval (Pro) →
- Mortgage (P&I)
- −$1,044
- Tax from tax record
- −$125 /mo · $1,497/yr
- Insurance
- −$83
- HOA
- −$0
- Vacancy / Maint / Mgmt
- −$334
- Net cashflow
- $5
Break-even live
Sensitivity live
| Price | -10% $117 | -5% $61 | +0% $5 | +5% $-52 | +10% $-108 |
|---|---|---|---|---|---|
| Rent | -10% $-121 | -5% $-58 | +0% $5 | +5% $67 | +10% $130 |
| Rate | -1.0pp $105 | -0.5pp $55 | base $5 | +0.5pp $-47 | +1.0pp $-99 |
UW: 25.0% down · 7.5% · 30yr · 1.5% tax · 5.0% vac · 8.0% maint · 8.0% mgmt
Financing live
Cash to close
- Down payment
- $49,750
- Closing costs
- $5,970
- Reserves months
- —
- Total cash needed
- —
Loan-product check · same deal, 3 products live
Conventional
25% down · 7.5% · 30yr
- Down + closing
- —
- Monthly P&I
- —
- Monthly cashflow
- —
- DSCR
- —
- Eligible?
- —
Personal DTI + credit; lowest rate.
DSCR
20% down · 8.5% · 30yr
- Down + closing
- —
- Monthly P&I
- —
- Monthly cashflow
- —
- DSCR
- —
- Eligible?
- —
No personal income docs; deal must DSCR.
Hard money
10% down · 12.0% · 12mo
- Down + closing
- —
- Monthly P&I
- —
- Monthly cashflow
- —
- DSCR
- —
- Eligible?
- —
Short-term bridge; refi at stabilization.
Listing history 5 events
-
2026-06-21days on market $199,000 Active 5 DOM
-
2026-06-21days on market $199,000 Active 4 DOM
-
2026-06-18days on market $199,000 Active 2 DOM
-
2026-06-17remarks 699-char remark
-
2026-06-17$199,000 Active 1 DOM
ⓘ Source: listings_history table (triggers on properties + properties_extension) + one-shot
backfill from property_details.listing_events for pre-trigger history.
Tax reassessment forecast TX · Resets to sale price
- Current annual tax
- $1,497 · $125/mo
- Projected year-2 tax
- $3,642 · $303/mo
- Expected delta
- +$2,145/yr (+$179/mo · 143.2%)
ⓘ Screening estimate from a state-policy table — verify with the county assessor before closing.
Nearby sold comps map
Loading sold comps map…
Walkable amenities ~0.75 mi
Loading nearby amenities…
Taxation est. · year 1
- Rental income
- $19,076
- − Mortgage interest
- −$11,147
- − Property taxes
- −$1,497
- − Insurance
- −$995
- − Repairs & maintenance
- −$1,526
- − Management
- −$1,526
- − Depreciation
- −$5,789
- Taxable loss
- −$3,405
- Est. tax savings @ 24.0%
- +$817
- After-tax cash flow
- $872/yr
For passive investors: Depreciation is non-cash, so a rental often shows a tax loss while cash-flowing — sheltering income. Rental losses are passive: they offset passive income freely, and up to $25,000/yr can offset ordinary (W-2) income if you actively participate and your MAGI is under $100k (phasing out to $0 by $150k); unused losses carry forward. On sale, claimed depreciation is recaptured at up to 25%, and gains may owe capital-gains tax (a 1031 exchange can defer both). Figures are a year-1 estimate at your 24.0% rate — not tax advice; consult a CPA.
Schools (NCES district)
- District
- La Grange ISD
- NCES district ID
- 4826100
- Math proficiency
- 43% ▼ -11.00%
- Reading proficiency
- 43% ▼ -2.00%
- Median HH income
- $51,243
- Composite
- 37.11/100
- National rank
- #4494
- State rank
- #300 of 826 in TX
Livability — La Grange
- Score
- 62/100
- State rank
- #920
- US rank
- #16400
Category grades
Schools grade is shown separately in the Schools card above.
Census & demographics
- Census place
- La Grange, TX
- Population (ZIP)
- 10,459
Population outlook (Fayette County) Hauer SSP2
- Today (2025)
- 26,343 people
- By 2030
- 26,940 · +2.3%
- By 2040
- 27,898 · +5.9%
- By 2050
- 28,623 · +8.7%
- By 2075
- 31,155 · +18.3%
- By 2100
- 31,557 · +19.8%
Race, ethnicity, and origin ACS 2023
- Neighborhood character
- Predominantly White (72%)
- Race & ethnicity
- White 72% Hispanic / Latino 19% Two or more races 7% Black 5%
- Hispanic origin (detail)
- Mexican 19%
- Common ancestry
- Slovak 2% Hungarian 1% Lithuanian 1%
- Foreign-born
- 7% · Canada
- Languages at home
- 84% English-only · Spanish 13% French/Haitian/Cajun 1% German/W. Germanic 1%
Political lean MEDSL · Fayette
- 2024 margin
- Solid R (+61.4) · D 18.9% · R 80.3%
- 2008→2024 swing
- -18.8pp toward R · 2008: -42.6pp · 2024: -61.4pp
- All cycles
- 2024: R+61.4 2020: R+58.0 2016: R+59.1 2012: R+54.9 2008: R+42.6
Not yet ingested
- Civics
- —
Market trends
- HPI YoY
- ▼ -102.88%
- Current HPI
- 218.7015
- Rent YoY
- —
- Metro
- —
- State GDP YoY
- ▲ 3.95%
- F500 in state
- 110
Industry mix (Fortune 500 HQ in TX)
| Industry | F500 HQs | Revenue |
|---|---|---|
| Energy | 16 | $1,198B |
|
||
| Technology | 5 | $198B |
|
||
| Engineering / Construction | 4 | $72B |
|
||
| Energy Services | 3 | $60B |
|
||
| Utilities | 3 | $41B |
|
||
| Healthcare | 2 | $330B |
|
||
Price history
4 events — show timeline
- 2026-06-16 Listed $199,000 HARMLS
- 2025-01-15 Price Changed — Unlock MLS
- 2024-12-03 Price Changed — Unlock MLS
- 2024-10-22 Listed — Unlock MLS
Property tax history
+50.6%/yrLatest (2025): $1,497 · +293.3% YoY. Source: county tax records.
Cash-flow waterfall
monthlySold comps — $/sqft
last 12 mo · ≤1 miLoading sold comps…