13940 Meda Dr #96 · Alta Sierra, CA
Flood risk 1/10 · Minimal
- FEMA flood zone
- X (unshaded)
- Chance of flooding over 30 yrs
- 0.0%
- Est. flood insurance / yr
- $507 – $1,088
Fire risk 9/10 · Severe
- Est. fire insurance / yr
- $659 – $1,223
Heat risk 5/10 · Moderate
- Hot days now (above 96°F)
- 7 days/yr
- Hot days in 30 yrs
- 17 days/yr
Wind risk 1/10 · Minimal
- Chance of severe wind over 30 yrs
- —
Air-quality risk 10/10 · Severe
- Unhealthy air days now
- 33 days/yr
- Unhealthy air days in 30 yrs
- 40 days/yr
Risk factors via First Street. Map © Google.
Why this score? — see what drove the D+ grade
The composite is a weighted blend of 9 inputs, each scored 0–100. Each bar is that input's sub-score; the figure is the points it added to the 100-point composite (weight × sub-score).
- Cash flow +19.5/30.0
- 1% rule +10.0/10.0
- DSCR +6.2/10.0
- Schools +3.7/10.0
- Livability +3.0/5.0
- Rent growth +2.5/5.0
- Condition / age +2.5/5.0
- ARV discount +0.0/15.0
- Appreciation +0.0/10.0
$72,000
🖨 Deal sheet 📄 Offer letter ✓ Due diligence
Listing remarks
Welcome to Tall Pines Mobile Home Park, one of the few all-ages mobile home communities in Grass Valley offering comfortable and affordable living in a convenient location. If you've been searching for a move-in ready 2 bedroom, 2 bath manufactured home with privacy, outdoor space, and easy Highway 49 access, this one checks the boxes. Situated on a desirable corner lot, this well-maintained single-wide home features a smart split-bedroom floor plan with bedrooms located on opposite ends, ideal for families, guests, or roommates who appreciate separation of space. The open-concept living area feels bright and inviting, and the freestanding wood stove adds cozy Sierra foothill charm during t
Key facts
- New carpet
- New interior paint
- Corner lot
Tags
Property features AI
Finance
- Other: Address: 13940 Meda Dr #96, Grass Valley, CA 95949; Directions available to property
- HOA & community: Mandatory association with monthly fee; Monthly association fee of $1,095 includes grounds maintenance; Community amenities: pool, clubhouse, guest parking
Exterior
- Parking: Off-street parking; Attached covered parking
- Utilities: Propane; Gas plumbed; Internet available; Private water; Septic system
- Home design: Manufactured home in park (single wide); Built in 1988
- Construction: Wood skirting; Composition roof; Manufactured by Skyline (Knollwood model)
- Exterior features: Storage shed(s); Close to clubhouse; Corner lot with front yard; Garden
Interior
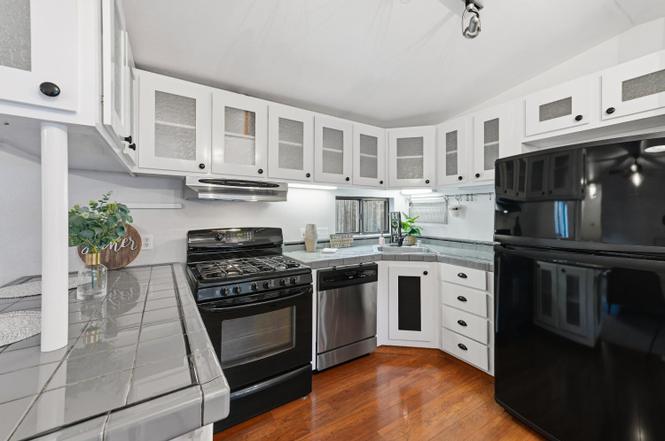
- Kitchen: Free-standing gas range; Free-standing refrigerator; Range hood; Dishwasher; Garbage disposal; Microwave; Ceramic, stone and laminate counters; Dining space in kitchen
- Bedrooms: 2 bedrooms
- Flooring: Carpet; Laminate; Wood
- Bathrooms: 2 full bathrooms; Tubs with shower over
- Heating & cooling: Central heating; Propane heating; Wood stove heating; Ceiling fans; Evaporative cooler
- Interior features: One wood-burning free-standing wood stove; Cathedral/vaulted great room; Porch with steps and railing; Uncovered deck; Storage area (interior access); Pets allowed (cats and dogs; number limit)
- Laundry & utility: Laundry closet inside; 220V in laundry
Neighborhood map
What this means for you Summary
Snapshot
- This is a 2-bed/2.0-bath manufactured listed at $72k.
Deal economics
- At list price, monthly cash flow is $81 ($978/yr) — positive.
- The deal already cash-flows at list — no discount required.
- Meets the 1% rule at list price ($2k rent vs $72k).
- Recommended offer: $63k (12.0% below list) — sets the bar for market timing.
- Cap rate 7.7% vs local median 3.4% in Alta Sierra — top-decile yield for the area; either an underpriced asset or a hidden risk that comps aren't pricing in. Stress-test before assuming the spread holds.
Location & tenants
- Location reads 59/100 on livability (#662 in CA) — a working-class tenant base; expect higher turnover. Strengths: employment A+, housing A+; Watch: crime C-, schools D+, amenities F.
- Pleasant Ridge Union Elementary (rural): math 33% / reading 49% proficiency, ranked #214 of 517 in CA (top 41%) — families likely to look elsewhere, expect single-tenant / working-renter base with shorter leases.
- Market conditions: 252 active listings in the ZIP; solid renter incomes; 215 units permitted in Nevada County in 2024 (0 in 5+ unit buildings).
Forward outlook
- Local home prices are declining (-3.0%/yr); year-one equity from $498 of loan paydown is wiped out by about $2k of value loss. Plan a longer hold.
- Nevada County population projected at -14% by 2050 — secular population decline; favor cash flow + early exit over multi-decade hold.
Negotiation context
- It's been on market 172 days — a 12% lower offer ($63k) is reasonable based on typical stale-listing flexibility.
Risks & watch-outs
- Watch-outs: HOA is 54% of rent.
- Climate carrying-cost: severe wildfire risk; extreme-heat days projected 7→17/yr by 2055 (HVAC capex compounding) — expect insurance premiums to compound above CPI over the hold.
Questions for the listing agent
- It's been on market 172 days. Have you received any prior offers? Is the seller open to a 12% concession, seller financing, or rate buy-down credit?
- What does the HOA fee cover, when was the last increase, and are there any pending special assessments or reserve-fund shortfalls?
- Why hasn't it sold? Are there any deal-killer items the seller is aware of (foundation, flood, title, zoning, code violations)?
- Is there a deadline driving the sale (1031 exchange, divorce, estate, relocation)? That informs how much negotiation room exists.
- Schools are D-rated, which usually means shorter tenancies and higher turnover. Who's the typical renter profile here, and what's been the actual vacancy rate?
- The area grade is low — what's the realistic commute time and amenity access for the typical tenant pool here? Any planned neighborhood developments (good or bad) we should know about?
- What's the average days-on-market for RENTAL listings here right now (not sales)? A rising rental-DOM trend means longer vacancies and softer asking-rent achievability than the comps imply.
- What's the recent tenant-quality profile in this submarket — average credit score on applications, eviction rate, late-payment / NSF rate, and stable-employment percentage? A property-management company in the area should have these aggregated.
- How much new for-sale + rental construction is in the pipeline within 1–3 miles? Heavy new supply typically softens prices + rents 12–24 months out; constrained supply supports both.
Investment metrics
- 1% rule
- 2.81% ✓
- Cap rate
- 7.65%
- Cash-on-cash
- 4.85%
- DSCR
- 1.22
- GRM
- 3.0
CMA / ARV
- ARV (on-the-fly)
- $60,060
- Comps found
- 5
Show comp detail 5 sales within ~0.75 mi
| Address | Dist | Beds/Ba | Sqft | Sold | Price | $/sf | Match |
|---|---|---|---|---|---|---|---|
| 14338 State Highway 49 #71 | 0.17mi | 2/1.0 | 860 (-7%) | 14mo | $67,500 | $78 | 65 |
| 13894 Golden Star Rd | 0.09mi | 3/2.0 (+1) | 1,056 (+14%) | 6mo | $44,000 | $42 | 62 |
| 14338 State Highway 49 #67 | 0.20mi | 2/1.0 | 1,062 (+15%) | 2mo | $54,900 | $52 | 60 |
| 14338 State Highway 49 #19 | 0.27mi | 2/1.0 | 800 (-13%) | 5mo | $52,000 | $65 | 57 |
| 14338 State Hwy 49 #51 | 0.27mi | 2/1.0 | 800 (-13%) | 22mo | $57,000 | $71 | 42 |
Match score weights: distance 35% · size 25% · config 20% · recency 20%. Top-matched comps best support the ARV.
Projected returns pro-forma
-3.0% appreciation · 3.0% rent growth · sell at horizon
- IRR
- -7.8%
- Equity multiple
- 0.71×
- Total profit
- $-5,822
- Equity at exit
- $10,735
- IRR
- 2.8%
- Equity multiple
- 1.21×
- Total profit
- $4,281
- Equity at exit
- $6,225
Cash invested: $20,160 (down + closing). Projections, not guarantees.
Landlord ↔ Tenant lean methodology
- Overall (STATE)
- 18 Strongly Tenant-Friendly
- State California
- 18 Strongly Tenant-Friendly · D+13
- County
- — inherits STATE
- City
- — inherits STATE
ZIP-level market 95949
- Home prices YoY
- -34.7%
- Active inventory
- 252
- Price-to-rent
- 3.0×
Monthly cashflow live
- Estimated rent
- $2,024 medium interval (Pro) →
- Mortgage (P&I)
- −$378
- Tax from tax record
- −$15 /mo · $175/yr
- Insurance
- −$30
- HOA
- −$1,095
- Vacancy / Maint / Mgmt
- −$425
- Net cashflow
- $81
Break-even live
UW: 25.0% down · 7.5% · 30yr · 1.5% tax · 5.0% vac · 8.0% maint · 8.0% mgmt
Financing live
Cash to close
- Down payment
- $18,000
- Closing costs
- $2,160
- Reserves months
- —
- Total cash needed
- —
Loan-product check · same deal, 3 products live
Conventional
25% down · 7.5% · 30yr
- Down + closing
- —
- Monthly P&I
- —
- Monthly cashflow
- —
- DSCR
- —
- Eligible?
- —
Personal DTI + credit; lowest rate.
DSCR
20% down · 8.5% · 30yr
- Down + closing
- —
- Monthly P&I
- —
- Monthly cashflow
- —
- DSCR
- —
- Eligible?
- —
No personal income docs; deal must DSCR.
Hard money
10% down · 12.0% · 12mo
- Down + closing
- —
- Monthly P&I
- —
- Monthly cashflow
- —
- DSCR
- —
- Eligible?
- —
Short-term bridge; refi at stabilization.
HOA detail
- Monthly dues
- $1,095 · $13,140/yr
Listing history 16 events
-
2026-06-19days on market $72,000 Active 172 DOM
-
2026-06-18days on market $72,000 Active 171 DOM
-
2026-06-17days on market $72,000 Active 170 DOM
-
2026-06-16days on market $72,000 Active 169 DOM
-
2026-06-15days on market $72,000 Active 168 DOM
-
2026-06-13days on market $72,000 Active 166 DOM
-
2026-06-13days on market $72,000 Active 165 DOM
-
2026-06-10days on market $72,000 Active 163 DOM
-
2026-06-09days on market $72,000 Active 162 DOM
-
2026-06-08days on market $72,000 Active 161 DOM
-
2026-06-07pricedays on market $72,000 Active 160 DOM
-
2026-06-05days on market $79,000 Active 157 DOM
-
2026-06-03days on market $79,000 Active 156 DOM
-
2026-06-02days on market $79,000 Active 155 DOM
-
2026-06-01days on market $79,000 Active 154 DOM
-
2026-05-31days on market $79,000 Active 153 DOM
ⓘ Source: listings_history table (triggers on properties + properties_extension) + one-shot
backfill from property_details.listing_events for pre-trigger history.
Tax reassessment forecast CA · Resets to sale price
- Current annual tax
- $175 · $15/mo
- Projected year-2 tax
- $547 · $46/mo
- Expected delta
- +$373/yr (+$31/mo · 213.3%)
ⓘ Screening estimate from a state-policy table — verify with the county assessor before closing.
Climate risk First Street
- Flood 1/10 Low FEMA zone X (unshaded) · 0% chance over 30 yrs
- Wildfire 9/10 Extreme
- Heat 5/10 Major 7 d/yr ≥96°F today · 17 d/yr by 30 yrs out
- Wind 1/10 Low
- Air quality 10/10 Extreme 33 unhealthy d/yr today · 40 by 30 yrs out
Nearby sold comps map
Loading sold comps map…
Walkable amenities ~0.75 mi
Loading nearby amenities…
Taxation est. · year 1
- Rental income
- $24,282
- − Mortgage interest
- −$4,033
- − Property taxes
- −$175
- − Insurance
- −$360
- − Repairs & maintenance
- −$1,943
- − Management
- −$1,943
- − HOA
- −$13,140
- − Depreciation
- −$2,095
- Taxable income
- $595
- Est. tax owed @ 24.0%
- −$143
- After-tax cash flow
- $835/yr
For passive investors: Depreciation is non-cash, so a rental often shows a tax loss while cash-flowing — sheltering income. Rental losses are passive: they offset passive income freely, and up to $25,000/yr can offset ordinary (W-2) income if you actively participate and your MAGI is under $100k (phasing out to $0 by $150k); unused losses carry forward. On sale, claimed depreciation is recaptured at up to 25%, and gains may owe capital-gains tax (a 1031 exchange can defer both). Figures are a year-1 estimate at your 24.0% rate — not tax advice; consult a CPA.
Schools (NCES district)
- District
- Pleasant Ridge Union Elementary
- NCES district ID
- 0630930
- Math proficiency
- 33% ▼ -6.00%
- Reading proficiency
- 49% ▬ 0.00%
- Median HH income
- $65,524
- Composite
- 36.75/100
- National rank
- #4580
- State rank
- #214 of 517 in CA
Livability — Alta Sierra
- Score
- 59/100
- State rank
- #662
- US rank
- #20497
Category grades
Schools grade is shown separately in the Schools card above.
Census & demographics
- County
- Nevada County · 85,339 people
- Metro
- Truckee-Grass Valley, CA
- Population (ZIP)
- 20,552
- Household income
- $98,181
- Rent vs Own
- Severe rent burden
- 181.0
Population outlook (Nevada County) Hauer SSP2
- Today (2025)
- 98,490 people
- By 2030
- 97,295 · -1.2%
- By 2040
- 92,041 · -6.5%
- By 2050
- 85,164 · -13.5%
- By 2075
- 68,436 · -30.5%
- By 2100
- 49,536 · -49.7%
Race, ethnicity, and origin ACS 2023
- Neighborhood character
- Predominantly White (84%)
- Race & ethnicity
- White 84% Hispanic / Latino 8% Two or more races 8% Native American 1%
- Hispanic origin (detail)
- Mexican 6%
- Common ancestry
- Lithuanian 4% Italian 4% Slovak 2%
- Foreign-born
- 4% · Canada
- Languages at home
- 94% English-only · Spanish 3% Other Indo-European 1%
Political lean MEDSL · Nevada
- 2024 margin
- D (+12.2) · D 54.4% · R 42.1% · Other 3.5%
- 2008→2024 swing
- +6.9pp toward D · 2008: 5.3pp · 2024: 12.2pp
- All cycles
- 2024: D+12.2 2020: D+14.8 2016: D+4.5 2012: R+4.7 2008: D+5.3
Not yet ingested
- Civics
- —
Market trends
- HPI YoY
- ▼ -122.41%
- Current HPI
- 230.2373
- Rent YoY
- —
- Metro
- Truckee-Grass Valley, CA
- State GDP YoY
- ▲ 3.21%
- F500 in state
- 116
Industry mix (Fortune 500 HQ in CA)
| Industry | F500 HQs | Revenue |
|---|---|---|
| Technology | 27 | $1,492B |
|
||
| Financial Services | 3 | $174B |
|
||
| Retail | 3 | $44B |
|
||
| Insurance | 3 | $26B |
|
||
| Media / Entertainment | 2 | $115B |
|
||
| Pharmaceuticals / Biotech | 2 | $62B |
|
||
Property tax history
+6.8%/yrLatest (2025): $175 · +0.2% YoY. Source: county tax records.
Cash-flow waterfall
monthlySold comps — $/sqft
last 12 mo · ≤1 miLoading sold comps…