5013 Radcliff St · Estelle, LA
Flood risk 8/10 · Major
- FEMA flood zone
- X
- Chance of flooding over 30 yrs
- 0.6%
- Est. flood insurance / yr
- $507 – $1,088
Fire risk 1/10 · Minimal
- Est. fire insurance / yr
- $1,269 – $2,357
Heat risk 10/10 · Severe
- Hot days now (above 108°F)
- 7 days/yr
- Hot days in 30 yrs
- 20 days/yr
Wind risk 10/10 · Severe
- Chance of severe wind over 30 yrs
- 99.0%
Air-quality risk 3/10 · Minor
- Unhealthy air days now
- 2 days/yr
- Unhealthy air days in 30 yrs
- 3 days/yr
Risk factors via First Street. Map © Google.
Why this score? — see what drove the C+ grade
The composite is a weighted blend of 9 inputs, each scored 0–100. Each bar is that input's sub-score; the figure is the points it added to the 100-point composite (weight × sub-score).
- Cash flow +24.6/30.0
- ARV discount +15.0/15.0
- DSCR +8.0/10.0
- 1% rule +6.0/10.0
- Livability +3.2/5.0
- Rent growth +2.8/5.0
- Schools +2.5/10.0
- Condition / age +2.5/5.0
- Appreciation +0.0/10.0
$160,000
🖨 Deal sheet (PDF) 📄 Offer letter ✓ Due diligence
Listing remarks MLS
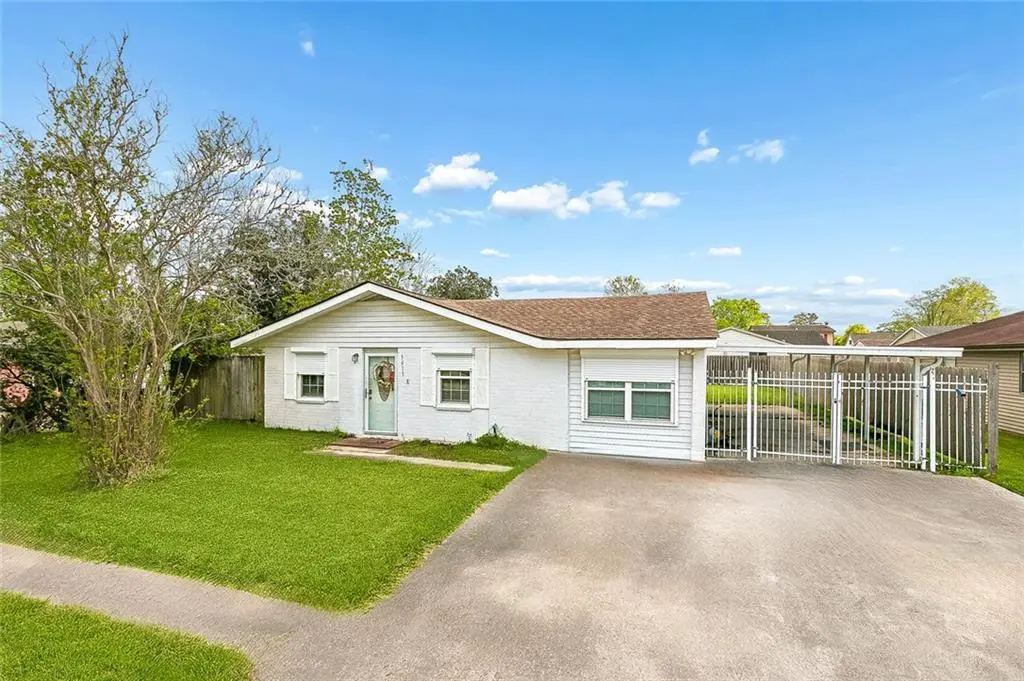
3-bedroom, 2-bath home offers great potential as a starter home or investment property. Features include stainless steel appliances, gas service, updated windows, and no carpet throughout for easy maintenance. Enjoy a large yard, covered carport, and functional storm shutters for added convenience and peace of mind. Don't miss this solid value opportunity!
Key facts
- Updated windows
- Covered carport
- Large yard
Tags
Neighborhood map
What this means for you Summary
Snapshot
- This is a 3-bed/2.0-bath single-family listed at $160k.
Deal economics
- At list price, monthly cash flow is $265 ($3k/yr) — positive.
- The deal already cash-flows at list — no discount required.
- Meets the 1% rule at list price ($2k rent vs $160k).
- Recommended offer: $150k (6.0% below list) — sets the bar for market timing.
- Cap rate 8.8% vs local median 5.6% in Estelle — top-decile yield for the area; either an underpriced asset or a hidden risk that comps aren't pricing in. Stress-test before assuming the spread holds.
Location & tenants
- Location reads 64/100 on livability (#183 in LA) — a middle-class / working-renter tenant base. Strengths: cost of living A+, housing A+, employment B; Watch: crime F, amenities F, commute F.
- Jefferson Parish (suburban): math 24% / reading 34% proficiency, ranked #44 of 98 in LA (top 45%) — low school quality limits family demand, transient renter base, plan for 1-2y turnover; 70% free/reduced lunch — lower-income household profile, screen leases tightly.
- Zoned schools: Estelle School (math 10% / reading 18%, grade F, #534 of 646 statewide, top 83%, 709 students, 73% FRL); Stella Worley Middle School (math 7% / reading 19%, grade F, #189 of 218 statewide, top 87%, 470 students, 80% FRL); L.W. Higgins High School (math 14% / reading 25%, grade F, #186 of 265 statewide, top 73%, 996 students, 70% FRL) — zoned schools at 74% FRL track the district average.
- Zoned-school proficiency averages 16% at this address vs 29% district-wide (-14 pts) — the specific schools serving this property underperform the Jefferson Parish average; the district grade overstates school quality for this exact location.
- Market conditions: Rents rising (+1.1%/yr); 299 active listings in the ZIP; 14 comparable units currently listed for rent nearby; rentals at typical pace (median 25d on market — plan ~3-4 weeks tenant-placement turnaround); 518 units permitted in Jefferson Parish in 2024 (43 in 5+ unit buildings).
- This rent runs 38% of the median local income ($55k/yr) — at the standard rent-burdened threshold; future hikes will face affordability resistance.
Forward outlook
- Local home prices are declining (-3.0%/yr); year-one equity from $1k of loan paydown is wiped out by about $5k of value loss. Plan a longer hold.
Negotiation context
- It's been on market 86 days — a 6% lower offer ($150k) is reasonable based on typical stale-listing flexibility.
- 8 sale attempts since 32y ago; this cycle's ask has dropped $15k (9%) from the opening price — seller is motivated, your offer sets the floor, not the list.
Risks & watch-outs
- Watch-outs: flood insurance adds $66/mo.
- Climate carrying-cost: severe flood risk; severe wind risk, 99% chance of damaging wind over 30y; extreme-heat days projected 7→20/yr by 2055 (HVAC capex compounding) — expect insurance premiums to compound above CPI over the hold.
Questions for the listing agent
- It's been on market 86 days. Have you received any prior offers? Is the seller open to a 6% concession, seller financing, or rate buy-down credit?
- Built in 1976 — when were the roof, HVAC, electrical panel, plumbing, and water heater last replaced?
- What's the actual annual flood-insurance premium (NFIP or private), and is the property in a SFHA with mandatory coverage?
- Why hasn't it sold? Are there any deal-killer items the seller is aware of (foundation, flood, title, zoning, code violations)?
- Is there a deadline driving the sale (1031 exchange, divorce, estate, relocation)? That informs how much negotiation room exists.
- Schools are F-rated, which usually means shorter tenancies and higher turnover. Who's the typical renter profile here, and what's been the actual vacancy rate?
- Crime grade is F in this area — have there been break-ins, vandalism, or insurance claims at this property in the last 3 years? What carrier currently insures it and at what premium?
- What's the average days-on-market for RENTAL listings here right now (not sales)? A rising rental-DOM trend means longer vacancies and softer asking-rent achievability than the comps imply.
- What's the recent tenant-quality profile in this submarket — average credit score on applications, eviction rate, late-payment / NSF rate, and stable-employment percentage? A property-management company in the area should have these aggregated.
- How much new for-sale + rental construction is in the pipeline within 1–3 miles? Heavy new supply typically softens prices + rents 12–24 months out; constrained supply supports both.
Investment metrics
- 1% rule
- 1.10% ✓
- Cap rate
- 8.78%
- Cash-on-cash
- 8.89%
- DSCR
- 1.40
- GRM
- 7.6
CMA / ARV
- ARV (median comp)
- $203,258
- List price
- $160,000
- Delta
- -21.28%
- Verdict
- UNDERPRICED
- Comps
- 20 within 1.0 mi
Show comp detail 12 sales within ~0.75 mi
| Address | Dist | Beds/Ba | Sqft | Sold | Price | $/sf | Match |
|---|---|---|---|---|---|---|---|
| 3008 Mount Kennedy Dr | 0.32mi | 3/2.0 | 1,345 (+6%) | 2mo | $188,900 | $140 | 74 |
| 5009 Rochester Dr | 0.09mi | 3/2.0 | 1,112 (-13%) | 1mo | $180,000 | $162 | 74 |
| 5109 Mount Rushmore Dr | 0.30mi | 3/2.0 | 1,383 (+8%) | 2mo | $189,000 | $137 | 70 |
| 5153 Mount Shasta Dr | 0.39mi | 3/1.0 | 1,220 (-4%) | 1mo | $165,000 | $135 | 70 |
| 2824 Virginia Lee Dr | 0.39mi | 3/2.0 | 1,353 (+6%) | 3mo | $215,000 | $159 | 70 |
| 3021 Mount Kennedy Dr | 0.29mi | 4/2.0 (+1) | 1,450 (+14%) | 1mo | $145,000 | $100 | 58 |
| 3520 Bastian Dr | 0.72mi | 4/2.0 (+1) | 1,300 (+2%) | 2mo | $115,000 | $88 | 57 |
| 5220 Mt Shasta Ln | 0.49mi | 3/1.0 | 1,398 (+10%) | 2mo | $86,000 | $62 | 55 |
| 4141 Ames Blvd | 0.58mi | 3/2.0 | 1,100 (-14%) | 1mo | $196,900 | $179 | 49 |
| 2708 Pritchard Rd | 0.58mi | 3/2.0 | 1,466 (+15%) | 2mo | $266,000 | $181 | 46 |
| 5937 S Oak Dr | 0.60mi | 2/2.0 (-1) | 1,450 (+14%) | 0mo | $171,500 | $118 | 44 |
| 2625 Bay Adams Dr | 0.72mi | 3/1.0 | 1,095 (-14%) | 1mo | $123,000 | $112 | 38 |
Match score weights: distance 35% · size 25% · config 20% · recency 20%. Top-matched comps best support the ARV.
Projected returns pro-forma
-3.0% appreciation · 1.05% rent growth · sell at horizon
- IRR
- -7.6%
- Equity multiple
- 0.72×
- Total profit
- $-12,379
- Equity at exit
- $23,857
- IRR
- -0.8%
- Equity multiple
- 0.95×
- Total profit
- $-2,235
- Equity at exit
- $13,834
Cash invested: $44,800 (down + closing). Projections, not guarantees.
Landlord ↔ Tenant lean methodology
- Overall (STATE)
- 90 Strongly Landlord-Friendly
- State Louisiana
- 90 Strongly Landlord-Friendly · R+12
- County
- — inherits STATE
- City
- — inherits STATE
ZIP-level market 70072
- Rents YoY
- 1.1%
- Active inventory
- 299
- Price-to-rent
- 7.6×
Monthly cashflow live
- Estimated rent
- $1,760 high interval (Pro) →
- Mortgage (P&I)
- −$839
- Tax from tax record
- −$153 /mo · $1,839/yr
- Insurance
- −$67
- Flood insurance flood zone
- −$66 /mo · $798/yr
- HOA
- −$0
- Vacancy / Maint / Mgmt
- −$370
- Net cashflow
- $265
Break-even live
Sensitivity live
| Price | -10% $356 | -5% $311 | +0% $265 | +5% $220 | +10% $175 |
|---|---|---|---|---|---|
| Rent | -10% $126 | -5% $196 | +0% $265 | +5% $335 | +10% $404 |
| Rate | -1.0pp $346 | -0.5pp $306 | base $265 | +0.5pp $224 | +1.0pp $182 |
UW: 25.0% down · 7.5% · 30yr · 1.5% tax · 5.0% vac · 8.0% maint · 8.0% mgmt
Financing live
Cash to close
- Down payment
- $40,000
- Closing costs
- $4,800
- Reserves months
- —
- Total cash needed
- —
Loan-product check · same deal, 3 products live
Conventional
25% down · 7.5% · 30yr
- Down + closing
- —
- Monthly P&I
- —
- Monthly cashflow
- —
- DSCR
- —
- Eligible?
- —
Personal DTI + credit; lowest rate.
DSCR
20% down · 8.5% · 30yr
- Down + closing
- —
- Monthly P&I
- —
- Monthly cashflow
- —
- DSCR
- —
- Eligible?
- —
No personal income docs; deal must DSCR.
Hard money
10% down · 12.0% · 12mo
- Down + closing
- —
- Monthly P&I
- —
- Monthly cashflow
- —
- DSCR
- —
- Eligible?
- —
Short-term bridge; refi at stabilization.
Rent comps 14 comps
| Address | Beds | Baths | Sqft | Rent | $/sqft | DOM | Units | Dist |
|---|---|---|---|---|---|---|---|---|
| 5300 Alpaca Dr Marrero, LA | 4.0 | 2.0 | 1650 | $1,995 | $1.21 | 16d | 1 | 0.48mi |
| 5160 Mount Matterhorn St Marrero, LA | 2.0 | 1.0 | 1000 | $1,050 | $1.05 | 25d | 1 | 0.52mi |
| 5162 Mount Matterhorn Ave Marrero, LA | 2.0 | 1.0 | 1000 | $1,050 | $1.05 | 6d | 1 | 0.52mi |
| 116 Sunrise Dr Marrero, LA | 3.0 | 1.5 | 1225 | $1,750 | $1.43 | 45d | 1 | 0.63mi |
| 5913 S Oak Dr Marrero, LA | 4.0 | 2.0 | 1300 | $1,950 | $1.50 | 25d | 1 | 0.65mi |
| 2425 Ramsey Dr Marrero, LA | 4.0 | 2.0 | 1500 | $1,800 | $1.20 | 3d | 1 | 0.91mi |
| 2417 Highland Meadows Dr Marrero, LA | 4.0 | 2.0 | 1400 | $1,950 | $1.39 | 45d | 1 | 1.06mi |
| 2544 Jeanne St Marrero, LA | 4.0 | 2.0 | 1158 | $2,300 | $1.99 | 25d | 1 | 1.13mi |
| 2325 Wilton St Unit A Marrero, LA | 2.0 | 1.0 | 1000 | $1,200 | $1.20 | 45d | 1 | 1.27mi |
| 2748 Erin Dr Marrero, LA | 3.0 | 2.0 | 1460 | $1,850 | $1.27 | 25d | 1 | 1.31mi |
| 5118 Ehret Rd Unit B Marrero, LA | 3.0 | 2.5 | 1275 | $1,800 | $1.41 | 6d | 1 | 1.34mi |
| 2632 Dove Ave Unit NA Marrero, LA | 3.0 | 2.0 | 1250 | $1,650 | $1.32 | 45d | 1 | 1.35mi |
| 2612 Susie Ct Marrero, LA | 3.0 | 2.0 | 1852 | $2,200 | $1.19 | 21d | 1 | 1.45mi |
| 5504 Randolph St Marrero, LA | 3.0 | 2.0 | 1800 | $1,800 | $1.00 | 25d | 1 | 1.50mi |
Listing history 31 events
-
2026-06-21days on market $160,000 Active 86 DOM
-
2026-06-18days on market $160,000 Active 83 DOM
-
2026-06-17days on market $160,000 Active 82 DOM
-
2026-06-16pricedays on market $160,000 Active 81 DOM
-
2026-06-15days on market $165,000 Active 80 DOM
-
2026-06-13days on market $165,000 Active 78 DOM
-
2026-06-10days on market $165,000 Active 75 DOM
-
2026-06-09days on market $165,000 Active 74 DOM
-
2026-06-08days on market $165,000 Active 73 DOM
-
2026-06-07days on market $165,000 Active 72 DOM
-
2026-06-03days on market $165,000 Active 68 DOM
-
2026-06-02days on market $165,000 Active 67 DOM
-
2026-06-01days on market $165,000 Active 66 DOM
-
2026-05-31days on market $165,000 Active 65 DOM
-
2026-04-30price $165,000 358-char remark
Show marketing remark (364 chars)
3-bedroom, 2-bath home offers great potential as a starter home or investment property. Features include stainless steel appliances, gas service, updated windows, and no carpet throughout for easy maintenance. Enjoy a large yard, covered carport, and functional storm shutters for added convenience and peace of mind. Don’t miss this solid value opportunity!
-
2026-04-30price $165,000 364-char remark
Show marketing remark (364 chars)
3-bedroom, 2-bath home offers great potential as a starter home or investment property. Features include stainless steel appliances, gas service, updated windows, and no carpet throughout for easy maintenance. Enjoy a large yard, covered carport, and functional storm shutters for added convenience and peace of mind. Don’t miss this solid value opportunity!
-
2026-04-06price $167,500 358-char remark
Show marketing remark (364 chars)
3-bedroom, 2-bath home offers great potential as a starter home or investment property. Features include stainless steel appliances, gas service, updated windows, and no carpet throughout for easy maintenance. Enjoy a large yard, covered carport, and functional storm shutters for added convenience and peace of mind. Don’t miss this solid value opportunity!
-
2026-04-06price $167,500 364-char remark
Show marketing remark (364 chars)
3-bedroom, 2-bath home offers great potential as a starter home or investment property. Features include stainless steel appliances, gas service, updated windows, and no carpet throughout for easy maintenance. Enjoy a large yard, covered carport, and functional storm shutters for added convenience and peace of mind. Don’t miss this solid value opportunity!
-
2026-03-27$175,000 Active 358-char remark
Show marketing remark (364 chars)
3-bedroom, 2-bath home offers great potential as a starter home or investment property. Features include stainless steel appliances, gas service, updated windows, and no carpet throughout for easy maintenance. Enjoy a large yard, covered carport, and functional storm shutters for added convenience and peace of mind. Don’t miss this solid value opportunity!
-
2026-03-27$175,000 Active 364-char remark
Show marketing remark (364 chars)
3-bedroom, 2-bath home offers great potential as a starter home or investment property. Features include stainless steel appliances, gas service, updated windows, and no carpet throughout for easy maintenance. Enjoy a large yard, covered carport, and functional storm shutters for added convenience and peace of mind. Don’t miss this solid value opportunity!
-
2021-04-14soldstatus $147,000
-
2021-04-13soldstatus $147,000 Closed
-
2021-02-19status Pending
-
2021-02-18$139,900 Active
-
2021-02-18$139,900
-
2005-04-29soldstatus $64,966
-
2005-03-10$59,000
-
2005-03-10$59,000
-
1995-03-31soldstatus $49,500
-
1994-08-10$49,900
-
1994-08-10$49,900
ⓘ Source: listings_history table (triggers on properties + properties_extension) + one-shot
backfill from property_details.listing_events for pre-trigger history.
Tax reassessment forecast LA · Resets to sale price
- Current annual tax
- $1,839 · $153/mo
- Projected year-2 tax
- $1,839 · $153/mo
- Expected delta
- $0/yr ($0/mo · 0.0%)
ⓘ Screening estimate from a state-policy table — verify with the county assessor before closing.
Climate risk First Street
- Flood 8/10 Severe FEMA zone X · 60% chance over 30 yrs
- Wildfire 1/10 Low
- Heat 10/10 Extreme 7 d/yr ≥108°F today · 20 d/yr by 30 yrs out
- Wind 10/10 Extreme 99% chance of damaging wind over 30 yrs
- Air quality 3/10 Moderate 2 unhealthy d/yr today · 3 by 30 yrs out
Nearby sold comps map
Loading sold comps map…
Walkable amenities ~0.75 mi
Loading nearby amenities…
Taxation est. · year 1
- Rental income
- $21,125
- − Mortgage interest
- −$8,962
- − Property taxes
- −$1,839
- − Insurance
- −$1,598
- − Repairs & maintenance
- −$1,690
- − Management
- −$1,690
- − Depreciation
- −$4,655
- Taxable income
- $692
- Est. tax owed @ 24.0%
- −$166
- After-tax cash flow
- $3,018/yr
For passive investors: Depreciation is non-cash, so a rental often shows a tax loss while cash-flowing — sheltering income. Rental losses are passive: they offset passive income freely, and up to $25,000/yr can offset ordinary (W-2) income if you actively participate and your MAGI is under $100k (phasing out to $0 by $150k); unused losses carry forward. On sale, claimed depreciation is recaptured at up to 25%, and gains may owe capital-gains tax (a 1031 exchange can defer both). Figures are a year-1 estimate at your 24.0% rate — not tax advice; consult a CPA.
Schools (NCES district)
- District
- Jefferson Parish
- NCES district ID
- 2200840
- Math proficiency
- 24% ▼ -36.00%
- Reading proficiency
- 34% ▼ -30.00%
- Median HH income
- $48,421
- Composite
- 25.19/100
- National rank
- #7511
- State rank
- #44 of 98 in LA
Livability — Estelle
- Score
- 64/100
- State rank
- #183
- US rank
- #14840
Category grades
Schools grade is shown separately in the Schools card above.
Census & demographics
- Census place
- Estelle, LA
- County
- Jefferson Parish · 426,999 people
- Metro
- New Orleans-Metairie, LA
- Population (ZIP)
- 55,693
- Household income
- $54,885
- Rent vs Own
- Severe rent burden
- 1807.0
Population outlook (Jefferson County) Hauer SSP2
- Today (2025)
- 451,696 people
- By 2030
- 455,451 · +0.8%
- By 2040
- 458,308 · +1.5%
- By 2050
- 461,031 · +2.1%
- By 2075
- 476,351 · +5.5%
- By 2100
- 499,377 · +10.6%
Race, ethnicity, and origin ACS 2023
- Neighborhood character
- Diverse neighborhood (Simpson 0.67)
- Race & ethnicity
- Black 40% White 39% Hispanic / Latino 12% Two or more races 7% Asian 5%
- Hispanic origin (detail)
- Mexican 4% Dominican 1%
- Common ancestry
- Lithuanian 12% Hispanic 1%
- Foreign-born
- 10% · Canada, Vietnam, Jamaica
- Languages at home
- 85% English-only · Spanish 8% Vietnamese 4% French/Haitian/Cajun 2%
Political lean MEDSL · Jefferson
- 2024 margin
- R (+12.9) · D 42.5% · R 55.5% · Other 2.1%
- 2008→2024 swing
- +13.6pp toward D · 2008: -26.6pp · 2024: -12.9pp
- All cycles
- 2024: R+12.9 2020: R+11.1 2016: R+14.8 2012: R+18.4 2008: R+26.6
Not yet ingested
- Civics
- —
Market trends
- HPI YoY
- ▼ -89.87%
- Current HPI
- 161.7477
- Rent YoY
- ▲ 1.05%
- Metro
- New Orleans-Metairie, LA
- State GDP YoY
- ▲ 3.29%
- F500 in state
- 10
Industry mix (Fortune 500 HQ in LA)
| Industry | F500 HQs | Revenue |
|---|---|---|
| Telecommunications | 2 | $23B |
|
||
| Utilities | 1 | $12B |
|
||
| Wholesale / Distribution | 1 | $5B |
|
||
| Advertising | 1 | $2B |
|
||
Price history
+230.7% since first listed17 events — show timeline
- 2026-04-30 Price Changed $165,000 AcadianaMLS
- 2026-04-30 Price Changed $165,000 GSREIN
- 2026-04-06 Price Changed $167,500 AcadianaMLS
- 2026-04-06 Price Changed $167,500 GSREIN
- 2026-03-27 Listed $175,000 GSREIN
- 2026-03-27 Listed $175,000 AcadianaMLS
- 2021-04-14 Sold (Public Records) $147,000 Public Records
- 2021-04-13 Sold (MLS) $147,000 GSREIN
- 2021-02-19 Pending — GSREIN
- 2021-02-18 Listed $139,900 AcadianaMLS
- 2021-02-18 Listed $139,900 GSREIN
- 2005-04-29 Sold (MLS) $64,966 GSREIN
- 2005-03-10 Listed $59,000 GSREIN
- 2005-03-10 Listed $59,000 AcadianaMLS
- 1995-03-31 Sold (MLS) $49,500 GSREIN
- 1994-08-10 Listed $49,900 GSREIN
- 1994-08-10 Listed $49,900 AcadianaMLS
Property tax history
+8.6%/yrLatest (2025): $1,839 · +0.3% YoY. Source: county tax records.
Cash-flow waterfall
monthlySold comps — $/sqft
last 12 mo · ≤1 miLoading sold comps…