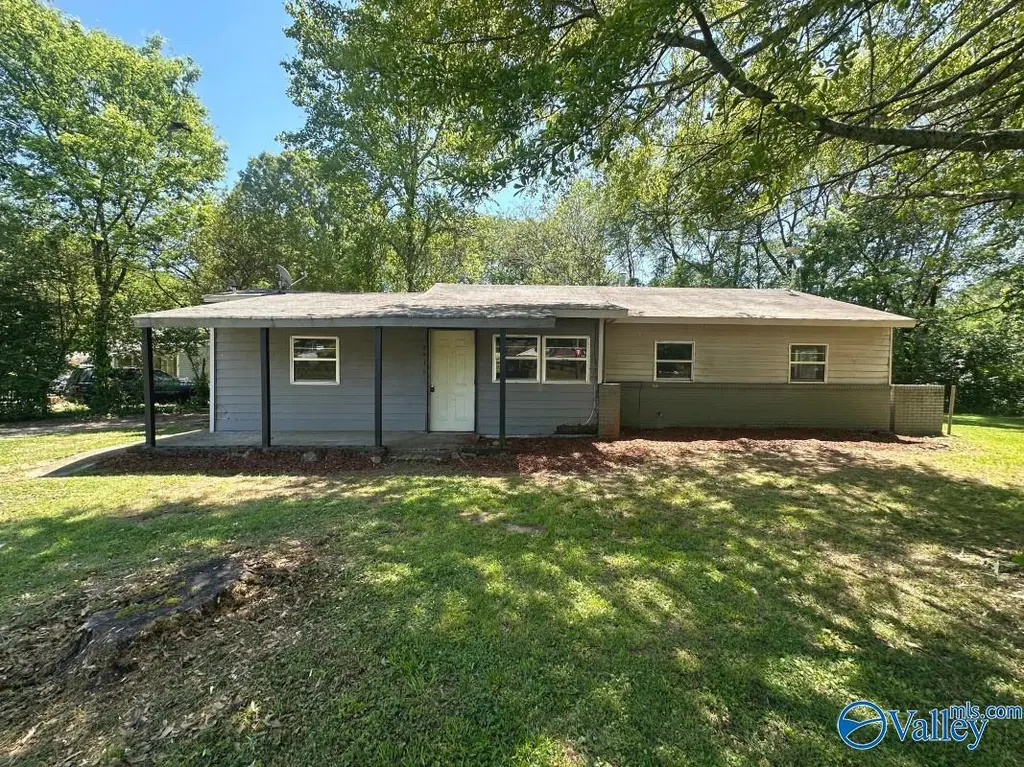
2419 Tuxedo Dr NW · Huntsville, AL
Flood risk 1/10 · Minimal
- FEMA flood zone
- X (unshaded)
- Chance of flooding over 30 yrs
- 0.0%
- Est. flood insurance / yr
- $507 – $1,088
Fire risk 1/10 · Minimal
- Est. fire insurance / yr
- $916 – $1,700
Heat risk 5/10 · Moderate
- Hot days now (above 104°F)
- 7 days/yr
- Hot days in 30 yrs
- 19 days/yr
Wind risk 4/10 · Minor
- Chance of severe wind over 30 yrs
- 17.0%
Air-quality risk 2/10 · Minimal
- Unhealthy air days now
- 1 days/yr
- Unhealthy air days in 30 yrs
- 1 days/yr
Risk factors via First Street. Map © Google.
Why this score? — see what drove the B+ grade
The composite is a weighted blend of 9 inputs, each scored 0–100. Each bar is that input's sub-score; the figure is the points it added to the 100-point composite (weight × sub-score).
- Cash flow +30.0/30.0
- ARV discount +15.0/15.0
- 1% rule +10.0/10.0
- DSCR +10.0/10.0
- Livability +4.1/5.0
- Schools +2.9/10.0
- Rent growth +2.5/5.0
- Condition / age +2.5/5.0
- Appreciation +0.0/10.0
$90,000
🖨 Deal sheet (PDF) 📄 Offer letter ✓ Due diligence
Listing remarks
45% ARV Ranch Corner Lot Only. 1,400 SqFt & Slab Foundation Fix & Flip or Buy & Hold as a Long-Term Rental!
Key facts
- 0.31 acre lot
- Built 1960
- Listed 13 days
Property features AI
Finance
- Other: Located in Lakewood Manor subdivision
- HOA & community: No homeowners association
Exterior
- Parking: On-street parking
- Utilities: Public water; Public sewer; Electric service
- Home design: Single-family residence; Built in 1960; Vinyl siding exterior; One story
- Construction: Vinyl siding construction; Built in 1960; Crawl space foundation
- Exterior features: Public water; Public sewer; Lot approximately 0.31 acres (Lakewood Manor subdivision)
Interior
- Bathrooms: 1 full bathroom
- Heating & cooling: Electric heating; Window air conditioning
- Interior features: Crawl space basement; One level layout
Neighborhood map
What this means for you Summary
Snapshot
- This is a 3-bed/1.0-bath single-family listed at $90k.
Deal economics
- At list price, monthly cash flow is $592 ($7k/yr) — positive.
- The deal already cash-flows at list — no discount required.
- Meets the 1% rule at list price ($1k rent vs $90k).
- Cap rate 14.2% vs local median 3.8% in Huntsville — top-decile yield for the area; either an underpriced asset or a hidden risk that comps aren't pricing in. Stress-test before assuming the spread holds.
Location & tenants
- Location reads 82/100 on livability (#3 in AL, #1,082 nationally) — a professional / high-income tenant draw. Strengths: commute A+, cost of living A+, housing A+; Watch: crime F.
- Huntsville City (urban): math 21% / reading 46% proficiency, ranked #48 of 129 in AL (top 37%) — families likely to look elsewhere, expect single-tenant / working-renter base with shorter leases.
- Zoned schools: Rolling Hills Elementary School (math 4% / reading 17%, grade F, #565 of 627 statewide, top 90%, 483 students, 86% FRL); Jemison High School (math 12% / reading 12%, grade F, #242 of 305 statewide, top 80%, 843 students, 64% FRL) — zoned schools average 76% FRL vs 46% district-wide (29 pts higher); higher-poverty schools than district average — tighter screening recommended.
- Zoned-school proficiency averages 11% at this address vs 34% district-wide (-22 pts) — the specific schools serving this property underperform the Huntsville City average; the district grade overstates school quality for this exact location.
- Market conditions: Rents soft (-0.1%/yr); 337 active listings in the ZIP; 40 comparable units currently listed for rent nearby; rentals lingering (median 45d on market — plan ~5-8 weeks vacancy on turnover, expect pricing pressure); 58% of comp listings sitting > 30 days — soft ceiling on asking rent; 4,709 units permitted in Madison County in 2024 (1,186 in 5+ unit buildings).
- This rent runs 34% of the median local income ($51k/yr) — at the standard rent-burdened threshold; future hikes will face affordability resistance.
Forward outlook
- Local home prices are declining (-3.0%/yr); year-one equity from $622 of loan paydown is wiped out by about $3k of value loss. Plan a longer hold.
- Madison County population projected at +18% by 2050 — long-run rental-demand tailwind backs the buy-and-hold thesis.
- At projected returns (-3.0% appreciation + 0.0% rent growth), your $25k cash investment doubles in ~5 years — after that, you're playing with house money.
Negotiation context
- Only 13 days on market — expect competitive offers; lowballing is unlikely to land.
- Current owner paid $70k; 29% above their basis — modest negotiation headroom, anchor on the comps not their cost.
Risks & watch-outs
- Climate carrying-cost: extreme-heat days projected 7→19/yr by 2055 (HVAC capex compounding) — expect insurance premiums to compound above CPI over the hold.
Questions for the listing agent
- Built in 1960 — when were the roof, HVAC, electrical panel, plumbing, and water heater last replaced?
- Is there a deadline driving the sale (1031 exchange, divorce, estate, relocation)? That informs how much negotiation room exists.
- Crime grade is F in this area — have there been break-ins, vandalism, or insurance claims at this property in the last 3 years? What carrier currently insures it and at what premium?
- What's the average days-on-market for RENTAL listings here right now (not sales)? A rising rental-DOM trend means longer vacancies and softer asking-rent achievability than the comps imply.
- What's the recent tenant-quality profile in this submarket — average credit score on applications, eviction rate, late-payment / NSF rate, and stable-employment percentage? A property-management company in the area should have these aggregated.
- How much new for-sale + rental construction is in the pipeline within 1–3 miles? Heavy new supply typically softens prices + rents 12–24 months out; constrained supply supports both.
Investment metrics
- 1% rule
- 1.61% ✓
- Cap rate
- 14.19%
- Cash-on-cash
- 28.21%
- DSCR
- 2.26
- GRM
- 5.2
CMA / ARV
- ARV (on-the-fly)
- $168,640
- Comps found
- 12
Show comp detail 12 sales within ~0.75 mi
| Address | Dist | Beds/Ba | Sqft | Sold | Price | $/sf | Match |
|---|---|---|---|---|---|---|---|
| 2419 Tuxedo Dr NW | 0.00mi | 3/1.0 | 1,306 (-4%) | 1mo | $79,000 | $60 | 93 |
| 4304 Blue Springs Rd NW | 0.49mi | 3/2.0 | 1,366 (+0%) | 5mo | $150,000 | $110 | 68 |
| 4212 NW Lakeview Dr | 0.21mi | 3/1.5 | 1,207 (-11%) | 3mo | $205,000 | $170 | 67 |
| 6005 Sandia Blvd NW | 0.54mi | 3/1.5 | 1,330 (-2%) | 6mo | $165,000 | $124 | 65 |
| 6000 NW Belgrade Dr | 0.54mi | 3/1.0 | 1,275 (-6%) | 4mo | $150,000 | $118 | 61 |
| 2413 Springhill Rd NW | 0.62mi | 3/1.5 | 1,311 (-4%) | 4mo | $199,900 | $152 | 59 |
| 2118 Medaris Rd NW | 0.53mi | 3/1.0 | 1,237 (-9%) | 1mo | $185,500 | $150 | 59 |
| 4209 Memorial Parkway North N | 0.69mi | 3/2.0 | 1,403 (+3%) | 2mo | $185,000 | $132 | 57 |
| 4023 NW Knollbrook Dr | 0.61mi | 3/1.5 | 1,462 (+8%) | 6mo | $172,375 | $118 | 52 |
| 4805 Drews Dogwood Ln | 0.62mi | 3/2.0 | 1,484 (+9%) | 3mo | $266,184 | $179 | 50 |
| 4114 NW Blue Spring Rd | 0.63mi | 3/1.5 | 1,181 (-13%) | 4mo | $90,000 | $76 | 44 |
| 6103 Sandia Blvd NW | 0.74mi | 3/2.0 | 1,546 (+14%) | 2mo | $150,000 | $97 | 37 |
Match score weights: distance 35% · size 25% · config 20% · recency 20%. Top-matched comps best support the ARV.
Projected returns pro-forma
-3.0% appreciation · 0.0% rent growth · sell at horizon
- IRR
- 19.1%
- Equity multiple
- 1.75×
- Total profit
- $18,877
- Equity at exit
- $13,419
- IRR
- 25.4%
- Equity multiple
- 2.93×
- Total profit
- $48,523
- Equity at exit
- $7,782
Cash invested: $25,200 (down + closing). Projections, not guarantees.
Landlord ↔ Tenant lean methodology
- Overall (STATE)
- 90 Strongly Landlord-Friendly
- State Alabama
- 90 Strongly Landlord-Friendly · R+15
- County
- — inherits STATE
- City
- — inherits STATE
ZIP-level market 35810
- Home prices YoY
- -23.5%
- Rents YoY
- -0.1%
- Active inventory
- 337
- Price-to-rent
- 5.2×
Monthly cashflow live
- Estimated rent
- $1,449 high interval (Pro) →
- Mortgage (P&I)
- −$472
- Tax from tax record
- −$43 /mo · $513/yr
- Insurance
- −$38
- HOA
- −$0
- Vacancy / Maint / Mgmt
- −$304
- Net cashflow
- $592
Break-even live
Sensitivity live
| Price | -10% $643 | -5% $618 | +0% $592 | +5% $567 | +10% $541 |
|---|---|---|---|---|---|
| Rent | -10% $478 | -5% $535 | +0% $592 | +5% $650 | +10% $707 |
| Rate | -1.0pp $638 | -0.5pp $615 | base $592 | +0.5pp $569 | +1.0pp $545 |
UW: 25.0% down · 7.5% · 30yr · 1.5% tax · 5.0% vac · 8.0% maint · 8.0% mgmt
Financing live
Cash to close
- Down payment
- $22,500
- Closing costs
- $2,700
- Reserves months
- —
- Total cash needed
- —
Loan-product check · same deal, 3 products live
Conventional
25% down · 7.5% · 30yr
- Down + closing
- —
- Monthly P&I
- —
- Monthly cashflow
- —
- DSCR
- —
- Eligible?
- —
Personal DTI + credit; lowest rate.
DSCR
20% down · 8.5% · 30yr
- Down + closing
- —
- Monthly P&I
- —
- Monthly cashflow
- —
- DSCR
- —
- Eligible?
- —
No personal income docs; deal must DSCR.
Hard money
10% down · 12.0% · 12mo
- Down + closing
- —
- Monthly P&I
- —
- Monthly cashflow
- —
- DSCR
- —
- Eligible?
- —
Short-term bridge; refi at stabilization.
Rent comps 40 comps
| Address | Beds | Baths | Sqft | Rent | $/sqft | DOM | Units | Dist |
|---|---|---|---|---|---|---|---|---|
| 4802 Proctor Cir NW Huntsville, AL | 3.0 | 1.0 | 1000 | $1,250 | $1.25 | 44d | 1 | 0.05mi |
| 2415 Vining Ave NW Huntsville, AL | 3.0 | 1.0 | 1079 | $1,250 | $1.16 | 14d | 1 | 0.14mi |
| 2200 Norwood Dr NW Huntsville, AL | 3.0 | 1.0 | 1060 | $1,150 | $1.08 | 24d | 1 | 0.40mi |
| 2207 Norwood Dr NW Huntsville, AL | 3.0 | 1.0 | 1020 | $1,295 | $1.27 | 14d | 1 | 0.42mi |
| 4408 Kenwood Dr NW Huntsville, AL | 3.0 | 1.5 | 1520 | $1,195 | $0.79 | 44d | 1 | 0.44mi |
| 5025 Blue Spring Rd NW Huntsville, AL | 3.0 | 2.5 | 1273 | $1,195 | $0.94 | 14d | 2 | 0.50mi |
| 2113 Norris Rd NW Huntsville, AL | 3.0 | 1.0 | 1372 | $1,550 | $1.13 | 44d | 1 | 0.54mi |
| 2206 Harris Rd NW Huntsville, AL | 3.0 | 1.0 | 1354 | $1,400 | $1.03 | 44d | 1 | 0.57mi |
| 2117 Griffith Dr NW Huntsville, AL | 3.0 | 1.0 | 1000 | $1,095 | $1.09 | 24d | 1 | 0.57mi |
| 2602 Gibson St NW Huntsville, AL | 4.0 | 2.0 | 1795 | $1,625 | $0.91 | 44d | 1 | 0.60mi |
| 4114 Blue Spring Rd NW Huntsville, AL | 3.0 | 2.0 | 1100 | $1,500 | $1.36 | 24d | 1 | 0.62mi |
| 2117 Atkins Dr NW Huntsville, AL | 3.0 | 2.0 | 1250 | $1,699 | $1.36 | 24d | 1 | 0.62mi |
| 6000 Cherokee Hills Dr NW Huntsville, AL | 3.0 | 2.0 | 1086 | $1,600 | $1.47 | 24d | 1 | 0.64mi |
| 2106 Sullivan Rd NW Huntsville, AL | 3.0 | 1.5 | 1690 | $1,195 | $0.71 | 45d | 1 | 0.65mi |
| 3811 Lakeview Dr NW Huntsville, AL | 3.0 | 2.0 | 1707 | $1,350 | $0.79 | 44d | 1 | 0.67mi |
| 2506 Jeri St NW Huntsville, AL | 3.0 | 1.5 | 1274 | $1,400 | $1.10 | 24d | 1 | 0.67mi |
| 6022 Belgrade Dr NW Huntsville, AL | 3.0 | 1.5 | 1015 | $1,320 | $1.30 | 24d | 1 | 0.69mi |
| 4005 Memorial Pkwy NW Huntsville, AL | 3.0 | 1.0 | 1100 | $1,375 | $1.25 | 44d | 1 | 0.78mi |
| 2212 Ricky Rd NW Huntsville, AL | 3.0 | 2.0 | 1539 | $1,400 | $0.91 | 24d | 1 | 0.86mi |
| 2519 Birchfield St NW Huntsville, AL | 3.0 | 1.5 | 1125 | $1,195 | $1.06 | 44d | 1 | 0.89mi |
| 3202 Deerfield Rd NW Huntsville, AL | 3.0 | 2.0 | 1234 | $1,425 | $1.15 | 44d | 1 | 0.97mi |
| 6207 Belgrade Dr NW Huntsville, AL | 3.0 | 1.5 | 1050 | $1,395 | $1.33 | 45d | 1 | 1.00mi |
| 3103 Sonya Dr NW Huntsville, AL | 3.0 | 1.0 | 1101 | $1,399 | $1.27 | 24d | 1 | 1.03mi |
| 2032 Ricky Rd NW Huntsville, AL | 4.0 | 2.0 | 1181 | $1,523 | $1.29 | 21d | 1 | 1.03mi |
| 3707 Lakewood Dr NW Huntsville, AL | 3.0 | 1.0 | 1100 | $1,100 | $1.00 | 44d | 1 | 1.04mi |
| 6214 Belgrade Dr NW Huntsville, AL | 3.0 | 1.5 | 1350 | $1,095 | $0.81 | 44d | 1 | 1.05mi |
| 3014 Winchester Rd NW Huntsville, AL | 2.0 | 2.0 | 1480 | $2,500 | $1.69 | 44d | 1 | 1.11mi |
| 3606 Lakewood Rd NW Huntsville, AL | 3.0 | 1.5 | 1408 | $1,400 | $0.99 | 44d | 1 | 1.17mi |
| 3314 Deerfield Rd NW Huntsville, AL | 3.0 | 2.0 | 1207 | $1,350 | $1.12 | 44d | 1 | 1.19mi |
| 2801 Penland Ave NW Huntsville, AL | 3.0 | 2.0 | 1650 | $1,450 | $0.88 | 24d | 1 | 1.22mi |
| 2401 Mount Vernon Rd NW Huntsville, AL | 3.0 | 1.0 | 950 | $1,045 | $1.10 | 44d | 1 | 1.28mi |
| 6309 Matic Rd NW Huntsville, AL | 4.0 | 2.0 | 1334 | $1,800 | $1.35 | 44d | 1 | 1.33mi |
| 3729 Millbrae Dr NW Huntsville, AL | 3.0 | 1.0 | 1050 | $1,458 | $1.39 | 14d | 1 | 1.35mi |
| 3706 Wilbanks Dr NW Huntsville, AL | 3.0 | 1.0 | 1000 | $1,300 | $1.30 | 44d | 1 | 1.40mi |
| 3205 Lewisburg Dr NW Huntsville, AL | 3.0 | 2.0 | 1408 | $1,600 | $1.14 | 24d | 1 | 1.41mi |
| 3601 Fay St NW Huntsville, AL | 2.0 | 1.0 | 972 | $1,195 | $1.23 | 44d | 1 | 1.43mi |
| 3708 Valleydale Rd NW Huntsville, AL | 3.0 | 1.5 | 1136 | $1,350 | $1.19 | 44d | 1 | 1.44mi |
| 5003 Stag Run Cir NW Huntsville, AL | 3.0 | 2.0 | 1410 | $1,450 | $1.03 | 14d | 1 | 1.44mi |
| 3813 Millbrae Dr NW Huntsville, AL | 4.0 | 2.0 | 1500 | $1,895 | $1.26 | 44d | 1 | 1.46mi |
| 3013 Kirkland Dr NW Huntsville, AL | 3.0 | 1.5 | 1324 | $1,295 | $0.98 | 44d | 1 | 1.47mi |
Listing history 4 events
-
2026-04-29status Pending
-
2026-04-22price $90,000
-
2026-04-16$99,000 Active
-
2026-04-10soldstatus $70,000
ⓘ Source: listings_history table (triggers on properties + properties_extension) + one-shot
backfill from property_details.listing_events for pre-trigger history.
Tax reassessment forecast AL · Resets to sale price
- Current annual tax
- $513 · $43/mo
- Projected year-2 tax
- $513 · $43/mo
- Expected delta
- $0/yr ($0/mo · 0.0%)
ⓘ Screening estimate from a state-policy table — verify with the county assessor before closing.
Climate risk First Street
- Flood 1/10 Low FEMA zone X (unshaded) · 0% chance over 30 yrs
- Wildfire 1/10 Low
- Heat 5/10 Major 7 d/yr ≥104°F today · 19 d/yr by 30 yrs out
- Wind 4/10 Moderate 17% chance of damaging wind over 30 yrs
- Air quality 2/10 Low 1 unhealthy d/yr today · 1 by 30 yrs out
Nearby sold comps map
Loading sold comps map…
Walkable amenities ~0.75 mi
Loading nearby amenities…
Taxation est. · year 1
- Rental income
- $17,387
- − Mortgage interest
- −$5,041
- − Property taxes
- −$513
- − Insurance
- −$450
- − Repairs & maintenance
- −$1,391
- − Management
- −$1,391
- − Depreciation
- −$2,618
- Taxable income
- $5,982
- Est. tax owed @ 24.0%
- −$1,436
- After-tax cash flow
- $5,673/yr
For passive investors: Depreciation is non-cash, so a rental often shows a tax loss while cash-flowing — sheltering income. Rental losses are passive: they offset passive income freely, and up to $25,000/yr can offset ordinary (W-2) income if you actively participate and your MAGI is under $100k (phasing out to $0 by $150k); unused losses carry forward. On sale, claimed depreciation is recaptured at up to 25%, and gains may owe capital-gains tax (a 1031 exchange can defer both). Figures are a year-1 estimate at your 24.0% rate — not tax advice; consult a CPA.
Schools (NCES district)
- District
- Huntsville City
- NCES district ID
- 0101800
- Math proficiency
- 21% ▼ -23.00%
- Reading proficiency
- 46% ▬ 0.00%
- Median HH income
- $48,264
- Composite
- 28.84/100
- National rank
- #6647
- State rank
- #48 of 129 in AL
Livability — Huntsville
- Score
- 82/100
- State rank
- #3
- US rank
- #1082
Category grades
Schools grade is shown separately in the Schools card above.
Census & demographics
- Census place
- Huntsville, AL
- County
- Madison County · 380,832 people
- City population
- 220,435
- Metro
- Huntsville, AL
- Population (ZIP)
- 32,843
- Household income
- $51,233
- Rent vs Own
- Severe rent burden
- 1223.0
Population outlook (Madison County) Hauer SSP2
- Today (2025)
- 392,086 people
- By 2030
- 409,788 · +4.5%
- By 2040
- 440,557 · +12.4%
- By 2050
- 460,990 · +17.6%
- By 2075
- 502,872 · +28.3%
- By 2100
- 513,623 · +31.0%
Race, ethnicity, and origin ACS 2023
- Neighborhood character
- Predominantly Black (69%)
- Race & ethnicity
- Black 69% White 18% Hispanic / Latino 9% Two or more races 5%
- Hispanic origin (detail)
- Mexican 3% Puerto Rican 2% Dominican 2%
- Common ancestry
- Italian 2% Lithuanian 0%
- Foreign-born
- 6% · Canada
- Languages at home
- 92% English-only · Spanish 7%
Political lean MEDSL · Madison
- 2024 margin
- Lean R (+9.0) · D 44.7% · R 53.7% · Other 1.6%
- 2008→2024 swing
- +6.0pp toward D · 2008: -14.9pp · 2024: -9.0pp
- All cycles
- 2024: R+9.0 2020: R+8.0 2016: R+16.8 2012: R+18.7 2008: R+14.9
Not yet ingested
- Civics
- —
Market trends
- HPI YoY
- ▼ -61.00%
- Current HPI
- 198.9629
- Rent YoY
- ▬ -0.05%
- Metro
- Huntsville, AL
- State GDP YoY
- ▲ 2.94%
- F500 in state
- 4
Industry mix (Fortune 500 HQ in AL)
| Industry | F500 HQs | Revenue |
|---|---|---|
| Financial Services | 1 | $8B |
|
||
| Healthcare | 1 | $5B |
|
||
Price history
+28.6% since first listed4 events — show timeline
- 2026-04-29 Pending — VMLS
- 2026-04-22 Price Changed $90,000 VMLS
- 2026-04-16 Listed $99,000 VMLS
- 2026-04-10 Sold (Public Records) $70,000 Public Records
Property tax history
+13.5%/yrLatest (2024): $513 · +16.9% YoY. Source: county tax records.
Cash-flow waterfall
monthlySold comps — $/sqft
last 12 mo · ≤1 miLoading sold comps…