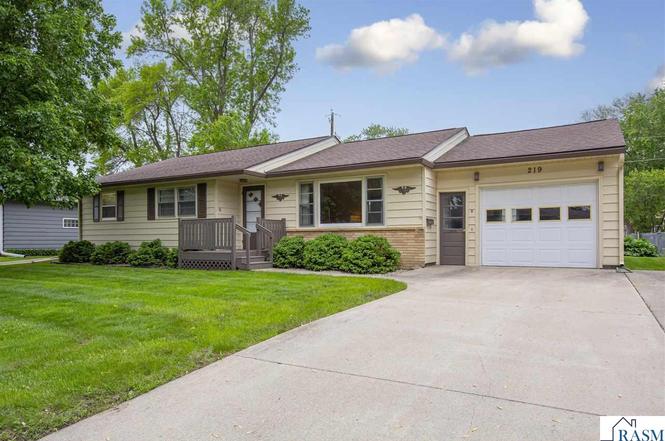
219 Floral Ave · Mankato, MN
Flood risk 1/10 · Minimal
- FEMA flood zone
- X
- Chance of flooding over 30 yrs
- 0.0%
- Est. flood insurance / yr
- $473 – $860
Fire risk 2/10 · Minimal
- Est. fire insurance / yr
- $888 – $1,650
Heat risk 2/10 · Minimal
- Hot days now (above 99°F)
- 7 days/yr
- Hot days in 30 yrs
- 15 days/yr
Wind risk 2/10 · Minimal
- Chance of severe wind over 30 yrs
- —
Air-quality risk 2/10 · Minimal
- Unhealthy air days now
- 1 days/yr
- Unhealthy air days in 30 yrs
- 1 days/yr
Risk factors via First Street. Map © Google.
Why this score? — see what drove the D+ grade
The composite is a weighted blend of 9 inputs, each scored 0–100. Each bar is that input's sub-score; the figure is the points it added to the 100-point composite (weight × sub-score).
- Cash flow +13.7/30.0
- ARV discount +9.5/15.0
- Rent growth +4.6/5.0
- Schools +4.4/10.0
- DSCR +4.1/10.0
- Livability +3.9/5.0
- 1% rule +3.2/10.0
- Condition / age +2.5/5.0
- Appreciation +0.0/10.0
$279,900
🖨 Deal sheet 📄 Offer letter ✓ Due diligence
Listing remarks MLS
Welcome to this beautifully preserved 1959 rambler, where mid-century charm and exceptional care shine throughout. Original details, quality craftsmanship, and timeless design have been thoughtfully maintained for generations. The main level features three spacious bedrooms, a full bath, warm wood flooring, and an abundance of natural light throughout. The kitchen is filled with original character, offering wood cabinetry, a vintage wall oven, a built-in desk, and plenty of space for a dining table. The finished lower level blends nostalgia with functionality, featuring spacious family and recreation rooms with a classic shuffleboard area. Custom room-divider bookshelves add both style and storage, while the kitchenette—with blue laminate countertops and an egress window—provides flexibility for entertaining or hobbies. A charming blue tile bathroom completes the space with a nod to the home's mid-century roots. Outside, a stone patio provides a peaceful place to enjoy the backyard, where 11 evergreen trees create a natural privacy wall that will continue to mature into an impressive backdrop. Beautifully preserved and rich with original character, this home has been cherished by just two owners since it was built and is ready to welcome its next chapter.
Key facts
- Vintage wall oven
- Natural light
- Original details
Tags
Property features AI
Exterior
- Parking: Attached garage (1-car), concrete floor — garage dimensions approximately 24 x 14
- Utilities: City water; City sewer; Natural gas
- Home design: Residential property; One level (main living on one level); Main level living area and additional finished lower level
- Construction: Frame construction; Asphalt roof; Block foundation; Originally built area includes above-grade and below-grade finished space
- Exterior features: Patio; Medium tree coverage on the lot; City street frontage
Interior
- Kitchen: Cooktop; Wall oven; Refrigerator
- Bedrooms: Three bedrooms (primary and two additional bedrooms on the main level)
- Bathrooms: One full bathroom on the main level; One three-quarter bathroom in the basement
- Heating & cooling: Forced air heating; Central air conditioning
- Interior features: Finished basement with egress window(s), storage space and sump pump; Kitchen and dining combined (Kitchen/Dining Room)
- Laundry & utility: Laundry located in the basement; Gas water heater
Neighborhood map
What this means for you Summary
Snapshot
- This is a 4-bed/1.0-bath single-family listed at $280k.
Deal economics
- At list price, monthly cash flow is $18 ($221/yr) — positive.
- The deal already cash-flows at list — no discount required.
- To meet the 1% rule (rent ≥ 1% of price), the offer needs to be $230k (17.9% below list).
- Recommended offer: $230k (17.9% below list) — sets the bar for 1% rule.
- Cap rate 6.4% vs local median 3.4% in Mankato — top-decile yield for the area; either an underpriced asset or a hidden risk that comps aren't pricing in. Stress-test before assuming the spread holds.
Location & tenants
- Location reads 77/100 on livability (#133 in MN, #2,970 nationally) — a middle-class / working-renter tenant base. Strengths: housing A+, health & safety A+, cost of living A; Watch: crime C-, amenities C-, commute F.
- Mankato Public School District (urban): math 48% / reading 56% proficiency, ranked #98 of 301 in MN (top 33%) — acceptable for families but not a draw, mixed tenant base, ~2y average lease.
- Market conditions: Rents rising fast (+8.6%/yr); 352 active listings in the ZIP; 2 comparable units currently listed for rent nearby; 269 units permitted in Blue Earth County in 2024 (154 in 5+ unit buildings).
- This rent runs 40% of the median local income ($70k/yr) — at the standard rent-burdened threshold; future hikes will face affordability resistance.
Forward outlook
- Local home prices are declining (-3.0%/yr); year-one equity from $2k of loan paydown is wiped out by about $8k of value loss. Plan a longer hold.
- Blue Earth County population projected at +18% by 2050 — long-run rental-demand tailwind backs the buy-and-hold thesis.
Negotiation context
- Only 9 days on market — expect competitive offers; lowballing is unlikely to land.
- 5 sale attempts since 12y ago with the ask held roughly flat each time — persistent listings suggest the price (not the market) is what's stuck; bring a comps-based counter.
- Current owner paid $145k; list at $280k implies a 93% gain — meaningful room to come down on a strong offer.
Risks & watch-outs
- Watch-outs: built in 1959 — expect roof / HVAC / electrical / plumbing capex.
Questions for the listing agent
- Built in 1959 — when were the roof, HVAC, electrical panel, plumbing, and water heater last replaced?
- Is there a deadline driving the sale (1031 exchange, divorce, estate, relocation)? That informs how much negotiation room exists.
- Schools are B-rated — typically a magnet for longer-tenancy family renters. What's the average tenant stay here, and is there a school-zone premium baked into asking?
- The area grade is low — what's the realistic commute time and amenity access for the typical tenant pool here? Any planned neighborhood developments (good or bad) we should know about?
- What's the average days-on-market for RENTAL listings here right now (not sales)? A rising rental-DOM trend means longer vacancies and softer asking-rent achievability than the comps imply.
- What's the recent tenant-quality profile in this submarket — average credit score on applications, eviction rate, late-payment / NSF rate, and stable-employment percentage? A property-management company in the area should have these aggregated.
- How much new for-sale + rental construction is in the pipeline within 1–3 miles? Heavy new supply typically softens prices + rents 12–24 months out; constrained supply supports both.
Investment metrics
- 1% rule
- 0.82% ✗
- Cap rate
- 6.37%
- Cash-on-cash
- 0.28%
- DSCR
- 1.01
- GRM
- 10.2
CMA / ARV
- ARV (on-the-fly)
- $293,184
- Comps found
- 12
Show comp detail 12 sales within ~0.75 mi
| Address | Dist | Beds/Ba | Sqft | Sold | Price | $/sf | Match |
|---|---|---|---|---|---|---|---|
| 219 Ellis Ave | 0.19mi | 3/2.0 (-1) | 2,067 (+2%) | 14mo | $244,000 | $118 | 68 |
| 49 Camelot Ln | 0.19mi | 4/2.0 | 2,080 (+2%) | 24mo | $310,000 | $149 | 64 |
| 219 James Ave | 0.60mi | 4/2.0 | 2,067 (+2%) | 2mo | $300,000 | $145 | 64 |
| 310 Dillon Ave | 0.10mi | 3/2.0 (-1) | 2,229 (+10%) | 14mo | $272,000 | $122 | 59 |
| 110 Heron Dr | 0.55mi | 4/2.0 | 2,042 (+0%) | 19mo | $299,900 | $147 | 54 |
| 202 E Lewis St | 0.66mi | 3/2.0 (-1) | 1,910 (-6%) | 5mo | $210,500 | $110 | 46 |
| 215 James Ave | 0.60mi | 4/2.0 | 1,820 (-11%) | 8mo | $280,000 | $154 | 44 |
| 153 Rita Rd | 0.59mi | 3/2.0 (-1) | 1,968 (-3%) | 23mo | $295,000 | $150 | 39 |
| 203 S Division St | 0.67mi | 3/2.0 (-1) | 2,322 (+14%) | 0mo | $334,700 | $144 | 36 |
| 216 Branson St | 0.70mi | 3/1.5 (-1) | 1,960 (-4%) | 23mo | $260,000 | $133 | 35 |
| 118 Martin Cir | 0.62mi | 3/1.0 (-1) | 1,876 (-8%) | 22mo | $251,000 | $134 | 35 |
| 10 Roblen Ct | 0.71mi | 4/2.0 | 2,172 (+7%) | 23mo | $305,500 | $141 | 33 |
Match score weights: distance 35% · size 25% · config 20% · recency 20%. Top-matched comps best support the ARV.
Projected returns pro-forma
-3.0% appreciation · 8.0% rent growth · sell at horizon
- IRR
- -10.8%
- Equity multiple
- 0.59×
- Total profit
- $-32,094
- Equity at exit
- $41,734
- IRR
- 4.1%
- Equity multiple
- 1.37×
- Total profit
- $28,607
- Equity at exit
- $24,201
Cash invested: $78,372 (down + closing). Projections, not guarantees.
Landlord ↔ Tenant lean methodology
- Overall (STATE)
- 46 Balanced
- State Minnesota
- 46 Balanced · D+2
- County
- — inherits STATE
- City
- — inherits STATE
ZIP-level market 56001
- Rents YoY
- 8.6%
- Active inventory
- 352
- Price-to-rent
- 10.2×
Monthly cashflow live
- Estimated rent
- $2,297 medium interval (Pro) →
- Mortgage (P&I)
- −$1,468
- Tax from tax record
- −$212 /mo · $2,540/yr
- Insurance
- −$117
- HOA
- −$0
- Vacancy / Maint / Mgmt
- −$482
- Net cashflow
- $18
Break-even live
UW: 25.0% down · 7.5% · 30yr · 1.5% tax · 5.0% vac · 8.0% maint · 8.0% mgmt
Financing live
Cash to close
- Down payment
- $69,975
- Closing costs
- $8,397
- Reserves months
- —
- Total cash needed
- —
Loan-product check · same deal, 3 products live
Conventional
25% down · 7.5% · 30yr
- Down + closing
- —
- Monthly P&I
- —
- Monthly cashflow
- —
- DSCR
- —
- Eligible?
- —
Personal DTI + credit; lowest rate.
DSCR
20% down · 8.5% · 30yr
- Down + closing
- —
- Monthly P&I
- —
- Monthly cashflow
- —
- DSCR
- —
- Eligible?
- —
No personal income docs; deal must DSCR.
Hard money
10% down · 12.0% · 12mo
- Down + closing
- —
- Monthly P&I
- —
- Monthly cashflow
- —
- DSCR
- —
- Eligible?
- —
Short-term bridge; refi at stabilization.
Rent comps 2 comps
| Address | Beds | Baths | Sqft | Rent | $/sqft | DOM | Units | Dist |
|---|---|---|---|---|---|---|---|---|
| 1050 Marsh St Unit 326 Van Tol Mankato, MN | 3.0 | 2.0 | 1461 | $2,360 | $1.62 | 43d | 1 | 1.19mi |
| 412 Wall St Unit 412 North Mankato, MN | 4.0 | 2.5 | 2600 | $2,300 | $0.88 | 43d | 1 | 1.48mi |
Listing history 8 events
-
2026-06-19days on market $279,900 Active 9 DOM
-
2026-06-18days on market $279,900 Active 8 DOM
-
2026-06-17days on market $279,900 Active 7 DOM
-
2026-06-16days on market $279,900 Active 6 DOM
-
2026-06-15days on market $279,900 Active 5 DOM
-
2026-06-14days on market $279,900 Active 3 DOM
-
2026-06-13remarks 699-char remark
-
2026-06-13$279,900 Active 2 DOM
ⓘ Source: listings_history table (triggers on properties + properties_extension) + one-shot
backfill from property_details.listing_events for pre-trigger history.
Tax reassessment forecast MN · Partial reset (capped growth)
- Current annual tax
- $2,540 · $212/mo
- Projected year-2 tax
- $2,837 · $236/mo
- Expected delta
- +$297/yr (+$25/mo · 11.7%)
ⓘ Screening estimate from a state-policy table — verify with the county assessor before closing.
Climate risk First Street
- Flood 1/10 Low FEMA zone X · 0% chance over 30 yrs
- Wildfire 2/10 Low
- Heat 2/10 Low 7 d/yr ≥99°F today · 15 d/yr by 30 yrs out
- Wind 2/10 Low
- Air quality 2/10 Low 1 unhealthy d/yr today · 1 by 30 yrs out
Nearby sold comps map
Loading sold comps map…
Walkable amenities ~0.75 mi
Loading nearby amenities…
Taxation est. · year 1
- Rental income
- $27,563
- − Mortgage interest
- −$15,679
- − Property taxes
- −$2,540
- − Insurance
- −$1,400
- − Repairs & maintenance
- −$2,205
- − Management
- −$2,205
- − Depreciation
- −$8,143
- Taxable loss
- −$4,608
- Est. tax savings @ 24.0%
- +$1,106
- After-tax cash flow
- $1,327/yr
For passive investors: Depreciation is non-cash, so a rental often shows a tax loss while cash-flowing — sheltering income. Rental losses are passive: they offset passive income freely, and up to $25,000/yr can offset ordinary (W-2) income if you actively participate and your MAGI is under $100k (phasing out to $0 by $150k); unused losses carry forward. On sale, claimed depreciation is recaptured at up to 25%, and gains may owe capital-gains tax (a 1031 exchange can defer both). Figures are a year-1 estimate at your 24.0% rate — not tax advice; consult a CPA.
Schools (NCES district)
- District
- Mankato Public School District
- NCES district ID
- 2718780
- Math proficiency
- 48% ▼ -11.00%
- Reading proficiency
- 56% ▼ -8.00%
- Median HH income
- $49,469
- Composite
- 44.36/100
- National rank
- #2819
- State rank
- #98 of 301 in MN
Livability — Mankato
- Score
- 77/100
- State rank
- #133
- US rank
- #2970
Category grades
Schools grade is shown separately in the Schools card above.
Census & demographics
- Census place
- Mankato, MN
- County
- Blue Earth County · 51,585 people
- City population
- 51,585
- Metro
- Mankato, MN
- Population (ZIP)
- 51,585
- Household income
- $69,531
- Rent vs Own
- Severe rent burden
- 2394.0
Population outlook (Blue Earth County) Hauer SSP2
- Today (2025)
- 70,208 people
- By 2030
- 72,708 · +3.6%
- By 2040
- 77,481 · +10.4%
- By 2050
- 82,842 · +18.0%
- By 2075
- 99,990 · +42.4%
- By 2100
- 116,795 · +66.4%
Race, ethnicity, and origin ACS 2023
- Neighborhood character
- Predominantly White (83%)
- Race & ethnicity
- White 83% Black 6% Hispanic / Latino 5% Two or more races 4% Asian 3%
- Common ancestry
- Portuguese 11% Lithuanian 3% Romanian 3%
- Foreign-born
- 8% · Canada, Vietnam, South Korea
- Languages at home
- 90% English-only · Spanish 3% Other Indo-European 1% Vietnamese 1%
Political lean MEDSL · Blue Earth
- 2024 margin
- Toss-up / Even · D 48.3% · R 49.5% · Other 2.1%
- 2008→2024 swing
- -14.2pp toward R · 2008: 12.9pp · 2024: -1.2pp
- All cycles
- 2024: R+1.2 2020: D+4.4 2016: R+3.7 2012: D+9.5 2008: D+12.9
Not yet ingested
- Civics
- —
Market trends
- HPI YoY
- ▼ -192.46%
- Current HPI
- 189.8485
- Rent YoY
- ▲ 8.55%
- Metro
- Mankato, MN
- State GDP YoY
- ▲ 2.41%
- F500 in state
- 34
Industry mix (Fortune 500 HQ in MN)
| Industry | F500 HQs | Revenue |
|---|---|---|
| Healthcare | 2 | $407B |
|
||
| Retail | 2 | $150B |
|
||
| Consumer Goods | 2 | $32B |
|
||
| Industrial Machinery | 2 | $6B |
|
||
| Agriculture | 1 | $40B |
|
||
| Healthcare / Medical Devices | 1 | $32B |
|
||
Price history
+80.7% since first listed10 events — show timeline
- 2026-06-10 Listed $279,900 RASM
- 2026-06-10 Listed $279,900 NORTHSTARMLS as Distributed by MLS Grid
- 2014-09-08 Sold (Public Records) $145,000 Public Records
- 2014-09-04 Sold (MLS) $145,000 LSAR
- 2014-09-04 Sold (MLS) $145,000 RASM
- 2014-09-04 Sold (MLS) $145,000 NORTHSTARMLS as Distributed by MLS Grid
- 2014-08-28 Pending — NORTHSTARMLS as Distributed by MLS Grid
- 2014-07-29 Listed $154,900 NORTHSTARMLS as Distributed by MLS Grid
- 2014-07-29 Listed $154,900 LSAR
- 2014-07-29 Listed $154,900 RASM
Property tax history
+5.6%/yrLatest (2025): $2,540 · +2.3% YoY. Source: county tax records.
Cash-flow waterfall
monthlySold comps — $/sqft
last 12 mo · ≤1 miLoading sold comps…