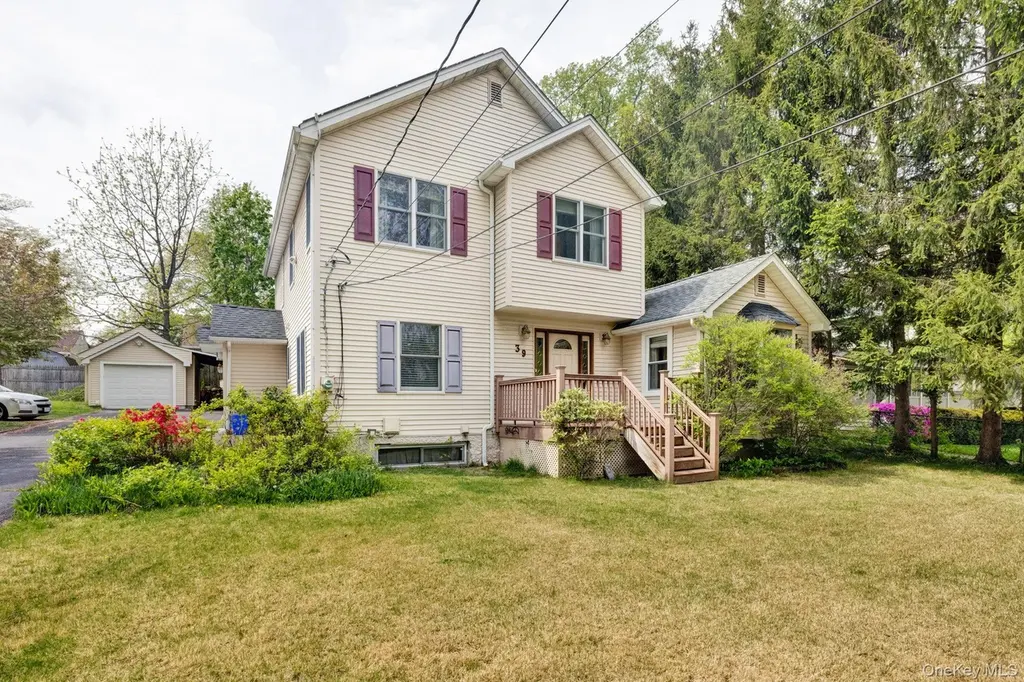
39 Lindbergh Ln · New City, NY
Flood risk 1/10 · Minimal
- FEMA flood zone
- X (unshaded)
- Chance of flooding over 30 yrs
- 0.0%
- Est. flood insurance / yr
- $473 – $860
Fire risk 1/10 · Minimal
- Est. fire insurance / yr
- $691 – $1,283
Heat risk 5/10 · Moderate
- Hot days now (above 98°F)
- 7 days/yr
- Hot days in 30 yrs
- 15 days/yr
Wind risk 5/10 · Moderate
- Chance of severe wind over 30 yrs
- 26.0%
Air-quality risk 4/10 · Minor
- Unhealthy air days now
- 3 days/yr
- Unhealthy air days in 30 yrs
- 6 days/yr
Risk factors via First Street. Map © Google.
Why this score? — see what drove the D grade
The composite is a weighted blend of 9 inputs, each scored 0–100. Each bar is that input's sub-score; the figure is the points it added to the 100-point composite (weight × sub-score).
- ARV discount +14.9/15.0
- Cash flow +8.0/30.0
- Schools +6.9/10.0
- Livability +4.0/5.0
- 1% rule +3.1/10.0
- Rent growth +2.5/5.0
- Condition / age +2.5/5.0
- DSCR +2.0/10.0
- Appreciation +0.0/10.0
$699,000
🖨 Deal sheet (PDF) 📄 Offer letter ✓ Due diligence
Listing remarks
Welcome to 39 Lindbergh Lane, New City — where comfort, efficiency, and thoughtful design come together. Rebuilt in 2010, this 4-bedroom, 3.5-bath Colonial offers the feel of newer construction in a quiet, well-established neighborhood. Zero Step entry. From the moment you come in, you’ll appreciate the layout that just makes sense. The main level features a first-floor bedroom with a full bathroom — ideal for extended family, guests, or even a private home office setup. The living spaces are open and inviting, making it easy to entertain or simply enjoy everyday living. Upstairs, you’ll find generously sized bedrooms, including a primary suite with its own full bath
Key facts
- Quiet street
- Close to restaurants
- Finished basement
Tags
Property features AI
Exterior
- Parking: Carport (1 space); Attached garage (1 space)
- Utilities: Electricity connected (Orange & Rockland); Natural gas connected; Public sewer; Water connected
- Home design: Single-family residence
- Construction: Frame construction
- Exterior features: Frame construction; Not waterfront
Interior
- Kitchen: Cooktop (gas); Gas oven; Microwave; Dishwasher; Refrigerator; Stainless steel appliances
- Bedrooms: Includes a bedroom on the first floor
- Bathrooms: Three full bathrooms; One half bathroom
- Heating & cooling: Baseboard heating (natural gas); Central air conditioning
- Interior features: First-floor bedroom; First-floor full bathroom; Eat-in kitchen; Pull-down attic stairs; Basement access via Bilco doors; Total of 10 rooms
- Laundry & utility: Washer; Dryer; Gas water heater
Neighborhood map
What this means for you Summary
Snapshot
- This is a 4-bed/4.0-bath single-family listed at $699k.
Deal economics
- At list price, monthly cash flow is $-725 ($-9k/yr) — negative.
- To cash-flow at today's rent, offer at most $571k (18.3% below list).
- To meet the 1% rule (rent ≥ 1% of price), the offer needs to be $569k (18.5% below list).
- Recommended offer: $569k (18.5% below list) — sets the bar for 1% rule.
- Cap rate 5.0% vs local median 2.8% in New City — top-decile yield for the area; either an underpriced asset or a hidden risk that comps aren't pricing in. Stress-test before assuming the spread holds.
Location & tenants
- Location reads 80/100 on livability (#111 in NY, #1,835 nationally) — a professional / high-income tenant draw. Strengths: commute A+, employment A+, housing A+; Watch: amenities F, cost of living F.
- Clarkstown Central School District (suburban): math 72% / reading 75% proficiency, ranked #66 of 590 in NY (top 11%) — strong family-tenant draw, lease renewals of 3-5y typical; only 8% free/reduced lunch — higher-income household profile.
- Zoned schools: Link Elementary School (math 67% / reading 72%, grade A-, #447 of 2,108 statewide, top 24%, 370 students, 17% FRL); Felix Festa Achievement Middle School (math 57% / reading 77%, grade A-, #101 of 729 statewide, top 15%, 640 students, 19% FRL); Clarkstown South Senior High School (math 100% / reading 90%, grade A+, #93 of 1,100 statewide, top 10%, 1,345 students, 16% FRL).
- Market conditions: 185 active listings in the ZIP; 3 comparable units currently listed for rent nearby; rentals leasing fast (median 5d on market — plan ~1-2 weeks tenant-placement turnaround); 429 units permitted in Rockland County in 2024 (231 in 5+ unit buildings).
Forward outlook
- Local home prices are declining (-3.0%/yr); year-one equity from $5k of loan paydown is wiped out by about $21k of value loss. Plan a longer hold.
- Rockland County population projected at +7% by 2050 — modest demand growth; plan on rents tracking national, not racing it.
Negotiation context
- It's been on market 51 days — a 3% lower offer ($678k) is reasonable based on typical stale-listing flexibility.
- 2 sale attempts since 29y ago; this cycle's ask has dropped $80k (10%) from the opening price — seller is motivated, your offer sets the floor, not the list.
- Current owner paid $175k; list at $699k implies a 299% gain — meaningful room to come down on a strong offer.
Risks & watch-outs
- Watch-outs: built in 1925 — expect roof / HVAC / electrical / plumbing capex.
- Climate carrying-cost: moderate wind risk, 26% chance of damaging wind over 30y; extreme-heat days projected 7→15/yr by 2055 (HVAC capex compounding) — expect insurance premiums to compound above CPI over the hold.
Questions for the listing agent
- What do current leases actually rent for vs. the listed asking? Can we see a recent rent roll and the last 12 months of T-12 income?
- It's been on market 51 days. Have you received any prior offers? Is the seller open to a 19% concession, seller financing, or rate buy-down credit?
- Built in 1925 — when were the roof, HVAC, electrical panel, plumbing, and water heater last replaced?
- Is there a deadline driving the sale (1031 exchange, divorce, estate, relocation)? That informs how much negotiation room exists.
- Schools are A-rated — typically a magnet for longer-tenancy family renters. What's the average tenant stay here, and is there a school-zone premium baked into asking?
- The area grade is low — what's the realistic commute time and amenity access for the typical tenant pool here? Any planned neighborhood developments (good or bad) we should know about?
- What's the average days-on-market for RENTAL listings here right now (not sales)? A rising rental-DOM trend means longer vacancies and softer asking-rent achievability than the comps imply.
- What's the recent tenant-quality profile in this submarket — average credit score on applications, eviction rate, late-payment / NSF rate, and stable-employment percentage? A property-management company in the area should have these aggregated.
- How much new for-sale + rental construction is in the pipeline within 1–3 miles? Heavy new supply typically softens prices + rents 12–24 months out; constrained supply supports both.
Investment metrics
- 1% rule
- 0.81% ✗
- Cap rate
- 5.05%
- Cash-on-cash
- -4.45%
- DSCR
- 0.80
- GRM
- 10.2
CMA / ARV
- ARV (median comp)
- $837,471
- List price
- $699,000
- Delta
- -16.53%
- Verdict
- UNDERPRICED
- Comps
- 20 within 1.0 mi
Show comp detail 12 sales within ~0.75 mi
| Address | Dist | Beds/Ba | Sqft | Sold | Price | $/sf | Match |
|---|---|---|---|---|---|---|---|
| 5 Park Ter | 0.23mi | 4/2.5 | 2,002 (+4%) | 4mo | $600,000 | $300 | 73 |
| 63 Lindbergh Ln | 0.11mi | 3/3.0 (-1) | 1,780 (-8%) | 6mo | $707,000 | $397 | 68 |
| 122 Birch Ln | 0.21mi | 4/2.5 | 2,067 (+7%) | 5mo | $865,000 | $418 | 68 |
| 46 Red Hill Rd | 0.17mi | 4/2.0 | 1,770 (-8%) | 5mo | $717,500 | $405 | 66 |
| 5 Parker Ave | 0.45mi | 3/3.0 (-1) | 1,793 (-7%) | 4mo | $780,000 | $435 | 55 |
| 49 E Hall Ave | 0.44mi | 4/2.0 | 1,725 (-10%) | 0mo | $740,000 | $429 | 54 |
| 45 Capral Ln | 0.60mi | 4/2.5 | 2,098 (+9%) | 2mo | $850,000 | $405 | 50 |
| 5 Bellows Ln | 0.47mi | 4/2.5 | 1,720 (-11%) | 7mo | $684,000 | $398 | 49 |
| 5 Raven Ter | 0.75mi | 3/2.0 (-1) | 1,883 (-2%) | 2mo | $700,000 | $372 | 47 |
| 69 Carolina Dr | 0.69mi | 4/2.0 | 1,788 (-7%) | 5mo | $729,250 | $408 | 44 |
| 2 Milich Ln | 0.63mi | 3/2.0 (-1) | 1,752 (-9%) | 2mo | $700,000 | $400 | 40 |
| 101 New Valley Rd | 0.60mi | 3/1.5 (-1) | 1,774 (-8%) | 5mo | $600,000 | $338 | 40 |
Match score weights: distance 35% · size 25% · config 20% · recency 20%. Top-matched comps best support the ARV.
Projected returns pro-forma
-3.0% appreciation · 3.0% rent growth · sell at horizon
- IRR
- -23.8%
- Equity multiple
- 0.19×
- Total profit
- $-159,144
- Equity at exit
- $104,223
- IRR
- -18.6%
- Equity multiple
- -0.01×
- Total profit
- $-196,744
- Equity at exit
- $60,437
Cash invested: $195,720 (down + closing). Projections, not guarantees.
Landlord ↔ Tenant lean methodology
- Overall (STATE)
- 15 Strongly Tenant-Friendly
- State New York
- 15 Strongly Tenant-Friendly · D+10
- County
- — inherits STATE
- City
- — inherits STATE
ZIP-level market 10956
- Active inventory
- 185
- Price-to-rent
- 10.2×
Monthly cashflow live
- Estimated rent
- $5,695 medium interval (Pro) →
- Mortgage (P&I)
- −$3,666
- Tax from tax record
- −$1,267 /mo · $15,207/yr
- Insurance
- −$291
- HOA
- −$0
- Vacancy / Maint / Mgmt
- −$1,196
- Net cashflow
- $-725
Break-even live
Sensitivity live
| Price | -10% $-330 | -5% $-528 | +0% $-725 | +5% $-923 | +10% $-1,121 |
|---|---|---|---|---|---|
| Rent | -10% $-1,175 | -5% $-950 | +0% $-725 | +5% $-501 | +10% $-276 |
| Rate | -1.0pp $-373 | -0.5pp $-548 | base $-725 | +0.5pp $-907 | +1.0pp $-1,091 |
UW: 25.0% down · 7.5% · 30yr · 1.5% tax · 5.0% vac · 8.0% maint · 8.0% mgmt
Financing live
Cash to close
- Down payment
- $174,750
- Closing costs
- $20,970
- Reserves months
- —
- Total cash needed
- —
Loan-product check · same deal, 3 products live
Conventional
25% down · 7.5% · 30yr
- Down + closing
- —
- Monthly P&I
- —
- Monthly cashflow
- —
- DSCR
- —
- Eligible?
- —
Personal DTI + credit; lowest rate.
DSCR
20% down · 8.5% · 30yr
- Down + closing
- —
- Monthly P&I
- —
- Monthly cashflow
- —
- DSCR
- —
- Eligible?
- —
No personal income docs; deal must DSCR.
Hard money
10% down · 12.0% · 12mo
- Down + closing
- —
- Monthly P&I
- —
- Monthly cashflow
- —
- DSCR
- —
- Eligible?
- —
Short-term bridge; refi at stabilization.
Rent comps 3 comps
| Address | Beds | Baths | Sqft | Rent | $/sqft | DOM | Units | Dist |
|---|---|---|---|---|---|---|---|---|
| 72 Schriever Ln New City, NY | 4.0 | 2.5 | 2296 | $6,000 | $2.61 | 4d | 1 | 0.37mi |
| 16 Elmwood Dr New City, NY | 3.0 | 2.0 | 1250 | $4,925 | $3.94 | 0d | 1 | 1.22mi |
| 5 Dorchester Ave New City, NY | 4.0 | 3.0 | 2390 | $5,200 | $2.18 | 15d | 1 | 1.39mi |
Listing history 20 events
-
2026-06-21days on market $699,000 Active 51 DOM
-
2026-06-18days on market $699,000 Active 48 DOM
-
2026-06-17days on market $699,000 Active 47 DOM
-
2026-06-16days on market $699,000 Active 46 DOM
-
2026-06-15days on market $699,000 Active 45 DOM
-
2026-06-13days on market $699,000 Active 43 DOM
-
2026-06-09days on market $699,000 Active 39 DOM
-
2026-06-08days on market $699,000 Active 38 DOM
-
2026-06-07days on market $699,000 Active 37 DOM
-
2026-06-04days on market $699,000 Active 34 DOM
-
2026-06-03days on market $699,000 Active 33 DOM
-
2026-06-02days on market $699,000 Active 32 DOM
-
2026-06-01days on market $699,000 Active 31 DOM
-
2026-05-31days on market $699,000 Active 30 DOM
-
2026-05-11price $759,000 1575-char remark
-
2026-05-01$779,000 Active 1575-char remark
-
1998-01-15soldstatus $175,000
-
1997-12-31soldstatus $175,000
-
1997-12-31price $179,900
-
1997-10-28$175,000
ⓘ Source: listings_history table (triggers on properties + properties_extension) + one-shot
backfill from property_details.listing_events for pre-trigger history.
Tax reassessment forecast NY · Partial reset (capped growth)
- Current annual tax
- $15,207 · $1,267/mo
- Projected year-2 tax
- $15,207 · $1,267/mo
- Expected delta
- $0/yr ($0/mo · 0.0%)
ⓘ Screening estimate from a state-policy table — verify with the county assessor before closing.
Climate risk First Street
- Flood 1/10 Low FEMA zone X (unshaded) · 0% chance over 30 yrs
- Wildfire 1/10 Low
- Heat 5/10 Major 7 d/yr ≥98°F today · 15 d/yr by 30 yrs out
- Wind 5/10 Major 26% chance of damaging wind over 30 yrs
- Air quality 4/10 Moderate 3 unhealthy d/yr today · 6 by 30 yrs out
Nearby sold comps map
Loading sold comps map…
Walkable amenities ~0.75 mi
Loading nearby amenities…
Taxation est. · year 1
- Rental income
- $68,334
- − Mortgage interest
- −$39,155
- − Property taxes
- −$15,207
- − Insurance
- −$3,495
- − Repairs & maintenance
- −$5,467
- − Management
- −$5,467
- − Depreciation
- −$20,335
- Taxable loss
- −$20,790
- Est. tax savings @ 24.0%
- +$4,990
- After-tax cash flow
- $-3,716/yr
For passive investors: Depreciation is non-cash, so a rental often shows a tax loss while cash-flowing — sheltering income. Rental losses are passive: they offset passive income freely, and up to $25,000/yr can offset ordinary (W-2) income if you actively participate and your MAGI is under $100k (phasing out to $0 by $150k); unused losses carry forward. On sale, claimed depreciation is recaptured at up to 25%, and gains may owe capital-gains tax (a 1031 exchange can defer both). Figures are a year-1 estimate at your 24.0% rate — not tax advice; consult a CPA.
Schools (NCES district)
- District
- Clarkstown Central School District
- NCES district ID
- 3620340
- Math proficiency
- 72% ▼ -1.00%
- Reading proficiency
- 75% ▲ 6.00%
- Median HH income
- $115,765
- Composite
- 68.55/100
- National rank
- #342
- State rank
- #66 of 590 in NY
Livability — New City
- Score
- 80/100
- State rank
- #111
- US rank
- #1835
Category grades
Schools grade is shown separately in the Schools card above.
Census & demographics
- Census place
- New City, NY
- City population
- 31,420
- Population (ZIP)
- 31,420
Population outlook (Rockland County) Hauer SSP2
- Today (2025)
- 339,642 people
- By 2030
- 345,987 · +1.9%
- By 2040
- 357,178 · +5.2%
- By 2050
- 362,456 · +6.7%
- By 2075
- 367,281 · +8.1%
- By 2100
- 328,211 · -3.4%
Race, ethnicity, and origin ACS 2023
- Neighborhood character
- Diverse neighborhood (Simpson 0.60)
- Race & ethnicity
- White 58% Hispanic / Latino 19% Asian 13% Two or more races 10% Black 6%
- Hispanic origin (detail)
- Puerto Rican 7% Dominican 5%
- Common ancestry
- Romanian 4% Scotch-Irish 4% Italian 1%
- Foreign-born
- 23% · Canada, China, South Korea
- Languages at home
- 68% English-only · Spanish 13% Other Indo-European 5% Other Asian/Pacific 4%
Political lean MEDSL · Rockland
- 2024 margin
- R (+11.8) · D 44.1% · R 55.9%
- 2008→2024 swing
- -17.7pp toward R · 2008: 5.9pp · 2024: -11.8pp
- All cycles
- 2024: R+11.8 2020: D+1.7 2016: D+5.1 2012: D+6.6 2008: D+5.9
Not yet ingested
- Civics
- —
Market trends
- HPI YoY
- ▼ -530.90%
- Current HPI
- 261.6277
- Rent YoY
- —
- Metro
- —
- State GDP YoY
- ▲ 2.60%
- F500 in state
- 92
Industry mix (Fortune 500 HQ in NY)
| Industry | F500 HQs | Revenue |
|---|---|---|
| Financial Services | 10 | $950B |
|
||
| Consumer Goods | 9 | $162B |
|
||
| Insurance | 4 | $225B |
|
||
| Telecommunications | 2 | $144B |
|
||
| Pharmaceuticals | 2 | $112B |
|
||
| Media / Entertainment | 2 | $69B |
|
||
Price history
+299.4% since first listed7 events — show timeline
- 2026-05-22 Price Changed $699,000 OneKey® MLS as Distributed by MLS Grid
- 2026-05-11 Price Changed $759,000 OneKey® MLS as Distributed by MLS Grid
- 2026-05-01 Listed $779,000 OneKey® MLS as Distributed by MLS Grid
- 1998-01-15 Sold (Public Records) $175,000 Public Records
- 1997-12-31 Price Changed $179,900 HGMLS
- 1997-12-31 Sold (MLS) $175,000 HGMLS
- 1997-10-28 Listed $175,000 HGMLS
Property tax history
+3.2%/yrLatest (2025): $15,207 · +2.3% YoY. Source: county tax records.
Cash-flow waterfall
monthlySold comps — $/sqft
last 12 mo · ≤1 miLoading sold comps…