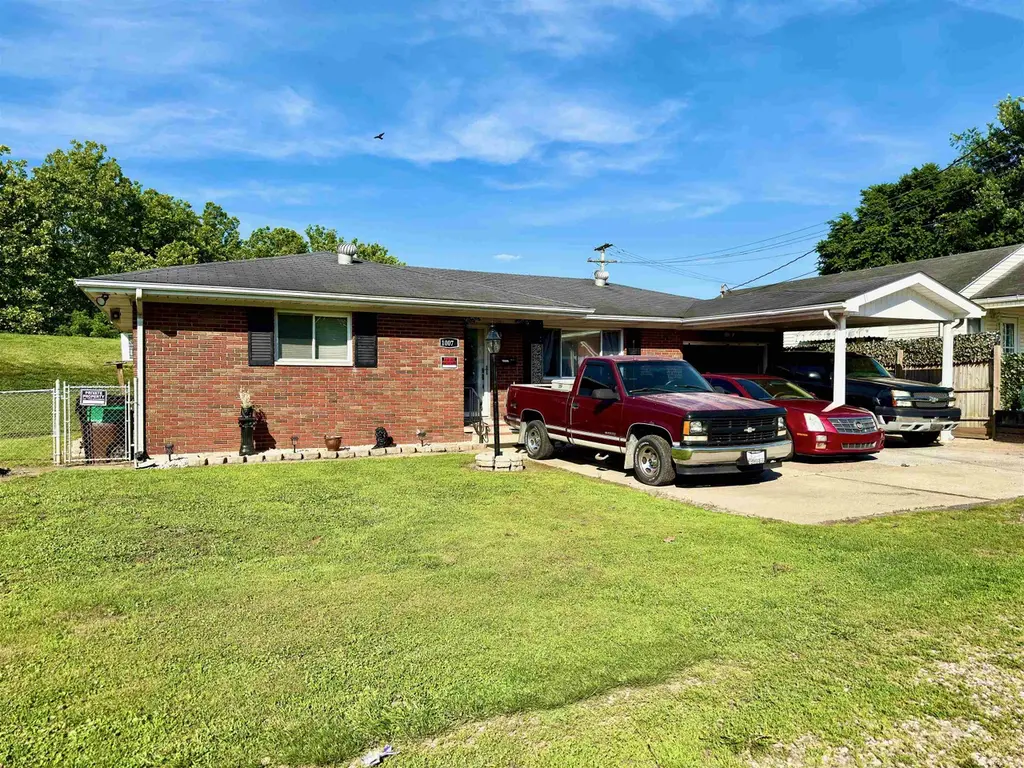
1007 N 5th St · Ironton, OH
Flood risk 1/10 · Minimal
- FEMA flood zone
- X
- Chance of flooding over 30 yrs
- 0.0%
- Est. flood insurance / yr
- $507 – $1,088
Fire risk 5/10 · Moderate
- Est. fire insurance / yr
- $713 – $1,323
Heat risk 5/10 · Moderate
- Hot days now (above 102°F)
- 7 days/yr
- Hot days in 30 yrs
- 19 days/yr
Wind risk 2/10 · Minimal
- Chance of severe wind over 30 yrs
- 2.0%
Air-quality risk 2/10 · Minimal
- Unhealthy air days now
- 0 days/yr
- Unhealthy air days in 30 yrs
- 2 days/yr
Risk factors via First Street. Map © Google.
Why this score? — see what drove the D grade
The composite is a weighted blend of 9 inputs, each scored 0–100. Each bar is that input's sub-score; the figure is the points it added to the 100-point composite (weight × sub-score).
- Cash flow +12.9/30.0
- ARV discount +11.5/15.0
- Schools +4.6/10.0
- DSCR +3.9/10.0
- Livability +3.6/5.0
- 1% rule +3.0/10.0
- Rent growth +2.5/5.0
- Condition / age +2.5/5.0
- Appreciation +0.0/10.0
$119,900
🖨 Deal sheet (PDF) 📄 Offer letter ✓ Due diligence
Listing remarks MLS
Come inside this brick ranch and find two bedrooms, open concept in kitchen and dining area with bar joining the two rooms and one bath. You have a one car attached garage, fenced side and backyard and central heat and air. New carpet at closing per the seller. Call today!
Key facts
- Single floor plan
- Backyard oasis
- Generous living room
Tags
Property features AI
Exterior
- Parking: 1-car garage; Off-street parking
- Security: Security system
- Utilities: Public water; Public sewer
- Home design: Single family residence; Residential property; Single-story
- Construction: Shingle roof
- Exterior features: Patio; Chain link fence; Level lot
Interior
- Kitchen: Dishwasher; Range; Oven; Refrigerator
- Bathrooms: 1 full bathroom
- Heating & cooling: Central heating (natural gas); Central air conditioning
- Interior features: Dishwasher; Range; Oven; Refrigerator; Crawl space basement
Neighborhood map
What this means for you Summary
Snapshot
- This is a 2-bed/1.0-bath single-family listed at $120k.
Deal economics
- At list price, monthly cash flow is $-9 ($-102/yr) — negative.
- To cash-flow at today's rent, offer at most $118k (1.3% below list).
- To meet the 1% rule (rent ≥ 1% of price), the offer needs to be $96k (20.0% below list).
- Recommended offer: $96k (20.0% below list) — sets the bar for 1% rule.
- Cap rate 6.2% vs local median 5.1% in Ironton — meaningfully above typical; check what's discounted (condition, days-on-market, listing class) to confirm the premium yield is real.
Location & tenants
- Location reads 72/100 on livability (#354 in OH) — a middle-class / working-renter tenant base. Strengths: cost of living A+, health & safety A+, housing A-; Watch: amenities F, commute F, employment D-.
- Ironton City School District (suburban): math 54% / reading 58% proficiency, ranked #382 of 656 in OH (top 58%) — acceptable for families but not a draw, mixed tenant base, ~2y average lease.
- Market conditions: 84 active listings in the ZIP; 18 units permitted in Lawrence County in 2024 (0 in 5+ unit buildings).
Forward outlook
- Local home prices are declining (-3.0%/yr); year-one equity from $829 of loan paydown is wiped out by about $4k of value loss. Plan a longer hold.
- Lawrence County population projected at -22% by 2050 — secular population decline; favor cash flow + early exit over multi-decade hold.
Negotiation context
- Only 4 days on market — expect competitive offers; lowballing is unlikely to land.
- 2 sale attempts since 9y ago with the ask held roughly flat each time — persistent listings suggest the price (not the market) is what's stuck; bring a comps-based counter.
- Current owner paid $62k; list at $120k implies a 93% gain — meaningful room to come down on a strong offer.
Risks & watch-outs
- Climate carrying-cost: moderate wildfire risk; extreme-heat days projected 7→19/yr by 2055 (HVAC capex compounding) — expect insurance premiums to compound above CPI over the hold.
Questions for the listing agent
- What do current leases actually rent for vs. the listed asking? Can we see a recent rent roll and the last 12 months of T-12 income?
- Built in 1963 — when were the roof, HVAC, electrical panel, plumbing, and water heater last replaced?
- Is there a deadline driving the sale (1031 exchange, divorce, estate, relocation)? That informs how much negotiation room exists.
- Schools are B-rated — typically a magnet for longer-tenancy family renters. What's the average tenant stay here, and is there a school-zone premium baked into asking?
- The area grade is low — what's the realistic commute time and amenity access for the typical tenant pool here? Any planned neighborhood developments (good or bad) we should know about?
- What's the average days-on-market for RENTAL listings here right now (not sales)? A rising rental-DOM trend means longer vacancies and softer asking-rent achievability than the comps imply.
- What's the recent tenant-quality profile in this submarket — average credit score on applications, eviction rate, late-payment / NSF rate, and stable-employment percentage? A property-management company in the area should have these aggregated.
- How much new for-sale + rental construction is in the pipeline within 1–3 miles? Heavy new supply typically softens prices + rents 12–24 months out; constrained supply supports both.
Investment metrics
- 1% rule
- 0.80% ✗
- Cap rate
- 6.21%
- Cash-on-cash
- -0.30%
- DSCR
- 0.99
- GRM
- 10.4
CMA / ARV
- ARV (on-the-fly)
- $131,572
- Comps found
- 8
Show comp detail 8 sales within ~0.75 mi
| Address | Dist | Beds/Ba | Sqft | Sold | Price | $/sf | Match |
|---|---|---|---|---|---|---|---|
| 922 N 5th Street St | 0.04mi | 2/1.0 | 1,094 (+6%) | 4mo | $138,900 | $127 | 85 |
| 809 N 5th St | 0.17mi | 2/1.0 | 988 (-5%) | 3mo | $125,000 | $127 | 82 |
| 1014 N 3rd St | 0.23mi | 2/1.0 | 988 (-5%) | 21mo | $16,000 | $16 | 64 |
| 930 N 3rd St | 0.21mi | 2/2.0 | 901 (-13%) | 15mo | $119,000 | $132 | 52 |
| 1529 Karin St | 0.67mi | 3/1.0 (+1) | 988 (-5%) | 9mo | $143,000 | $145 | 49 |
| 901 Elmwood Avenue St | 0.72mi | 2/1.0 | 1,045 (+1%) | 23mo | $72,000 | $69 | 46 |
| 1513 Karin St St | 0.57mi | 3/1.0 (+1) | 1,152 (+11%) | 8mo | $195,000 | $169 | 43 |
| 1504 Karin St | 0.53mi | 3/1.0 (+1) | 1,164 (+12%) | 14mo | $118,000 | $101 | 38 |
Match score weights: distance 35% · size 25% · config 20% · recency 20%. Top-matched comps best support the ARV.
Projected returns pro-forma
-3.0% appreciation · 3.0% rent growth · sell at horizon
- IRR
- -16.8%
- Equity multiple
- 0.40×
- Total profit
- $-19,996
- Equity at exit
- $17,877
- IRR
- -8.7%
- Equity multiple
- 0.46×
- Total profit
- $-18,208
- Equity at exit
- $10,367
Cash invested: $33,572 (down + closing). Projections, not guarantees.
Landlord ↔ Tenant lean methodology
- Overall (STATE)
- 73 Landlord-Friendly
- State Ohio
- 73 Landlord-Friendly · R+6
- County
- — inherits STATE
- City
- — inherits STATE
ZIP-level market 45638
- Home prices YoY
- -19.6%
- Active inventory
- 84
- Price-to-rent
- 10.4×
Monthly cashflow live
- Estimated rent
- $959 medium interval (Pro) →
- Mortgage (P&I)
- −$629
- Tax from tax record
- −$88 /mo · $1,051/yr
- Insurance
- −$50
- HOA
- −$0
- Vacancy / Maint / Mgmt
- −$201
- Net cashflow
- $-9
Break-even live
Sensitivity live
| Price | -10% $59 | -5% $25 | +0% $-9 | +5% $-42 | +10% $-76 |
|---|---|---|---|---|---|
| Rent | -10% $-84 | -5% $-46 | +0% $-9 | +5% $29 | +10% $67 |
| Rate | -1.0pp $52 | -0.5pp $22 | base $-9 | +0.5pp $-40 | +1.0pp $-71 |
UW: 25.0% down · 7.5% · 30yr · 1.5% tax · 5.0% vac · 8.0% maint · 8.0% mgmt
Financing live
Cash to close
- Down payment
- $29,975
- Closing costs
- $3,597
- Reserves months
- —
- Total cash needed
- —
Loan-product check · same deal, 3 products live
Conventional
25% down · 7.5% · 30yr
- Down + closing
- —
- Monthly P&I
- —
- Monthly cashflow
- —
- DSCR
- —
- Eligible?
- —
Personal DTI + credit; lowest rate.
DSCR
20% down · 8.5% · 30yr
- Down + closing
- —
- Monthly P&I
- —
- Monthly cashflow
- —
- DSCR
- —
- Eligible?
- —
No personal income docs; deal must DSCR.
Hard money
10% down · 12.0% · 12mo
- Down + closing
- —
- Monthly P&I
- —
- Monthly cashflow
- —
- DSCR
- —
- Eligible?
- —
Short-term bridge; refi at stabilization.
Listing history 5 events
-
2026-06-12statusdays on market $119,900 Pending 4 DOM
-
2026-06-09days on market $119,900 Active 3 DOM
-
2026-06-08days on market $119,900 Active 2 DOM
-
2026-06-07remarks 547-char remark
-
2026-06-07$119,900 Active 1 DOM
ⓘ Source: listings_history table (triggers on properties + properties_extension) + one-shot
backfill from property_details.listing_events for pre-trigger history.
Tax reassessment forecast OH · Partial reset (capped growth)
- Current annual tax
- $1,051 · $88/mo
- Projected year-2 tax
- $1,461 · $122/mo
- Expected delta
- +$410/yr (+$34/mo · 39.0%)
ⓘ Screening estimate from a state-policy table — verify with the county assessor before closing.
Climate risk First Street
- Flood 1/10 Low FEMA zone X · 0% chance over 30 yrs
- Wildfire 5/10 Major
- Heat 5/10 Major 7 d/yr ≥102°F today · 19 d/yr by 30 yrs out
- Wind 2/10 Low 2% chance of damaging wind over 30 yrs
- Air quality 2/10 Low 0 unhealthy d/yr today · 2 by 30 yrs out
Nearby sold comps map
Loading sold comps map…
Walkable amenities ~0.75 mi
Loading nearby amenities…
Taxation est. · year 1
- Rental income
- $11,511
- − Mortgage interest
- −$6,716
- − Property taxes
- −$1,051
- − Insurance
- −$600
- − Repairs & maintenance
- −$921
- − Management
- −$921
- − Depreciation
- −$3,488
- Taxable loss
- −$2,186
- Est. tax savings @ 24.0%
- +$525
- After-tax cash flow
- $422/yr
For passive investors: Depreciation is non-cash, so a rental often shows a tax loss while cash-flowing — sheltering income. Rental losses are passive: they offset passive income freely, and up to $25,000/yr can offset ordinary (W-2) income if you actively participate and your MAGI is under $100k (phasing out to $0 by $150k); unused losses carry forward. On sale, claimed depreciation is recaptured at up to 25%, and gains may owe capital-gains tax (a 1031 exchange can defer both). Figures are a year-1 estimate at your 24.0% rate — not tax advice; consult a CPA.
Schools (NCES district)
- District
- Ironton City School District
- NCES district ID
- 3904414
- Math proficiency
- 54% ▼ -10.00%
- Reading proficiency
- 58% ▼ -7.00%
- Median HH income
- $32,999
- Composite
- 46.13/100
- National rank
- #2505
- State rank
- #382 of 656 in OH
Livability — Ironton
- Score
- 72/100
- State rank
- #354
- US rank
- #5718
Category grades
Schools grade is shown separately in the Schools card above.
Census & demographics
- Census place
- Ironton, OH
- County
- Lawrence · 57,020 people
- Metro
- Huntington-Ashland, WV-KY-OH
- Population (ZIP)
- 19,921
- Household income
- $49,544
- Rent vs Own
- Severe rent burden
- 10.7
Population outlook (Lawrence County) Hauer SSP2
- Today (2025)
- 57,915 people
- By 2030
- 55,650 · -3.9%
- By 2040
- 50,523 · -12.8%
- By 2050
- 45,103 · -22.1%
- By 2075
- 32,441 · -44.0%
- By 2100
- 21,754 · -62.4%
Race, ethnicity, and origin ACS 2023
- Neighborhood character
- Predominantly White (95%)
- Race & ethnicity
- White 95% Two or more races 3% Black 1%
- Common ancestry
- Slovak 2% Iranian 2% Lithuanian 1%
- Foreign-born
- 0%
Political lean MEDSL · Lawrence
- 2024 margin
- Solid R (+50.5) · D 24.4% · R 74.9%
- 2008→2024 swing
- -35.2pp toward R · 2008: -15.3pp · 2024: -50.5pp
- All cycles
- 2024: R+50.5 2020: R+45.6 2016: R+43.9 2012: R+15.5 2008: R+15.3
Not yet ingested
- Civics
- —
Market trends
- HPI YoY
- ▼ -48.00%
- Current HPI
- 196.7459
- Rent YoY
- —
- Metro
- —
- State GDP YoY
- ▲ 1.98%
- F500 in state
- 48
Industry mix (Fortune 500 HQ in OH)
| Industry | F500 HQs | Revenue |
|---|---|---|
| Insurance | 3 | $145B |
|
||
| Industrial Machinery | 3 | $49B |
|
||
| Financial Services | 3 | $24B |
|
||
| Consumer Goods | 2 | $93B |
|
||
| Aerospace / Defense | 2 | $47B |
|
||
| Utilities | 2 | $33B |
|
||
Price history
+233.1% since first listed5 events — show timeline
- 2026-06-05 Listed $119,900 HBRMLS
- 2017-05-24 Sold (Public Records) $62,040 Public Records
- 2017-05-23 Sold (MLS) $66,000 AABOR
- 2017-02-17 Listed $72,500 AABOR
- 1985-03-19 Sold (Public Records) $36,000 Public Records
Property tax history
+4.5%/yrLatest (2025): $1,051 · +14.5% YoY. Source: county tax records.
Cash-flow waterfall
monthlySold comps — $/sqft
last 12 mo · ≤1 miLoading sold comps…