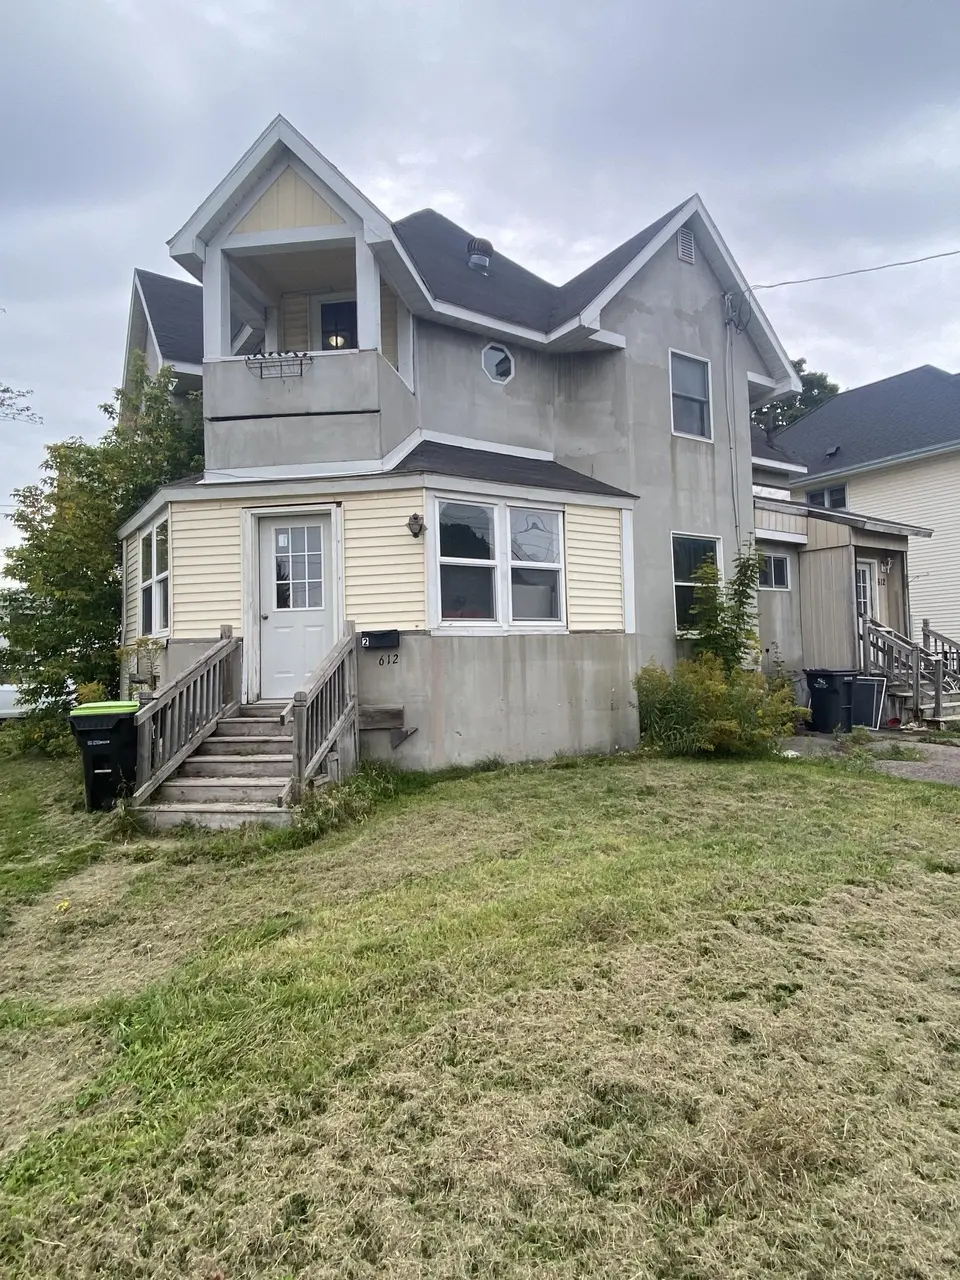
612 Kimball St · Sault Ste. Marie, MI
Flood risk 1/10 · Minimal
- FEMA flood zone
- X (unshaded)
- Chance of flooding over 30 yrs
- 0.0%
- Est. flood insurance / yr
- $507 – $1,088
Fire risk 1/10 · Minimal
- Est. fire insurance / yr
- $784 – $1,456
Heat risk 1/10 · Minimal
- Hot days now (above 88°F)
- 7 days/yr
- Hot days in 30 yrs
- 14 days/yr
Wind risk 1/10 · Minimal
- Chance of severe wind over 30 yrs
- —
Air-quality risk 1/10 · Minimal
- Unhealthy air days now
- 0 days/yr
- Unhealthy air days in 30 yrs
- 0 days/yr
Risk factors via First Street. Map © Google.
Why this score? — see what drove the C+ grade
The composite is a weighted blend of 9 inputs, each scored 0–100. Each bar is that input's sub-score; the figure is the points it added to the 100-point composite (weight × sub-score).
- Cash flow +27.1/30.0
- DSCR +9.4/10.0
- ARV discount +7.5/15.0
- 1% rule +7.0/10.0
- Schools +3.3/10.0
- Rent growth +2.5/5.0
- Livability +2.5/5.0
- Condition / age +2.5/5.0
- Appreciation +0.0/10.0
$120,000
🖨 Deal sheet 📄 Offer letter ✓ Due diligence
Listing remarks MLS
This duplex is in very good condition an would make Ownership very affordable. Rent out one unit and live economically in other. Each unit has 2 bedrooms , kitchen, living room a mud room and utility room with washer and dryer. Unit 1 down , unit 2 up. Building also has full basement , for access to updated electric panel and storage.
Key facts
- Built 1900
- Listed 274 days
Neighborhood map
What this means for you Summary
Snapshot
- This is a 4-bed/2.0-bath single-family listed at $120k.
Deal economics
- At list price, monthly cash flow is $340 ($4k/yr) — positive.
- The deal already cash-flows at list — no discount required.
- Meets the 1% rule at list price ($1k rent vs $120k).
- Recommended offer: $106k (12.0% below list) — sets the bar for market timing.
- Cap rate 9.7% vs local median 4.5% in Sault Ste. Marie — top-decile yield for the area; either an underpriced asset or a hidden risk that comps aren't pricing in. Stress-test before assuming the spread holds.
Location & tenants
- Location reads: area grade C — affects rentability + tenant quality, not the cash-flow math above.
- Sault Ste. Marie Area Schools (town): math 35% / reading 44% proficiency, ranked #230 of 540 in MI (top 43%) — families likely to look elsewhere, expect single-tenant / working-renter base with shorter leases.
- Market conditions: 125 active listings in the ZIP; 92 units permitted in Chippewa County in 2024 (40 in 5+ unit buildings).
Forward outlook
- Local home prices are declining (-3.0%/yr); year-one equity from $830 of loan paydown is wiped out by about $4k of value loss. Plan a longer hold.
- Chippewa County population projected at -10% by 2050 — secular population decline; favor cash flow + early exit over multi-decade hold.
- At projected returns (-3.0% appreciation + 3.0% rent growth), your $34k cash investment doubles in ~10 years — after that, you're playing with house money.
Negotiation context
- It's been on market 275 days — a 12% lower offer ($106k) is reasonable based on typical stale-listing flexibility.
Risks & watch-outs
- Watch-outs: built in 1900 — expect roof / HVAC / electrical / plumbing capex.
Questions for the listing agent
- It's been on market 275 days. Have you received any prior offers? Is the seller open to a 12% concession, seller financing, or rate buy-down credit?
- Built in 1900 — when were the roof, HVAC, electrical panel, plumbing, and water heater last replaced?
- Why hasn't it sold? Are there any deal-killer items the seller is aware of (foundation, flood, title, zoning, code violations)?
- Is there a deadline driving the sale (1031 exchange, divorce, estate, relocation)? That informs how much negotiation room exists.
- What's the average days-on-market for RENTAL listings here right now (not sales)? A rising rental-DOM trend means longer vacancies and softer asking-rent achievability than the comps imply.
- What's the recent tenant-quality profile in this submarket — average credit score on applications, eviction rate, late-payment / NSF rate, and stable-employment percentage? A property-management company in the area should have these aggregated.
- How much new for-sale + rental construction is in the pipeline within 1–3 miles? Heavy new supply typically softens prices + rents 12–24 months out; constrained supply supports both.
Investment metrics
- 1% rule
- 1.20% ✓
- Cap rate
- 9.70%
- Cash-on-cash
- 12.15%
- DSCR
- 1.54
- GRM
- 7.0
CMA / ARV
- ARV (median comp)
- $77,573
- List price
- $120,000
- Delta
- 54.69%
- Verdict
- OVERPRICED
- Comps
- 12 within 1.0 mi
Show comp detail 12 sales within ~0.75 mi
| Address | Dist | Beds/Ba | Sqft | Sold | Price | $/sf | Match |
|---|---|---|---|---|---|---|---|
| 914 Bingham Ave | 0.42mi | 4/1.5 | 1,680 (-1%) | 9mo | $159,000 | $95 | 70 |
| 920 Superior St | 0.36mi | 4/2.0 | 1,605 (-5%) | 6mo | $230,000 | $143 | 69 |
| 1211 Augusta St | 0.57mi | 3/2.0 (-1) | 1,700 (+0%) | 3mo | $230,000 | $135 | 65 |
| 217 Hursley St | 0.24mi | 3/1.5 (-1) | 1,616 (-4%) | 13mo | $198,500 | $123 | 64 |
| 805 E Spruce St | 0.60mi | 4/2.0 | 1,696 (+0%) | 13mo | $302,500 | $178 | 61 |
| 533 Maple St | 0.35mi | 4/2.0 | 1,536 (-9%) | 11mo | $229,000 | $149 | 59 |
| 403 Pine St | 0.57mi | 3/1.0 (-1) | 1,624 (-4%) | 1mo | $199,500 | $123 | 57 |
| 323 Emmett St | 0.72mi | 4/2.0 | 1,600 (-5%) | 9mo | $269,900 | $169 | 50 |
| 1203 Seymour St | 0.58mi | 3/2.0 (-1) | 1,530 (-10%) | 3mo | $209,000 | $137 | 49 |
| 811 Young St | 0.30mi | 4/1.0 | 1,449 (-14%) | 11mo | $99,900 | $69 | 49 |
| 1100 Davitt St | 0.68mi | 5/2.5 (+1) | 1,808 (+7%) | 3mo | $350,000 | $194 | 47 |
| 423 W Easterday Ave | 0.74mi | 4/1.5 | 1,455 (-14%) | 10mo | $220,000 | $151 | 32 |
Match score weights: distance 35% · size 25% · config 20% · recency 20%. Top-matched comps best support the ARV.
Projected returns pro-forma
-3.0% appreciation · 3.0% rent growth · sell at horizon
- IRR
- 1.7%
- Equity multiple
- 1.07×
- Total profit
- $2,226
- Equity at exit
- $17,892
- IRR
- 11.3%
- Equity multiple
- 1.89×
- Total profit
- $29,844
- Equity at exit
- $10,375
Cash invested: $33,600 (down + closing). Projections, not guarantees.
Landlord ↔ Tenant lean methodology
- Overall (STATE)
- 62 Landlord-Friendly
- State Michigan
- 62 Landlord-Friendly · EVEN
- County
- — inherits STATE
- City
- — inherits STATE
ZIP-level market 49783
- Active inventory
- 125
- Price-to-rent
- 7.0×
Monthly cashflow live
- Estimated rent
- $1,436 medium interval (Pro) →
- Mortgage (P&I)
- −$629
- Tax from tax record
- −$115 /mo · $1,377/yr
- Insurance
- −$50
- HOA
- −$0
- Vacancy / Maint / Mgmt
- −$302
- Net cashflow
- $340
Break-even live
UW: 25.0% down · 7.5% · 30yr · 1.5% tax · 5.0% vac · 8.0% maint · 8.0% mgmt
Financing live
Cash to close
- Down payment
- $30,000
- Closing costs
- $3,600
- Reserves months
- —
- Total cash needed
- —
Loan-product check · same deal, 3 products live
Conventional
25% down · 7.5% · 30yr
- Down + closing
- —
- Monthly P&I
- —
- Monthly cashflow
- —
- DSCR
- —
- Eligible?
- —
Personal DTI + credit; lowest rate.
DSCR
20% down · 8.5% · 30yr
- Down + closing
- —
- Monthly P&I
- —
- Monthly cashflow
- —
- DSCR
- —
- Eligible?
- —
No personal income docs; deal must DSCR.
Hard money
10% down · 12.0% · 12mo
- Down + closing
- —
- Monthly P&I
- —
- Monthly cashflow
- —
- DSCR
- —
- Eligible?
- —
Short-term bridge; refi at stabilization.
Listing history 20 events
-
2026-06-18days on market $120,000 Active 275 DOM
-
2026-06-17days on market $120,000 Active 274 DOM
-
2026-06-16days on market $120,000 Active 273 DOM
-
2026-06-15days on market $120,000 Active 272 DOM
-
2026-06-13days on market $120,000 Active 270 DOM
-
2026-06-12days on market $120,000 Active 269 DOM
-
2026-06-09days on market $120,000 Active 266 DOM
-
2026-06-08days on market $120,000 Active 265 DOM
-
2026-06-07days on market $120,000 Active 264 DOM
-
2026-06-07days on market $120,000 Active 263 DOM
-
2026-06-04days on market $120,000 Active 260 DOM
-
2026-06-02days on market $120,000 Active 259 DOM
-
2026-06-01price $120,000 Active 258 DOM
-
2026-06-01days on market $129,000 Active 258 DOM
-
2026-05-31days on market $129,000 Active 257 DOM
-
2026-05-31days on market $129,000 Active 256 DOM
-
2026-04-20price $129,000 336-char remark
Show marketing remark (336 chars)
This duplex is in very good condition an would make Ownership very affordable. Rent out one unit and live economically in other. Each unit has 2 bedrooms , kitchen, living room a mud room and utility room with washer and dryer. Unit 1 down , unit 2 up. Building also has full basement , for access to updated electric panel and storage.
-
2026-01-17price $134,000 336-char remark
Show marketing remark (336 chars)
This duplex is in very good condition an would make Ownership very affordable. Rent out one unit and live economically in other. Each unit has 2 bedrooms , kitchen, living room a mud room and utility room with washer and dryer. Unit 1 down , unit 2 up. Building also has full basement , for access to updated electric panel and storage.
-
2025-10-31price $137,500 336-char remark
Show marketing remark (336 chars)
This duplex is in very good condition an would make Ownership very affordable. Rent out one unit and live economically in other. Each unit has 2 bedrooms , kitchen, living room a mud room and utility room with washer and dryer. Unit 1 down , unit 2 up. Building also has full basement , for access to updated electric panel and storage.
-
2025-09-16$140,000 Active 336-char remark
Show marketing remark (336 chars)
This duplex is in very good condition an would make Ownership very affordable. Rent out one unit and live economically in other. Each unit has 2 bedrooms , kitchen, living room a mud room and utility room with washer and dryer. Unit 1 down , unit 2 up. Building also has full basement , for access to updated electric panel and storage.
ⓘ Source: listings_history table (triggers on properties + properties_extension) + one-shot
backfill from property_details.listing_events for pre-trigger history.
Tax reassessment forecast MI · Partial reset (capped growth)
- Current annual tax
- $1,377 · $115/mo
- Projected year-2 tax
- $1,613 · $134/mo
- Expected delta
- +$235/yr (+$20/mo · 17.1%)
ⓘ Screening estimate from a state-policy table — verify with the county assessor before closing.
Climate risk First Street
- Flood 1/10 Low FEMA zone X (unshaded) · 0% chance over 30 yrs
- Wildfire 1/10 Low
- Heat 1/10 Low 7 d/yr ≥88°F today · 14 d/yr by 30 yrs out
- Wind 1/10 Low
- Air quality 1/10 Low 0 unhealthy d/yr today · 0 by 30 yrs out
Nearby sold comps map
Loading sold comps map…
Walkable amenities ~0.75 mi
Loading nearby amenities…
Taxation est. · year 1
- Rental income
- $17,230
- − Mortgage interest
- −$6,722
- − Property taxes
- −$1,377
- − Insurance
- −$600
- − Repairs & maintenance
- −$1,378
- − Management
- −$1,378
- − Depreciation
- −$3,491
- Taxable income
- $2,283
- Est. tax owed @ 24.0%
- −$548
- After-tax cash flow
- $3,535/yr
For passive investors: Depreciation is non-cash, so a rental often shows a tax loss while cash-flowing — sheltering income. Rental losses are passive: they offset passive income freely, and up to $25,000/yr can offset ordinary (W-2) income if you actively participate and your MAGI is under $100k (phasing out to $0 by $150k); unused losses carry forward. On sale, claimed depreciation is recaptured at up to 25%, and gains may owe capital-gains tax (a 1031 exchange can defer both). Figures are a year-1 estimate at your 24.0% rate — not tax advice; consult a CPA.
Schools (NCES district)
- District
- Sault Ste. Marie Area Schools
- NCES district ID
- 2630990
- Math proficiency
- 35% ▼ -9.00%
- Reading proficiency
- 44% ▼ -12.00%
- Median HH income
- $40,273
- Composite
- 33.12/100
- National rank
- #5559
- State rank
- #230 of 540 in MI
Livability — Sault Ste. Marie
No livability data for this city. (Only ~50 U.S. cities are tracked.)
Census & demographics
- Census place
- Sault Ste. Marie, MI
- Population (ZIP)
- 18,778
Population outlook (Chippewa County) Hauer SSP2
- Today (2025)
- 37,043 people
- By 2030
- 36,431 · -1.7%
- By 2040
- 34,911 · -5.8%
- By 2050
- 33,350 · -10.0%
- By 2075
- 29,789 · -19.6%
- By 2100
- 24,171 · -34.7%
Race, ethnicity, and origin ACS 2023
- Neighborhood character
- Predominantly White (70%)
- Race & ethnicity
- White 70% Native American 14% Two or more races 13% Hispanic / Latino 2%
- Common ancestry
- Lithuanian 6% Romanian 6% Slovak 4%
- Foreign-born
- 4% · Canada, Vietnam, Guatemala
- Languages at home
- 95% English-only · Spanish 1% Other Indo-European 1% German/W. Germanic 1%
Political lean MEDSL · Chippewa
- 2024 margin
- Strong R (+24.2) · D 37.0% · R 61.3% · Other 1.7%
- 2008→2024 swing
- -23.8pp toward R · 2008: -0.5pp · 2024: -24.2pp
- All cycles
- 2024: R+24.2 2020: R+22.9 2016: R+24.2 2012: R+7.6 2008: R+0.5
Not yet ingested
- Civics
- —
Market trends
- HPI YoY
- ▼ -183.63%
- Current HPI
- 149.9878
- Rent YoY
- —
- Metro
- —
- State GDP YoY
- ▲ 1.37%
- F500 in state
- 28
Industry mix (Fortune 500 HQ in MI)
| Industry | F500 HQs | Revenue |
|---|---|---|
| Automotive Parts | 3 | $48B |
|
||
| Automotive | 2 | $372B |
|
||
| Chemicals | 1 | $45B |
|
||
| Automotive Retail | 1 | $29B |
|
||
| Healthcare / Medical Devices | 1 | $23B |
|
||
| Automotive Technology | 1 | $20B |
|
||
Price history
-7.9% since first listed4 events — show timeline
- 2026-04-20 Price Changed $129,000 EUPBR
- 2026-01-17 Price Changed $134,000 EUPBR
- 2025-10-31 Price Changed $137,500 EUPBR
- 2025-09-16 Listed $140,000 EUPBR
Property tax history
+2.0%/yrLatest (2024): $1,377 · +40.8% YoY. Source: county tax records.
Cash-flow waterfall
monthlySold comps — $/sqft
last 12 mo · ≤1 miLoading sold comps…