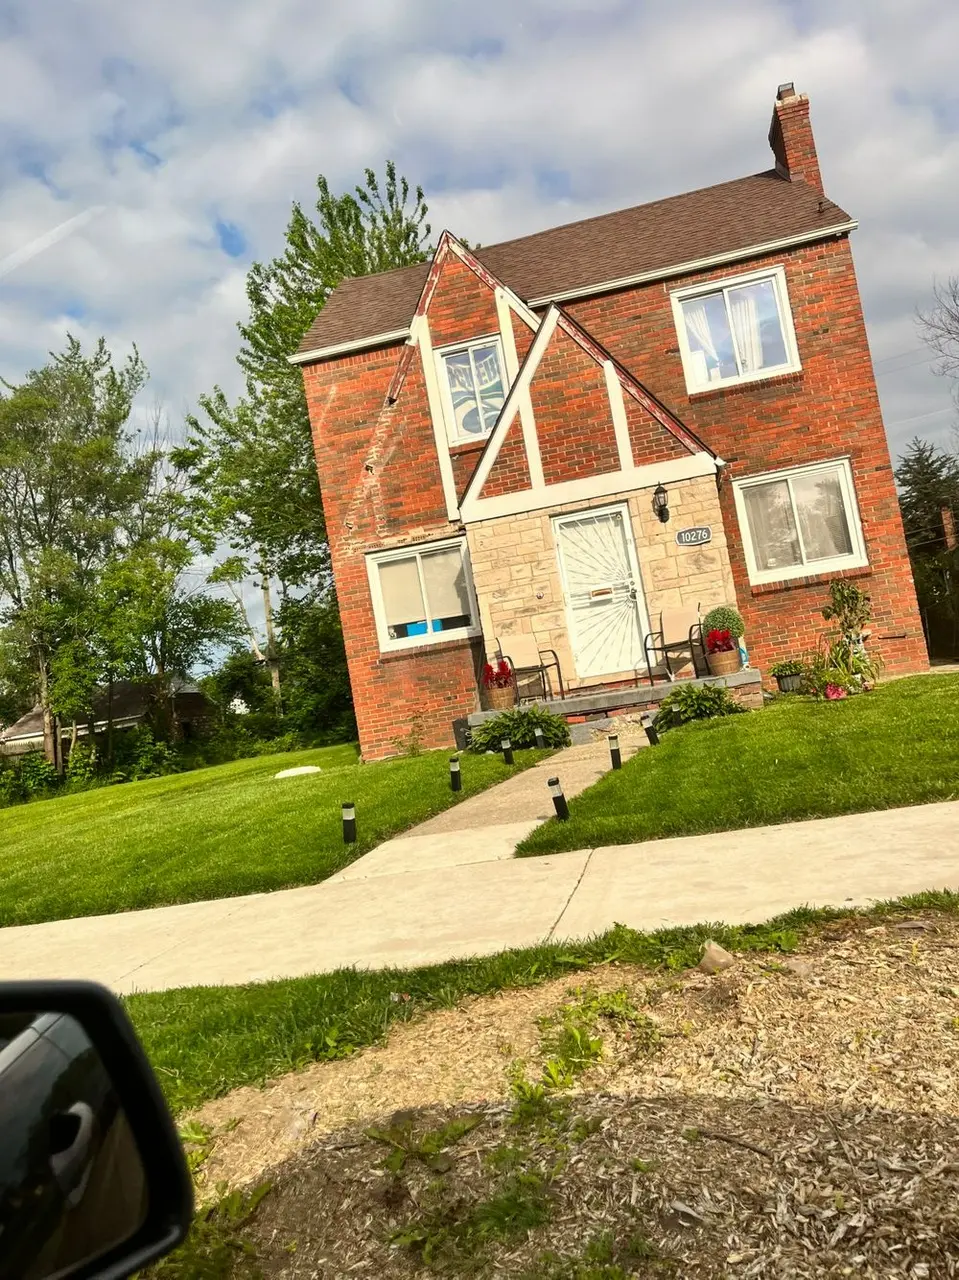
10276 Greensboro St · Detroit, MI
Flood risk 1/10 · Minimal
- FEMA flood zone
- X (unshaded)
- Chance of flooding over 30 yrs
- 0.0%
- Est. flood insurance / yr
- $507 – $1,088
Fire risk 1/10 · Minimal
- Est. fire insurance / yr
- $784 – $1,456
Heat risk 3/10 · Minor
- Hot days now (above 95°F)
- 7 days/yr
- Hot days in 30 yrs
- 15 days/yr
Wind risk 2/10 · Minimal
- Chance of severe wind over 30 yrs
- —
Air-quality risk 3/10 · Minor
- Unhealthy air days now
- 2 days/yr
- Unhealthy air days in 30 yrs
- 5 days/yr
Risk factors via First Street. Map © Google.
Why this score? — see what drove the C+ grade
The composite is a weighted blend of 9 inputs, each scored 0–100. Each bar is that input's sub-score; the figure is the points it added to the 100-point composite (weight × sub-score).
- Cash flow +30.0/30.0
- 1% rule +10.0/10.0
- DSCR +10.0/10.0
- Livability +3.7/5.0
- Rent growth +2.7/5.0
- ARV discount +2.5/15.0
- Condition / age +2.5/5.0
- Schools +1.3/10.0
- Appreciation +0.0/10.0
$67,000
🖨 Deal sheet (PDF) 📄 Offer letter ✓ Due diligence
Listing remarks MLS
Charming brick home located at 10276 Greensboro, Detroit, MI 48224. This spacious property offers plenty of potential, featuring beautiful natural hardwood floors on the main level and a generous kitchen area with glass patio doors that provide great natural light. The block is primarily owner-occupied, with friendly and welcoming neighbors. Great for a fix and flip or Investment rental. Home needs some TLC Additional Information: The home is currently tenant-occupied please do not disturb the tenants. They will vacate the property before or upon closing. Schedule an appointment to view the interior today!
Key facts
- Glass patio doors
- Brick home
- 4,792 sq ft lot
Tags
Neighborhood map
What this means for you Summary
Snapshot
- This is a 3-bed/1.0-bath single-family listed at $67k.
Deal economics
- At list price, monthly cash flow is $623 ($7k/yr) — positive.
- The deal already cash-flows at list — no discount required.
- Meets the 1% rule at list price ($1k rent vs $67k).
- Recommended offer: $59k (12.0% below list) — sets the bar for market timing.
- Cap rate 17.4% vs local median 10.2% in Detroit — top-decile yield for the area; either an underpriced asset or a hidden risk that comps aren't pricing in. Stress-test before assuming the spread holds.
Location & tenants
- Location reads 73/100 on livability (#218 in MI) — a middle-class / working-renter tenant base. Strengths: amenities A+, commute A+, cost of living A+; Watch: schools F, crime F, employment F.
- Detroit Public Schools Community District (urban): math 10% / reading 24% proficiency, ranked #499 of 540 in MI (top 92%) — low school quality limits family demand, transient renter base, plan for 1-2y turnover; 90% free/reduced lunch — lower-income household profile, screen leases tightly.
- Market conditions: Rents flat; 484 active listings in the ZIP; 40 comparable units currently listed for rent nearby; rentals at typical pace (median 18d on market — plan ~3-4 weeks tenant-placement turnaround); lower-income renter base — watch delinquency; 2,639 units permitted in Wayne County in 2024 (1,216 in 5+ unit buildings).
- This rent runs 37% of the median local income ($45k/yr) — at the standard rent-burdened threshold; future hikes will face affordability resistance.
Forward outlook
- Local home prices are declining (-3.0%/yr); year-one equity from $463 of loan paydown is wiped out by about $2k of value loss. Plan a longer hold.
- Wayne County population projected at -17% by 2050 — secular population decline; favor cash flow + early exit over multi-decade hold.
- At projected returns (-3.0% appreciation + 0.7% rent growth), your $19k cash investment doubles in ~4 years — after that, you're playing with house money.
Negotiation context
- It's been on market 228 days — a 12% lower offer ($59k) is reasonable based on typical stale-listing flexibility.
- 9 sale attempts since 16y ago with the ask held roughly flat each time — persistent listings suggest the price (not the market) is what's stuck; bring a comps-based counter.
- Current owner paid $4k; list at $67k implies a 1491% gain — meaningful room to come down on a strong offer.
Risks & watch-outs
- Watch-outs: built in 1939 — expect roof / HVAC / electrical / plumbing capex.
Questions for the listing agent
- It's been on market 228 days. Have you received any prior offers? Is the seller open to a 12% concession, seller financing, or rate buy-down credit?
- Built in 1939 — when were the roof, HVAC, electrical panel, plumbing, and water heater last replaced?
- Why hasn't it sold? Are there any deal-killer items the seller is aware of (foundation, flood, title, zoning, code violations)?
- Is there a deadline driving the sale (1031 exchange, divorce, estate, relocation)? That informs how much negotiation room exists.
- Schools are F-rated, which usually means shorter tenancies and higher turnover. Who's the typical renter profile here, and what's been the actual vacancy rate?
- Crime grade is F in this area — have there been break-ins, vandalism, or insurance claims at this property in the last 3 years? What carrier currently insures it and at what premium?
- What's the average days-on-market for RENTAL listings here right now (not sales)? A rising rental-DOM trend means longer vacancies and softer asking-rent achievability than the comps imply.
- What's the recent tenant-quality profile in this submarket — average credit score on applications, eviction rate, late-payment / NSF rate, and stable-employment percentage? A property-management company in the area should have these aggregated.
- How much new for-sale + rental construction is in the pipeline within 1–3 miles? Heavy new supply typically softens prices + rents 12–24 months out; constrained supply supports both.
Investment metrics
- 1% rule
- 2.05% ✓
- Cap rate
- 17.45%
- Cash-on-cash
- 39.84%
- DSCR
- 2.77
- GRM
- 4.1
CMA / ARV
- ARV (median comp)
- $60,346
- List price
- $67,000
- Delta
- 11.03%
- Verdict
- OVERPRICED
- Comps
- 20 within 1.0 mi
Show comp detail 12 sales within ~0.75 mi
| Address | Dist | Beds/Ba | Sqft | Sold | Price | $/sf | Match |
|---|---|---|---|---|---|---|---|
| 9817 Somerset Ave | 0.16mi | 3/1.0 | 1,290 (+2%) | 2mo | $30,000 | $23 | 87 |
| 9988 Somerset Ave | 0.17mi | 3/1.0 | 1,206 (-5%) | 1mo | $130,000 | $108 | 84 |
| 10318 Beaconsfield St | 0.14mi | 3/1.5 | 1,146 (-9%) | 1mo | $78,000 | $68 | 75 |
| 9722 Everts St | 0.41mi | 3/1.0 | 1,178 (-7%) | 0mo | $147,000 | $125 | 69 |
| 9500 Lakepointe St | 0.31mi | 3/1.0 | 1,130 (-11%) | 0mo | $125,000 | $111 | 68 |
| 11742 Whitehill St | 0.65mi | 3/1.5 | 1,228 (-3%) | 1mo | $61,000 | $50 | 62 |
| 9922 Yorkshire Rd | 0.49mi | 3/2.0 | 1,342 (+6%) | 2mo | $75,000 | $56 | 61 |
| 5791 Bedford St | 0.60mi | 3/1.5 | 1,344 (+6%) | 1mo | $178,000 | $132 | 59 |
| 11323 Lansdowne St | 0.46mi | 3/1.5 | 1,397 (+10%) | 2mo | $133,282 | $95 | 57 |
| 11336 Courville St | 0.61mi | 3/1.0 | 1,425 (+13%) | 0mo | $62,500 | $44 | 50 |
| 5574 Buckingham Ave | 0.70mi | 3/1.0 | 1,430 (+13%) | 2mo | $105,000 | $73 | 44 |
| 5777 Lakepointe St | 0.67mi | 4/2.5 (+1) | 1,075 (-15%) | 2mo | $174,999 | $163 | 32 |
Match score weights: distance 35% · size 25% · config 20% · recency 20%. Top-matched comps best support the ARV.
Projected returns pro-forma
-3.0% appreciation · 0.73% rent growth · sell at horizon
- IRR
- 33.6%
- Equity multiple
- 2.37×
- Total profit
- $25,762
- Equity at exit
- $9,990
- IRR
- 39.3%
- Equity multiple
- 4.28×
- Total profit
- $61,561
- Equity at exit
- $5,793
Cash invested: $18,760 (down + closing). Projections, not guarantees.
Landlord ↔ Tenant lean methodology
- Overall (STATE)
- 62 Landlord-Friendly
- State Michigan
- 62 Landlord-Friendly · EVEN
- County
- — inherits STATE
- City
- — inherits STATE
ZIP-level market 48224
- Rents YoY
- 0.7%
- Active inventory
- 484
- Price-to-rent
- 4.1×
Monthly cashflow live
- Estimated rent
- $1,374 high interval (Pro) →
- Mortgage (P&I)
- −$351
- Tax est. 1.5%
- −$84 /mo · $1,005/yr
- Insurance
- −$28
- HOA
- −$0
- Vacancy / Maint / Mgmt
- −$289
- Net cashflow
- $623
Break-even live
Sensitivity live
| Price | -10% $669 | -5% $646 | +0% $623 | +5% $600 | +10% $577 |
|---|---|---|---|---|---|
| Rent | -10% $514 | -5% $569 | +0% $623 | +5% $677 | +10% $731 |
| Rate | -1.0pp $657 | -0.5pp $640 | base $623 | +0.5pp $605 | +1.0pp $588 |
UW: 25.0% down · 7.5% · 30yr · 1.5% tax · 5.0% vac · 8.0% maint · 8.0% mgmt
Financing live
Cash to close
- Down payment
- $16,750
- Closing costs
- $2,010
- Reserves months
- —
- Total cash needed
- —
Loan-product check · same deal, 3 products live
Conventional
25% down · 7.5% · 30yr
- Down + closing
- —
- Monthly P&I
- —
- Monthly cashflow
- —
- DSCR
- —
- Eligible?
- —
Personal DTI + credit; lowest rate.
DSCR
20% down · 8.5% · 30yr
- Down + closing
- —
- Monthly P&I
- —
- Monthly cashflow
- —
- DSCR
- —
- Eligible?
- —
No personal income docs; deal must DSCR.
Hard money
10% down · 12.0% · 12mo
- Down + closing
- —
- Monthly P&I
- —
- Monthly cashflow
- —
- DSCR
- —
- Eligible?
- —
Short-term bridge; refi at stabilization.
Rent comps 40 comps
| Address | Beds | Baths | Sqft | Rent | $/sqft | DOM | Units | Dist |
|---|---|---|---|---|---|---|---|---|
| 9984 Beaconsfield St Detroit, MI | 3.0 | 1.0 | 1222 | $1,575 | $1.29 | 44d | 1 | 0.15mi |
| 10141 Roxbury St Detroit, MI | 3.0 | 1.0 | 1115 | $1,000 | $0.90 | 44d | 1 | 0.19mi |
| 9927 Beaconsfield St Detroit, MI | 3.0 | 1.0 | 942 | $1,375 | $1.46 | 15d | 1 | 0.19mi |
| 10644 Stratman St Detroit, MI | 2.0 | 1.0 | 1000 | $1,200 | $1.20 | 18d | 1 | 0.25mi |
| 10724 Whitehill St Detroit, MI | 3.0 | 3.0 | 1425 | $1,550 | $1.09 | 18d | 1 | 0.31mi |
| 10803 Roxbury St Detroit, MI | 3.0 | 1.0 | 1150 | $900 | $0.78 | 21d | 1 | 0.31mi |
| 11018 Whitehill St Detroit, MI | 3.0 | 1.0 | 1146 | $1,450 | $1.27 | 11d | 1 | 0.32mi |
| 10813 Whitehill St Detroit, MI | 3.0 | 1.0 | 1392 | $1,350 | $0.97 | 18d | 1 | 0.33mi |
| 10404 Somerset Ave Detroit, MI | 3.0 | 1.0 | 1108 | $1,475 | $1.33 | 4d | 1 | 0.34mi |
| 9409 Balfour Rd Detroit, MI | 3.0 | 1.0 | 1195 | $1,200 | $1.00 | 44d | 1 | 0.35mi |
| 9755 Wayburn St Detroit, MI | 3.0 | 2.0 | 1498 | $1,400 | $0.93 | 4d | 1 | 0.35mi |
| 15857 Evanston St Detroit, MI | 3.0 | 1.5 | 1232 | $1,250 | $1.01 | 5d | 1 | 0.36mi |
| 9400 Lakepointe St Detroit, MI | 3.0 | 1.0 | 1300 | $1,150 | $0.88 | 5d | 1 | 0.41mi |
| 9635 Everts St Detroit, MI | 4.0 | 2.0 | 1450 | $1,650 | $1.14 | 44d | 1 | 0.44mi |
| 9168 Wayburn St Detroit, MI | 3.0 | 1.0 | 1274 | $1,300 | $1.02 | 21d | 1 | 0.49mi |
| 5791 Somerset Ave Detroit, MI | 3.0 | 2.0 | 1660 | $1,400 | $0.84 | 18d | 1 | 0.58mi |
| 10037 Grayton St Detroit, MI | 3.0 | 1.0 | 1000 | $1,400 | $1.40 | 4d | 1 | 0.60mi |
| 11235 Roxbury St Detroit, MI | 3.0 | 1.0 | 1062 | $1,325 | $1.25 | 18d | 1 | 0.62mi |
| 5751 Nottingham Rd Unit 5/21/26 Detroit, MI | 3.0 | 1.0 | 1100 | $1,250 | $1.14 | 15d | 1 | 0.65mi |
| 9171 Bishop St Detroit, MI | 4.0 | 1.0 | 1508 | $1,300 | $0.86 | 44d | 1 | 0.65mi |
| 5747 Lakepointe St Detroit, MI | 3.0 | 1.5 | 1316 | $1,473 | $1.12 | 44d | 1 | 0.71mi |
| 5574 Buckingham Ave Detroit, MI | 3.0 | 1.0 | 1430 | $1,450 | $1.01 | 5d | 1 | 0.71mi |
| 9241 Boleyn St Detroit, MI | 3.0 | 1.0 | 1350 | $1,350 | $1.00 | 44d | 1 | 0.71mi |
| 9313 Harvard Rd Detroit, MI | 3.0 | 1.5 | 1329 | $1,200 | $0.90 | 18d | 1 | 0.73mi |
| 10400 Britain St Detroit, MI | 3.0 | 1.0 | 890 | $1,100 | $1.24 | 44d | 1 | 0.74mi |
| 10370 Britain St Detroit, MI | 3.0 | 1.0 | 1100 | $1,100 | $1.00 | 44d | 1 | 0.76mi |
| 12651 Kelly Rd Unit 1 Detroit, MI | 2.0 | 1.0 | 1680 | $1,150 | $0.68 | 11d | 1 | 0.78mi |
| 12655 Kelly Rd Detroit, MI | 2.0 | 1.0 | 1680 | $1,150 | $0.68 | 11d | 1 | 0.78mi |
| 11689 Wayburn St Detroit, MI | 3.0 | 1.0 | 1142 | $1,350 | $1.18 | 44d | 1 | 0.79mi |
| 11620 Rossiter St Detroit, MI | 3.0 | 1.0 | 1140 | $1,200 | $1.05 | 18d | 1 | 0.80mi |
| 11911 Lansdowne St Detroit, MI | 4.0 | 1.0 | 1350 | $1,400 | $1.04 | 44d | 1 | 0.83mi |
| 5783 Yorkshire Rd Detroit, MI | 2.0 | 1.0 | 1040 | $1,200 | $1.15 | 44d | 1 | 0.83mi |
| 5267 Haverhill St Detroit, MI | 3.0 | 1.5 | 1458 | $1,300 | $0.89 | 18d | 1 | 0.85mi |
| 5267 Haverhill St Detroit, MI | 3.0 | 1.5 | 1458 | $1,300 | $0.89 | 17d | 1 | 0.85mi |
| 10692 Meuse St Detroit, MI | 3.0 | 1.0 | 955 | $1,250 | $1.31 | 13d | 1 | 0.85mi |
| 5235 Chatsworth St Detroit, MI | 2.0 | 1.0 | 900 | $1,050 | $1.17 | 44d | 1 | 0.87mi |
| 15000 Mayfield St Detroit, MI | 3.0 | 1.0 | 1146 | $970 | $0.85 | 18d | 1 | 0.89mi |
| 11776 Rossiter St Detroit, MI | 3.0 | 1.0 | 964 | $1,150 | $1.19 | 12d | 1 | 0.93mi |
| 5112 Haverhill St Unit 1 Detroit, MI | 2.0 | 1.0 | 1000 | $1,100 | $1.10 | 44d | 1 | 0.93mi |
| 6225 Oldtown St Detroit, MI | 3.0 | 1.0 | 1330 | $1,199 | $0.90 | 18d | 1 | 0.96mi |
Listing history 22 events
-
2026-06-03days on market $67,000 Active 228 DOM
-
2026-06-01days on market $67,000 Active 226 DOM
-
2026-05-31days on market $67,000 Active 225 DOM
-
2025-10-18$67,000 Active 615-char remark
Show marketing remark (615 chars)
Charming brick home located at 10276 Greensboro, Detroit, MI 48224. This spacious property offers plenty of potential, featuring beautiful natural hardwood floors on the main level and a generous kitchen area with glass patio doors that provide great natural light. The block is primarily owner-occupied, with friendly and welcoming neighbors. Great for a fix and flip or Investment rental. Home needs some TLC Additional Information: The home is currently tenant-occupied please do not disturb the tenants. They will vacate the property before or upon closing. Schedule an appointment to view the interior today!
-
2011-04-12soldstatus $4,210 190-char remark
Show marketing remark (190 chars)
HUD HOME SOLD AS IS. WWW. CITYSIDECORP FOR MORE INFO. FHA CASE #261-622496.INSURABILITY CODE IE. LEAD BASED PAINT NOTICES. 1250 COMMISSION TO SELLING BROKER. SHOW ANYTIME. NEW HOMES EACH DAY
-
2011-04-12soldstatus $4,210
Show marketing remark (190 chars)
HUD HOME SOLD AS IS. WWW. CITYSIDECORP FOR MORE INFO. FHA CASE #261-622496.INSURABILITY CODE IE. LEAD BASED PAINT NOTICES. 1250 COMMISSION TO SELLING BROKER. SHOW ANYTIME. NEW HOMES EACH DAY
-
2011-02-22historical
-
2011-01-05$4,000 190-char remark
Show marketing remark (190 chars)
HUD HOME SOLD AS IS. WWW. CITYSIDECORP FOR MORE INFO. FHA CASE #261-622496.INSURABILITY CODE IE. LEAD BASED PAINT NOTICES. 1250 COMMISSION TO SELLING BROKER. SHOW ANYTIME. NEW HOMES EACH DAY
-
2011-01-05$4,000
Show marketing remark (190 chars)
HUD HOME SOLD AS IS. WWW. CITYSIDECORP FOR MORE INFO. FHA CASE #261-622496.INSURABILITY CODE IE. LEAD BASED PAINT NOTICES. 1250 COMMISSION TO SELLING BROKER. SHOW ANYTIME. NEW HOMES EACH DAY
-
2011-01-04historical
-
2010-09-14historical
-
2010-09-03$4,000
-
2010-09-03$4,000
-
2010-09-03historical
-
2010-07-07historical
-
2010-05-14$9,800
-
2010-05-14$9,800
-
2010-05-14historical
-
2010-03-05historical
-
2010-01-01$12,600
-
2010-01-01$12,600
-
1994-11-02soldstatus $42,000
ⓘ Source: listings_history table (triggers on properties + properties_extension) + one-shot
backfill from property_details.listing_events for pre-trigger history.
Climate risk First Street
- Flood 1/10 Low FEMA zone X (unshaded) · 0% chance over 30 yrs
- Wildfire 1/10 Low
- Heat 3/10 Moderate 7 d/yr ≥95°F today · 15 d/yr by 30 yrs out
- Wind 2/10 Low
- Air quality 3/10 Moderate 2 unhealthy d/yr today · 5 by 30 yrs out
Nearby sold comps map
Loading sold comps map…
Walkable amenities ~0.75 mi
Loading nearby amenities…
Taxation est. · year 1
- Rental income
- $16,494
- − Mortgage interest
- −$3,753
- − Property taxes
- −$1,005
- − Insurance
- −$335
- − Repairs & maintenance
- −$1,320
- − Management
- −$1,320
- − Depreciation
- −$1,949
- Taxable income
- $6,813
- Est. tax owed @ 24.0%
- −$1,635
- After-tax cash flow
- $5,839/yr
For passive investors: Depreciation is non-cash, so a rental often shows a tax loss while cash-flowing — sheltering income. Rental losses are passive: they offset passive income freely, and up to $25,000/yr can offset ordinary (W-2) income if you actively participate and your MAGI is under $100k (phasing out to $0 by $150k); unused losses carry forward. On sale, claimed depreciation is recaptured at up to 25%, and gains may owe capital-gains tax (a 1031 exchange can defer both). Figures are a year-1 estimate at your 24.0% rate — not tax advice; consult a CPA.
Schools (NCES district)
- District
- Detroit Public Schools Community District
- NCES district ID
- 2601103
- Math proficiency
- 10% ▼ -2.00%
- Reading proficiency
- 24% ▲ 6.00%
- Median HH income
- $25,815
- Composite
- 13.06/100
- National rank
- #9564
- State rank
- #499 of 540 in MI
Livability — Detroit
- Score
- 73/100
- State rank
- #218
- US rank
- #5427
Category grades
Schools grade is shown separately in the Schools card above.
Census & demographics
- Census place
- Detroit, MI
- County
- Wayne County · 1,562,939 people
- City population
- 572,865
- Metro
- Detroit-Warren-Dearborn, MI
- Population (ZIP)
- 39,668
- Household income
- $44,856
- Rent vs Own
- Severe rent burden
- 2515.0
Population outlook (Wayne County) Hauer SSP2
- Today (2025)
- 1,675,273 people
- By 2030
- 1,620,300 · -3.3%
- By 2040
- 1,502,341 · -10.3%
- By 2050
- 1,384,039 · -17.4%
- By 2075
- 1,124,592 · -32.9%
- By 2100
- 881,193 · -47.4%
Race, ethnicity, and origin ACS 2023
- Neighborhood character
- Predominantly Black (88%)
- Race & ethnicity
- Black 88% White 8% Two or more races 3% Hispanic / Latino 1%
- Common ancestry
- Iranian 1% Romanian 1% Lithuanian 1%
- Foreign-born
- 1%
- Languages at home
- 97% English-only · Spanish 2%
Political lean MEDSL · Wayne
- 2024 margin
- Strong D (+29.0) · D 62.7% · R 33.7% · Other 3.6%
- 2008→2024 swing
- -20.5pp toward R · 2008: 49.5pp · 2024: 29.0pp
- All cycles
- 2024: D+29.0 2020: D+38.1 2016: D+37.3 2012: D+46.9 2008: D+49.5
Not yet ingested
- Civics
- —
Market trends
- HPI YoY
- ▼ -226.38%
- Current HPI
- 161.886
- Rent YoY
- ▲ 0.73%
- Metro
- Detroit-Warren-Dearborn, MI
- State GDP YoY
- ▲ 1.37%
- F500 in state
- 28
Industry mix (Fortune 500 HQ in MI)
| Industry | F500 HQs | Revenue |
|---|---|---|
| Automotive Parts | 3 | $48B |
|
||
| Automotive | 2 | $372B |
|
||
| Chemicals | 1 | $45B |
|
||
| Automotive Retail | 1 | $29B |
|
||
| Healthcare / Medical Devices | 1 | $23B |
|
||
| Automotive Technology | 1 | $20B |
|
||
Price history
+59.5% since first listed19 events — show timeline
- 2025-10-18 Listed $67,000 ForSaleByOwner.com
- 2011-04-12 Sold (MLS) $4,210 MiRealSource-MiMLS
- 2011-04-12 Sold (MLS) $4,210 REALCOMP
- 2011-02-22 Listing Removed — MiRealSource-MiMLS
- 2011-01-05 Listed $4,000 MiRealSource-MiMLS
- 2011-01-05 Listed $4,000 REALCOMP
- 2011-01-04 Listing Removed — REALCOMP
- 2010-09-14 Listing Removed — MiRealSource-MiMLS
- 2010-09-03 Listing Removed — REALCOMP
- 2010-09-03 Listed $4,000 MiRealSource-MiMLS
- 2010-09-03 Listed $4,000 REALCOMP
- 2010-07-07 Listing Removed — MiRealSource-MiMLS
- 2010-05-14 Listing Removed — REALCOMP
- 2010-05-14 Listed $9,800 MiRealSource-MiMLS
- 2010-05-14 Listed $9,800 REALCOMP
- 2010-03-05 Listing Removed — MiRealSource-MiMLS
- 2010-01-01 Listed $12,600 MiRealSource-MiMLS
- 2010-01-01 Listed $12,600 REALCOMP
- 1994-11-02 Sold (Public Records) $42,000 Public Records
Property tax history
-20.8%/yrLatest (2025): $130 · -96.3% YoY. Source: county tax records.
Cash-flow waterfall
monthlySold comps — $/sqft
last 12 mo · ≤1 miLoading sold comps…