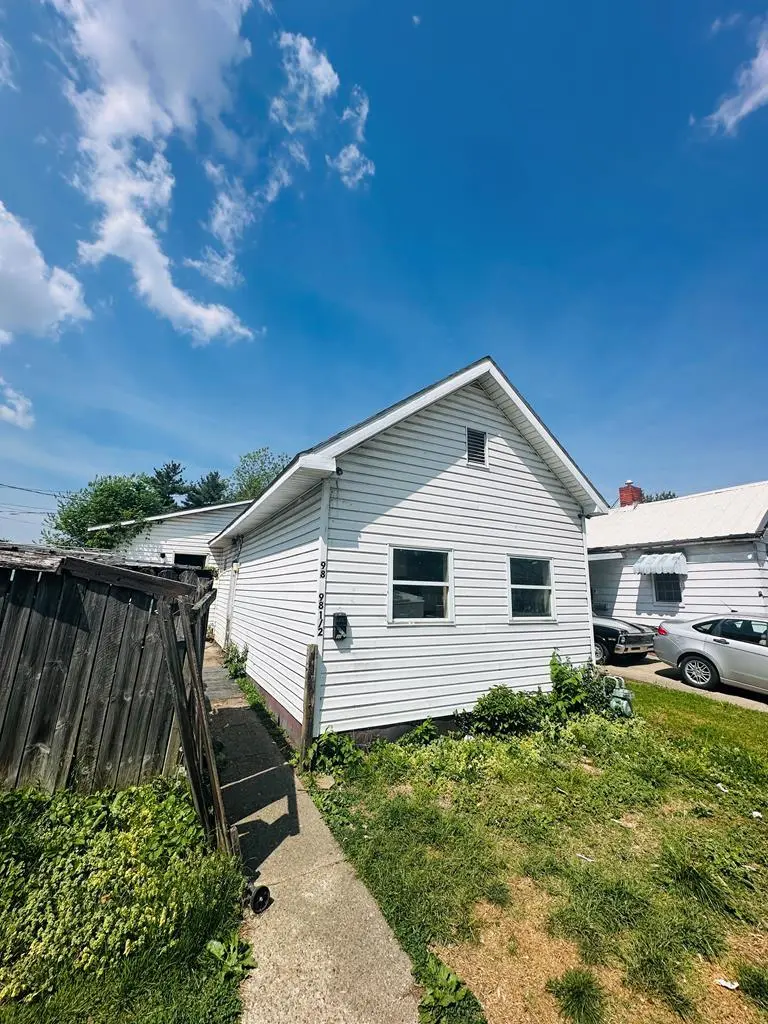
98 S Brownell St · Chillicothe, OH
Flood risk 1/10 · Minimal
- FEMA flood zone
- X (unshaded)
- Chance of flooding over 30 yrs
- 0.0%
- Est. flood insurance / yr
- $507 – $1,088
Fire risk 1/10 · Minimal
- Est. fire insurance / yr
- $713 – $1,323
Heat risk 4/10 · Minor
- Hot days now (above 101°F)
- 7 days/yr
- Hot days in 30 yrs
- 18 days/yr
Wind risk 2/10 · Minimal
- Chance of severe wind over 30 yrs
- 1.0%
Air-quality risk 2/10 · Minimal
- Unhealthy air days now
- 1 days/yr
- Unhealthy air days in 30 yrs
- 2 days/yr
Risk factors via First Street. Map © Google.
Why this score? — see what drove the B- grade
The composite is a weighted blend of 9 inputs, each scored 0–100. Each bar is that input's sub-score; the figure is the points it added to the 100-point composite (weight × sub-score).
- Cash flow +30.0/30.0
- 1% rule +10.0/10.0
- DSCR +10.0/10.0
- ARV discount +7.5/15.0
- Schools +3.5/10.0
- Livability +3.1/5.0
- Rent growth +2.5/5.0
- Condition / age +2.5/5.0
- Appreciation +0.0/10.0
$54,900
🖨 Deal sheet 📄 Offer letter ✓ Due diligence
Listing remarks
Don't miss this versatile investment property offering the best of both worlds! Currently configured as am income producing duplex, this 3 bedroom, 2 bathroom home can easily be converted back to a spacious single family residence, the choice is yours. Live in one unit while renting the other, or restore it to its original layout and build instant equity. This property has strong bones and tons of potential, making it the perfect canvas for investors and owner-occupants alike. Whether you're a seasoned investor looking to add a cash flowing asset to your portfolio or a buyer ready to roll up your sleeves and create something special, this home checks all the boxes. Some updates and repairs
Key facts
- Built 1905
- Listed 49 days
Property features AI
Exterior
- Parking: No garage
- Utilities: Public water; Public sewer
- Home design: Single-family residence; One story
- Construction: Vinyl siding
- Exterior features: Asphalt roof
Interior
- Bedrooms: 3 main-level bedrooms
- Flooring: Vinyl flooring
- Bathrooms: 2 full bathrooms (both on the main level)
- Heating & cooling: No heating specified; No cooling specified
- Interior features: Double pane windows; Partial basement
Neighborhood map
What this means for you Summary
Snapshot
- This is a 3-bed/1.0-bath single-family listed at $55k.
Deal economics
- At list price, monthly cash flow is $656 ($8k/yr) — positive.
- The deal already cash-flows at list — no discount required.
- Meets the 1% rule at list price ($1k rent vs $55k).
- Recommended offer: $53k (3.0% below list) — sets the bar for market timing.
- Cap rate 20.6% vs local median 4.2% in Chillicothe — top-decile yield for the area; either an underpriced asset or a hidden risk that comps aren't pricing in. Stress-test before assuming the spread holds.
Location & tenants
- Location reads 62/100 on livability (#909 in OH) — a middle-class / working-renter tenant base. Strengths: cost of living A+, housing A+; Watch: employment D, crime D-, amenities F.
- Chillicothe City (town): math 36% / reading 47% proficiency, ranked #535 of 656 in OH (top 82%) — families likely to look elsewhere, expect single-tenant / working-renter base with shorter leases.
- Zoned schools: Chillicothe Primary School (570 students, 0% FRL); Chillicothe Middle School (math 29% / reading 43%, grade F, #541 of 654 statewide, top 83%, 395 students, 0% FRL); Chillicothe High School (math 32% / reading 57%, grade F, #470 of 781 statewide, top 62%, 885 students, 0% FRL) — zoned schools average 0% FRL vs 57% district-wide (57 pts lower); this property's tenant base skews higher-income than the district average.
- Market conditions: 178 active listings in the ZIP; 24 units permitted in Ross County in 2024 (0 in 5+ unit buildings).
Forward outlook
- Local home prices are declining (-3.0%/yr); year-one equity from $380 of loan paydown is wiped out by about $2k of value loss. Plan a longer hold.
- Ross County population projected at -12% by 2050 — secular population decline; favor cash flow + early exit over multi-decade hold.
- At projected returns (-3.0% appreciation + 3.0% rent growth), your $15k cash investment doubles in ~3 years — after that, you're playing with house money.
Negotiation context
- It's been on market 49 days — a 3% lower offer ($53k) is reasonable based on typical stale-listing flexibility.
Risks & watch-outs
- Watch-outs: built in 1905 — expect roof / HVAC / electrical / plumbing capex.
Questions for the listing agent
- It's been on market 49 days. Have you received any prior offers? Is the seller open to a 3% concession, seller financing, or rate buy-down credit?
- Built in 1905 — when were the roof, HVAC, electrical panel, plumbing, and water heater last replaced?
- Is there a deadline driving the sale (1031 exchange, divorce, estate, relocation)? That informs how much negotiation room exists.
- Schools are B-rated — typically a magnet for longer-tenancy family renters. What's the average tenant stay here, and is there a school-zone premium baked into asking?
- Crime grade is D in this area — have there been break-ins, vandalism, or insurance claims at this property in the last 3 years? What carrier currently insures it and at what premium?
- What's the average days-on-market for RENTAL listings here right now (not sales)? A rising rental-DOM trend means longer vacancies and softer asking-rent achievability than the comps imply.
- What's the recent tenant-quality profile in this submarket — average credit score on applications, eviction rate, late-payment / NSF rate, and stable-employment percentage? A property-management company in the area should have these aggregated.
- How much new for-sale + rental construction is in the pipeline within 1–3 miles? Heavy new supply typically softens prices + rents 12–24 months out; constrained supply supports both.
Investment metrics
- 1% rule
- 2.36% ✓
- Cap rate
- 20.63%
- Cash-on-cash
- 51.22%
- DSCR
- 3.28
- GRM
- 3.5
CMA / ARV
- ARV (median comp)
- $113,632
- List price
- $54,900
- Delta
- -51.69%
- Verdict
- UNDERPRICED
- Comps
- 20 within 1.0 mi
Show comp detail 12 sales within ~0.75 mi
| Address | Dist | Beds/Ba | Sqft | Sold | Price | $/sf | Match |
|---|---|---|---|---|---|---|---|
| 748 Jefferson Ave | 0.19mi | 3/1.0 | 960 (-3%) | 4mo | $159,900 | $167 | 83 |
| 23 N Brownell St | 0.21mi | 3/1.0 | 910 (-8%) | 2mo | $149,900 | $165 | 75 |
| 910 Madison Ave | 0.45mi | 3/1.0 | 936 (-5%) | 1mo | $165,000 | $176 | 69 |
| 619 E 2nd St | 0.27mi | 2/1.0 (-1) | 1,056 (+7%) | 2mo | $156,000 | $148 | 69 |
| 623 Glencroft Ave | 0.44mi | 3/1.0 | 1,056 (+7%) | 2mo | $145,000 | $137 | 67 |
| 831 Jefferson Ave | 0.35mi | 2/1.0 (-1) | 1,028 (+4%) | 7mo | $75,500 | $73 | 66 |
| 329 Eastern Ave | 0.52mi | 3/1.0 | 1,022 (+3%) | 8mo | $123,500 | $121 | 63 |
| 863 Adams Ave | 0.43mi | 2/1.0 (-1) | 928 (-6%) | 4mo | $52,000 | $56 | 61 |
| 760 E 4th St | 0.27mi | 3/2.0 | 1,120 (+13%) | 2mo | $175,000 | $156 | 59 |
| 675 Cox Ave | 0.63mi | 4/1.5 (+1) | 1,050 (+6%) | 2mo | $153,000 | $146 | 52 |
| 337 E 7th St | 0.43mi | 2/1.0 (-1) | 870 (-12%) | 7mo | $53,000 | $61 | 49 |
| 249 Madeira Ave | 0.70mi | 4/2.0 (+1) | 1,100 (+11%) | 1mo | $185,000 | $168 | 39 |
Match score weights: distance 35% · size 25% · config 20% · recency 20%. Top-matched comps best support the ARV.
Projected returns pro-forma
-3.0% appreciation · 3.0% rent growth · sell at horizon
- IRR
- 49.1%
- Equity multiple
- 3.14×
- Total profit
- $32,900
- Equity at exit
- $8,186
- IRR
- 54.6%
- Equity multiple
- 6.37×
- Total profit
- $82,498
- Equity at exit
- $4,747
Cash invested: $15,372 (down + closing). Projections, not guarantees.
Landlord ↔ Tenant lean methodology
- Overall (STATE)
- 73 Landlord-Friendly
- State Ohio
- 73 Landlord-Friendly · R+6
- County
- — inherits STATE
- City
- — inherits STATE
ZIP-level market 45601
- Active inventory
- 178
- Price-to-rent
- 3.5×
Monthly cashflow live
- Estimated rent
- $1,293 medium interval (Pro) →
- Mortgage (P&I)
- −$288
- Tax from tax record
- −$55 /mo · $657/yr
- Insurance
- −$23
- HOA
- −$0
- Vacancy / Maint / Mgmt
- −$272
- Net cashflow
- $656
Break-even live
UW: 25.0% down · 7.5% · 30yr · 1.5% tax · 5.0% vac · 8.0% maint · 8.0% mgmt
Financing live
Cash to close
- Down payment
- $13,725
- Closing costs
- $1,647
- Reserves months
- —
- Total cash needed
- —
Loan-product check · same deal, 3 products live
Conventional
25% down · 7.5% · 30yr
- Down + closing
- —
- Monthly P&I
- —
- Monthly cashflow
- —
- DSCR
- —
- Eligible?
- —
Personal DTI + credit; lowest rate.
DSCR
20% down · 8.5% · 30yr
- Down + closing
- —
- Monthly P&I
- —
- Monthly cashflow
- —
- DSCR
- —
- Eligible?
- —
No personal income docs; deal must DSCR.
Hard money
10% down · 12.0% · 12mo
- Down + closing
- —
- Monthly P&I
- —
- Monthly cashflow
- —
- DSCR
- —
- Eligible?
- —
Short-term bridge; refi at stabilization.
Listing history 18 events
-
2026-06-18days on market $54,900 Active 49 DOM
-
2026-06-17days on market $54,900 Active 48 DOM
-
2026-06-16pricedays on market $54,900 Active 47 DOM
-
2026-06-15days on market $59,900 Active 46 DOM
-
2026-06-13days on market $59,900 Active 44 DOM
-
2026-06-12days on market $59,900 Active 43 DOM
-
2026-06-09days on market $59,900 Active 40 DOM
-
2026-06-08days on market $59,900 Active 39 DOM
-
2026-06-08days on market $59,900 Active 38 DOM
-
2026-06-07days on market $59,900 Active 37 DOM
-
2026-06-04days on market $59,900 Active 34 DOM
-
2026-06-02days on market $59,900 Active 33 DOM
-
2026-06-01days on market $59,900 Active 32 DOM
-
2026-05-31days on market $59,900 Active 31 DOM
-
2026-05-13price $69,900 986-char remark
-
2026-05-06price $74,900 986-char remark
-
2026-04-30$79,900 Active 986-char remark
-
2017-09-14soldstatus $1,397,000
ⓘ Source: listings_history table (triggers on properties + properties_extension) + one-shot
backfill from property_details.listing_events for pre-trigger history.
Tax reassessment forecast OH · Partial reset (capped growth)
- Current annual tax
- $657 · $55/mo
- Projected year-2 tax
- $757 · $63/mo
- Expected delta
- +$100/yr (+$8/mo · 15.1%)
ⓘ Screening estimate from a state-policy table — verify with the county assessor before closing.
Climate risk First Street
- Flood 1/10 Low FEMA zone X (unshaded) · 0% chance over 30 yrs
- Wildfire 1/10 Low
- Heat 4/10 Moderate 7 d/yr ≥101°F today · 18 d/yr by 30 yrs out
- Wind 2/10 Low 100% chance of damaging wind over 30 yrs
- Air quality 2/10 Low 1 unhealthy d/yr today · 2 by 30 yrs out
Nearby sold comps map
Loading sold comps map…
Walkable amenities ~0.75 mi
Loading nearby amenities…
Taxation est. · year 1
- Rental income
- $15,518
- − Mortgage interest
- −$3,075
- − Property taxes
- −$657
- − Insurance
- −$274
- − Repairs & maintenance
- −$1,241
- − Management
- −$1,241
- − Depreciation
- −$1,597
- Taxable income
- $7,431
- Est. tax owed @ 24.0%
- −$1,783
- After-tax cash flow
- $6,089/yr
For passive investors: Depreciation is non-cash, so a rental often shows a tax loss while cash-flowing — sheltering income. Rental losses are passive: they offset passive income freely, and up to $25,000/yr can offset ordinary (W-2) income if you actively participate and your MAGI is under $100k (phasing out to $0 by $150k); unused losses carry forward. On sale, claimed depreciation is recaptured at up to 25%, and gains may owe capital-gains tax (a 1031 exchange can defer both). Figures are a year-1 estimate at your 24.0% rate — not tax advice; consult a CPA.
Schools (NCES district)
- District
- Chillicothe City
- NCES district ID
- 3904374
- Math proficiency
- 36% ▼ -12.00%
- Reading proficiency
- 47% ▼ -11.00%
- Median HH income
- $37,990
- Composite
- 34.55/100
- National rank
- #5174
- State rank
- #535 of 656 in OH
Livability — Chillicothe
- Score
- 62/100
- State rank
- #909
- US rank
- #17195
Category grades
Schools grade is shown separately in the Schools card above.
Census & demographics
- Census place
- Chillicothe, OH
- County
- Ross · 75,517 people
- Population (ZIP)
- 56,453
- Household income
- $57,430
- Rent vs Own
- Severe rent burden
- 10.6
Population outlook (Ross County) Hauer SSP2
- Today (2025)
- 75,482 people
- By 2030
- 74,035 · -1.9%
- By 2040
- 70,702 · -6.3%
- By 2050
- 66,706 · -11.6%
- By 2075
- 55,398 · -26.6%
- By 2100
- 42,197 · -44.1%
Race, ethnicity, and origin ACS 2023
- Neighborhood character
- Predominantly White (86%)
- Race & ethnicity
- White 86% Black 7% Two or more races 4% Hispanic / Latino 2%
- Common ancestry
- Slovak 2% Iranian 1% Italian 1%
- Foreign-born
- 1% · Canada
- Languages at home
- 98% English-only · Spanish 1%
Political lean MEDSL · Ross
- 2024 margin
- Solid R (+39.3) · D 29.9% · R 69.2%
- 2008→2024 swing
- -32.1pp toward R · 2008: -7.2pp · 2024: -39.3pp
- All cycles
- 2024: R+39.3 2020: R+35.2 2016: R+27.4 2012: R+2.4 2008: R+7.2
Not yet ingested
- Civics
- —
Market trends
- HPI YoY
- ▼ -231.40%
- Current HPI
- 205.7051
- Rent YoY
- —
- Metro
- —
- State GDP YoY
- ▲ 1.98%
- F500 in state
- 48
Industry mix (Fortune 500 HQ in OH)
| Industry | F500 HQs | Revenue |
|---|---|---|
| Insurance | 3 | $145B |
|
||
| Industrial Machinery | 3 | $49B |
|
||
| Financial Services | 3 | $24B |
|
||
| Consumer Goods | 2 | $93B |
|
||
| Aerospace / Defense | 2 | $47B |
|
||
| Utilities | 2 | $33B |
|
||
Price history
-96.1% since first listed6 events — show timeline
- 2026-06-16 Price Changed $54,900 SVAR
- 2026-05-19 Price Changed $59,900 SVAR
- 2026-05-13 Price Changed $69,900 SVAR
- 2026-05-06 Price Changed $74,900 SVAR
- 2026-04-30 Listed $79,900 SVAR
- 2017-09-14 Sold (Public Records) $1,397,000 Public Records
Property tax history
-0.3%/yrLatest (2025): $657 · +65.5% YoY. Source: county tax records.
Cash-flow waterfall
monthlySold comps — $/sqft
last 12 mo · ≤1 miLoading sold comps…