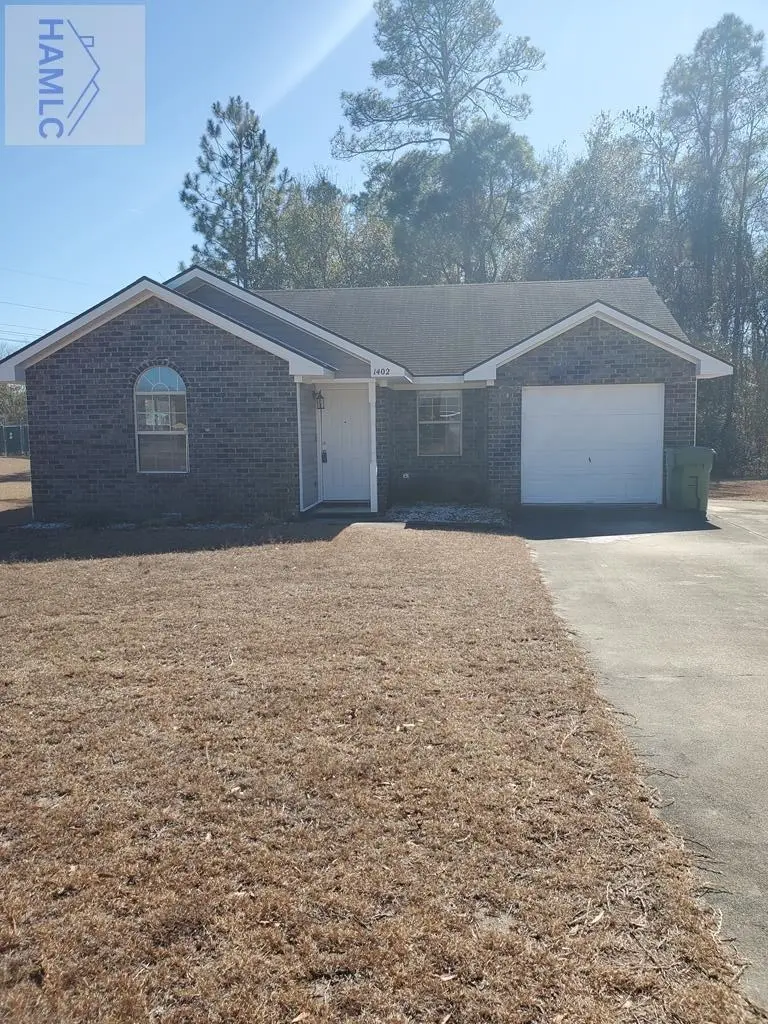
1402 Desert Storm Dr · Hinesville, GA
Flood risk 1/10 · Minimal
- FEMA flood zone
- X (unshaded)
- Chance of flooding over 30 yrs
- 0.0%
- Est. flood insurance / yr
- $507 – $1,088
Fire risk 5/10 · Moderate
- Est. fire insurance / yr
- $963 – $1,789
Heat risk 9/10 · Severe
- Hot days now (above 110°F)
- 7 days/yr
- Hot days in 30 yrs
- 19 days/yr
Wind risk 8/10 · Major
- Chance of severe wind over 30 yrs
- 99.0%
Air-quality risk 2/10 · Minimal
- Unhealthy air days now
- 2 days/yr
- Unhealthy air days in 30 yrs
- 2 days/yr
Risk factors via First Street. Map © Google.
Why this score? — see what drove the D grade
The composite is a weighted blend of 9 inputs, each scored 0–100. Each bar is that input's sub-score; the figure is the points it added to the 100-point composite (weight × sub-score).
- Cash flow +12.1/30.0
- ARV discount +9.3/15.0
- 1% rule +3.9/10.0
- Rent growth +3.9/5.0
- Livability +3.7/5.0
- DSCR +3.6/10.0
- Condition / age +2.5/5.0
- Schools +2.0/10.0
- Appreciation +0.0/10.0
$190,000
🖨 Deal sheet 📄 Offer letter ✓ Due diligence
Listing remarks MLS
Come and check out this lovely 3bd 2bth home situated in a well established neighborhood. This could be the start you need to become a home owner. You have all the amenities of restaurants and shopping as well as being in close proximity to Fort Stewart. Schedule a showing today!!
Key facts
- 0.25 acre lot
- Garage
- Built 1994
Neighborhood map
What this means for you Summary
Snapshot
- This is a 3-bed/2.0-bath single-family listed at $190k.
Deal economics
- At list price, monthly cash flow is $-43 ($-520/yr) — negative.
- To cash-flow at today's rent, offer at most $182k (4.0% below list).
- To meet the 1% rule (rent ≥ 1% of price), the offer needs to be $170k (10.5% below list).
- Recommended offer: $167k (12.0% below list) — sets the bar for market timing.
Location & tenants
- Location reads 73/100 on livability (#51 in GA) — a middle-class / working-renter tenant base. Strengths: cost of living A+, housing A+, health & safety A+; Watch: schools D+, commute D+, crime F.
- Liberty County (urban): math 19% / reading 28% proficiency, ranked #133 of 174 in GA (top 76%) — low school quality limits family demand, transient renter base, plan for 1-2y turnover.
- Market conditions: Rents rising fast (+5.4%/yr); 612 active listings in the ZIP; 23 comparable units currently listed for rent nearby; rentals lingering (median 44d on market — plan ~5-8 weeks vacancy on turnover, expect pricing pressure); 100% of comp listings sitting > 30 days — soft ceiling on asking rent; 471 units permitted in Liberty County in 2024 (0 in 5+ unit buildings).
- This rent runs 34% of the median local income ($60k/yr) — at the standard rent-burdened threshold; future hikes will face affordability resistance.
Forward outlook
- Local home prices are declining (-3.0%/yr); year-one equity from $1k of loan paydown is wiped out by about $6k of value loss. Plan a longer hold.
- Liberty County population projected to shrink 8% by 2050 — rents likely to lag national; underwrite the cash flow, not the appreciation.
Negotiation context
- It's been on market 127 days — a 12% lower offer ($167k) is reasonable based on typical stale-listing flexibility.
- 2 sale attempts since 8y ago; this cycle's ask has dropped $25k (12%) from the opening price — seller is motivated, your offer sets the floor, not the list.
Risks & watch-outs
- Climate carrying-cost: severe wind risk, 99% chance of damaging wind over 30y; moderate wildfire risk; extreme-heat days projected 7→19/yr by 2055 (HVAC capex compounding) — expect insurance premiums to compound above CPI over the hold.
Questions for the listing agent
- What do current leases actually rent for vs. the listed asking? Can we see a recent rent roll and the last 12 months of T-12 income?
- It's been on market 127 days. Have you received any prior offers? Is the seller open to a 12% concession, seller financing, or rate buy-down credit?
- Why hasn't it sold? Are there any deal-killer items the seller is aware of (foundation, flood, title, zoning, code violations)?
- Is there a deadline driving the sale (1031 exchange, divorce, estate, relocation)? That informs how much negotiation room exists.
- Schools are D-rated, which usually means shorter tenancies and higher turnover. Who's the typical renter profile here, and what's been the actual vacancy rate?
- Crime grade is F in this area — have there been break-ins, vandalism, or insurance claims at this property in the last 3 years? What carrier currently insures it and at what premium?
- The area grade is low — what's the realistic commute time and amenity access for the typical tenant pool here? Any planned neighborhood developments (good or bad) we should know about?
- What's the average days-on-market for RENTAL listings here right now (not sales)? A rising rental-DOM trend means longer vacancies and softer asking-rent achievability than the comps imply.
- What's the recent tenant-quality profile in this submarket — average credit score on applications, eviction rate, late-payment / NSF rate, and stable-employment percentage? A property-management company in the area should have these aggregated.
- How much new for-sale + rental construction is in the pipeline within 1–3 miles? Heavy new supply typically softens prices + rents 12–24 months out; constrained supply supports both.
Investment metrics
- 1% rule
- 0.89% ✗
- Cap rate
- 6.02%
- Cash-on-cash
- -0.98%
- DSCR
- 0.96
- GRM
- 9.3
CMA / ARV
- ARV (median comp)
- $197,837
- List price
- $190,000
- Delta
- -3.96%
- Verdict
- FAIR
- Comps
- 20 within 1.0 mi
Show comp detail 12 sales within ~0.75 mi
| Address | Dist | Beds/Ba | Sqft | Sold | Price | $/sf | Match |
|---|---|---|---|---|---|---|---|
| 1458 Victory Cir | 0.23mi | 3/2.0 | 1,156 (+1%) | 2mo | $203,000 | $176 | 85 |
| 1441 Coalition Cir | 0.22mi | 3/2.0 | 1,168 (+2%) | 1mo | $205,000 | $176 | 85 |
| 1242 Dhurahn Dr | 0.11mi | 3/2.0 | 1,223 (+7%) | 3mo | $185,000 | $151 | 81 |
| 222 Glenn Bryant Rd | 0.38mi | 3/2.0 | 1,111 (-3%) | 1mo | $219,900 | $198 | 77 |
| 234 Deerwood Dr | 0.47mi | 4/2.0 (+1) | 1,128 (-1%) | 3mo | $177,500 | $157 | 69 |
| 649 Honey Ridge Ln | 0.61mi | 3/2.0 | 1,152 (+1%) | 2mo | $208,000 | $181 | 68 |
| 1104 Tomcat Trl Trl | 0.35mi | 3/2.0 | 1,245 (+9%) | 2mo | $237,000 | $190 | 67 |
| 1371 Forest Lake Dr | 0.52mi | 3/2.0 | 1,251 (+10%) | 1mo | $225,000 | $180 | 59 |
| 735 Kadi Ln | 0.46mi | 3/2.0 | 1,290 (+13%) | 0mo | $208,500 | $162 | 57 |
| 106 Deann Dr | 0.42mi | 3/1.5 | 1,285 (+12%) | 2mo | $224,900 | $175 | 56 |
| 1072 Ricade Dr | 0.73mi | 3/1.5 | 1,048 (-8%) | 3mo | $204,000 | $195 | 48 |
| 624 Honey Ridge Ln | 0.56mi | 4/2.0 (+1) | 1,302 (+14%) | 1mo | $199,900 | $154 | 45 |
Match score weights: distance 35% · size 25% · config 20% · recency 20%. Top-matched comps best support the ARV.
Projected returns pro-forma
-3.0% appreciation · 5.41% rent growth · sell at horizon
- IRR
- -15.1%
- Equity multiple
- 0.45×
- Total profit
- $-29,259
- Equity at exit
- $28,330
- IRR
- -2.6%
- Equity multiple
- 0.80×
- Total profit
- $-10,551
- Equity at exit
- $16,428
Cash invested: $53,200 (down + closing). Projections, not guarantees.
Landlord ↔ Tenant lean methodology
- Overall (STATE)
- 90 Strongly Landlord-Friendly
- State Georgia
- 90 Strongly Landlord-Friendly · R+3
- County
- — inherits STATE
- City
- — inherits STATE
ZIP-level market 31313
- Home prices YoY
- -27.1%
- Rents YoY
- 5.4%
- Active inventory
- 612
- Price-to-rent
- 9.3×
Monthly cashflow live
- Estimated rent
- $1,700 high interval (Pro) →
- Mortgage (P&I)
- −$996
- Tax from tax record
- −$311 /mo · $3,727/yr
- Insurance
- −$79
- HOA
- −$0
- Vacancy / Maint / Mgmt
- −$357
- Net cashflow
- $-43
Break-even live
UW: 25.0% down · 7.5% · 30yr · 1.5% tax · 5.0% vac · 8.0% maint · 8.0% mgmt
Financing live
Cash to close
- Down payment
- $47,500
- Closing costs
- $5,700
- Reserves months
- —
- Total cash needed
- —
Loan-product check · same deal, 3 products live
Conventional
25% down · 7.5% · 30yr
- Down + closing
- —
- Monthly P&I
- —
- Monthly cashflow
- —
- DSCR
- —
- Eligible?
- —
Personal DTI + credit; lowest rate.
DSCR
20% down · 8.5% · 30yr
- Down + closing
- —
- Monthly P&I
- —
- Monthly cashflow
- —
- DSCR
- —
- Eligible?
- —
No personal income docs; deal must DSCR.
Hard money
10% down · 12.0% · 12mo
- Down + closing
- —
- Monthly P&I
- —
- Monthly cashflow
- —
- DSCR
- —
- Eligible?
- —
Short-term bridge; refi at stabilization.
Rent comps 23 comps
| Address | Beds | Baths | Sqft | Rent | $/sqft | DOM | Units | Dist |
|---|---|---|---|---|---|---|---|---|
| 1458 Sheridan Pt Hinesville, GA | 3.0 | 2.0 | 1400 | $1,800 | $1.29 | 44d | 1 | 0.19mi |
| 1456 Coalition Cir Hinesville, GA | 3.0 | 2.0 | 1424 | $1,700 | $1.19 | 44d | 1 | 0.22mi |
| 286 Whitetail Cir Hinesville, GA | 3.0 | 2.0 | 1274 | $1,600 | $1.26 | 44d | 1 | 0.33mi |
| 255 Glenn Bryant Rd Hinesville, GA | 3.0 | 1.0 | 1075 | $1,700 | $1.58 | 44d | 1 | 0.51mi |
| 1100 Pineland Ave Hinesville, GA | 2.0 | 2.5 | 1412 | $1,575 | $1.12 | 44d | 2 | 0.58mi |
| 1069 Kelly Dr Hinesville, GA | 3.0 | 1.5 | 1270 | $1,350 | $1.06 | 44d | 1 | 0.64mi |
| 1113 Kelly Dr Hinesville, GA | 2.0 | 2.0 | 858 | $995 | $1.16 | 44d | 1 | 0.66mi |
| 172 Cherokee Cir Hinesville, GA | 3.0 | 2.0 | 1290 | $1,550 | $1.20 | 44d | 1 | 0.68mi |
| 910 Brett Dr Hinesville, GA | 2.0–3.0 | 2.0 | 957 | $1,600 | $1.67 | 44d | 3 | 0.73mi |
| 910 Brett Dr Hinesville, GA | 2.0–3.0 | 2.0 | 957 | $1,600 | $1.67 | 44d | 4 | 0.73mi |
| 1012 White Cir Hinesville, GA | 3.0 | 1.0 | 1050 | $1,300 | $1.24 | 44d | 1 | 0.80mi |
| 108 Cherokee Cir Hinesville, GA | 3.0 | 2.0 | 1208 | $1,275 | $1.06 | 44d | 1 | 0.80mi |
| 131 Pointe South Dr Hinesville, GA | 2.0 | 1.0 | 960 | $1,950 | $2.03 | 44d | 1 | 0.93mi |
| 134 Pointe South Dr Hinesville, GA | 2.0 | 1.0 | 840 | $1,195 | $1.42 | 44d | 1 | 0.95mi |
| 149 Becky St Hinesville, GA | 3.0 | 2.0 | 1145 | $1,800 | $1.57 | 44d | 1 | 1.03mi |
| 196 Wayfair Ln Hinesville, GA | 3.0 | 2.5 | 1380 | $1,790 | $1.30 | 44d | 1 | 1.06mi |
| 732 Fleming Rd Hinesville, GA | 3.0 | 1.5 | 1348 | $1,400 | $1.04 | 44d | 1 | 1.15mi |
| 1474 Kelly Dr Hinesville, GA | 2.0 | 2.0 | 962 | $1,550 | $1.61 | 44d | 1 | 1.19mi |
| 912 Pineland Ave Hinesville, GA | 3.0 | 2.5 | 1428 | $1,648 | $1.15 | 44d | 1 | 1.25mi |
| 814 Lesa St Hinesville, GA | 2.0 | 1.5 | 1152 | $950 | $0.82 | 44d | 1 | 1.28mi |
| 2007 Ossabaw Dr Hinesville, GA | 3.0 | 2.0 | 1291 | $1,975 | $1.53 | 44d | 1 | 1.32mi |
| 662 Mahoney Rd Hinesville, GA | 3.0 | 2.0 | 1196 | $1,795 | $1.50 | 44d | 1 | 1.40mi |
| 727 S Main St Hinesville, GA | 2.0–3.0 | 1.5 | 1286 | $1,450 | $1.13 | 44d | 3 | 1.50mi |
Listing history 22 events
-
2026-06-19days on market $190,000 Active 127 DOM
-
2026-06-18days on market $190,000 Active 126 DOM
-
2026-06-17days on market $190,000 Active 125 DOM
-
2026-06-16days on market $190,000 Active 124 DOM
-
2026-06-15price $190,000 Active 123 DOM
-
2026-06-15days on market $205,000 Active 123 DOM
-
2026-06-14days on market $205,000 Active 121 DOM
-
2026-06-13days on market $205,000 Active 120 DOM
-
2026-06-10days on market $205,000 Active 118 DOM
-
2026-06-09days on market $205,000 Active 117 DOM
-
2026-06-08days on market $205,000 Active 116 DOM
-
2026-06-07days on market $205,000 Active 115 DOM
-
2026-06-05days on market $205,000 Active 112 DOM
-
2026-06-03days on market $205,000 Active 111 DOM
-
2026-06-02days on market $205,000 Active 110 DOM
-
2026-06-01days on market $205,000 Active 109 DOM
-
2026-05-31days on market $205,000 Active 108 DOM
-
2026-05-30days on market $205,000 Active 107 DOM
-
2026-03-18price $205,000 282-char remark
Show marketing remark (282 chars)
Come and check out this lovely 3bd 2bth home situated in a well established neighborhood. This could be the start you need to become a home owner. You have all the amenities of restaurants and shopping as well as being in close proximity to Fort Stewart. Schedule a showing today!!
-
2026-02-12$215,000 Active 282-char remark
Show marketing remark (282 chars)
Come and check out this lovely 3bd 2bth home situated in a well established neighborhood. This could be the start you need to become a home owner. You have all the amenities of restaurants and shopping as well as being in close proximity to Fort Stewart. Schedule a showing today!!
-
2022-03-23soldstatus 330-char remark
Show marketing remark (330 chars)
JUST REDUCED! A charming 3bdrm 2bth home located in an established neighborhood near local shopping, schools and close to Fort Stewart. AC and roof are only 2yrs ago, Seller has renovated: carpets, flooring, counter tops and fresh paint. RENOVATION COMPLETED. Home features: 1 car garage, and large yard. Call for a viewing today!
-
2018-09-25$115,000 330-char remark
Show marketing remark (330 chars)
JUST REDUCED! A charming 3bdrm 2bth home located in an established neighborhood near local shopping, schools and close to Fort Stewart. AC and roof are only 2yrs ago, Seller has renovated: carpets, flooring, counter tops and fresh paint. RENOVATION COMPLETED. Home features: 1 car garage, and large yard. Call for a viewing today!
ⓘ Source: listings_history table (triggers on properties + properties_extension) + one-shot
backfill from property_details.listing_events for pre-trigger history.
Tax reassessment forecast GA · Resets to sale price
- Current annual tax
- $3,727 · $311/mo
- Projected year-2 tax
- $3,727 · $311/mo
- Expected delta
- $0/yr ($0/mo · 0.0%)
ⓘ Screening estimate from a state-policy table — verify with the county assessor before closing.
Climate risk First Street
- Flood 1/10 Low FEMA zone X (unshaded) · 0% chance over 30 yrs
- Wildfire 5/10 Major
- Heat 9/10 Extreme 7 d/yr ≥110°F today · 19 d/yr by 30 yrs out
- Wind 8/10 Severe 99% chance of damaging wind over 30 yrs
- Air quality 2/10 Low 2 unhealthy d/yr today · 2 by 30 yrs out
Nearby sold comps map
Loading sold comps map…
Walkable amenities ~0.75 mi
Loading nearby amenities…
Taxation est. · year 1
- Rental income
- $20,397
- − Mortgage interest
- −$10,643
- − Property taxes
- −$3,727
- − Insurance
- −$950
- − Repairs & maintenance
- −$1,632
- − Management
- −$1,632
- − Depreciation
- −$5,527
- Taxable loss
- −$3,714
- Est. tax savings @ 24.0%
- +$891
- After-tax cash flow
- $371/yr
For passive investors: Depreciation is non-cash, so a rental often shows a tax loss while cash-flowing — sheltering income. Rental losses are passive: they offset passive income freely, and up to $25,000/yr can offset ordinary (W-2) income if you actively participate and your MAGI is under $100k (phasing out to $0 by $150k); unused losses carry forward. On sale, claimed depreciation is recaptured at up to 25%, and gains may owe capital-gains tax (a 1031 exchange can defer both). Figures are a year-1 estimate at your 24.0% rate — not tax advice; consult a CPA.
Schools (NCES district)
- District
- Liberty County
- NCES district ID
- 1303300
- Math proficiency
- 19% ▼ -16.00%
- Reading proficiency
- 28% ▼ -13.00%
- Median HH income
- $43,911
- Composite
- 20.2/100
- National rank
- #8630
- State rank
- #133 of 174 in GA
Livability — Hinesville
- Score
- 73/100
- State rank
- #51
- US rank
- #5200
Category grades
Schools grade is shown separately in the Schools card above.
Census & demographics
- Census place
- Hinesville, GA
- County
- Liberty County · 58,565 people
- City population
- 42,838
- Metro
- Hinesville, GA
- Population (ZIP)
- 42,838
- Household income
- $60,233
- Rent vs Own
- Severe rent burden
- 1693.0
Population outlook (Liberty County) Hauer SSP2
- Today (2025)
- 58,689 people
- By 2030
- 57,670 · -1.7%
- By 2040
- 55,750 · -5.0%
- By 2050
- 54,155 · -7.7%
- By 2075
- 58,947 · +0.4%
- By 2100
- 66,919 · +14.0%
Race, ethnicity, and origin ACS 2023
- Neighborhood character
- Diverse neighborhood (Simpson 0.67)
- Race & ethnicity
- Black 47% White 31% Hispanic / Latino 13% Two or more races 11% Asian 2%
- Hispanic origin (detail)
- Mexican 4% Puerto Rican 7%
- Common ancestry
- Slovak 1% Italian 1% Lithuanian 1%
- Foreign-born
- 7% · Canada, South Korea
- Languages at home
- 86% English-only · Spanish 7% Other Indo-European 2% German/W. Germanic 1%
Political lean MEDSL · Liberty
- 2024 margin
- D (+17.4) · D 58.5% · R 41.0%
- 2008→2024 swing
- -10.9pp toward R · 2008: 28.4pp · 2024: 17.4pp
- All cycles
- 2024: D+17.4 2020: D+24.1 2016: D+21.2 2012: D+30.2 2008: D+28.4
Not yet ingested
- Civics
- —
Market trends
- HPI YoY
- ▼ -77.50%
- Current HPI
- 208.0927
- Rent YoY
- ▲ 5.41%
- Metro
- Hinesville, GA
- State GDP YoY
- ▲ 2.66%
- F500 in state
- 28
Industry mix (Fortune 500 HQ in GA)
| Industry | F500 HQs | Revenue |
|---|---|---|
| Paper / Packaging | 2 | $29B |
|
||
| Retail | 1 | $160B |
|
||
| Transportation / Logistics | 1 | $91B |
|
||
| Airlines | 1 | $62B |
|
||
| Consumer Goods | 1 | $47B |
|
||
| Utilities | 1 | $25B |
|
||
Price history
+78.3% since first listed4 events — show timeline
- 2026-03-18 Price Changed $205,000 HABR
- 2026-02-12 Listed $215,000 HABR
- 2022-03-23 Sold (MLS) — HABR
- 2018-09-25 Listed $115,000 HABR
Property tax history
+6.5%/yrLatest (2025): $3,727 · +7.8% YoY. Source: county tax records.
Cash-flow waterfall
monthlySold comps — $/sqft
last 12 mo · ≤1 miLoading sold comps…