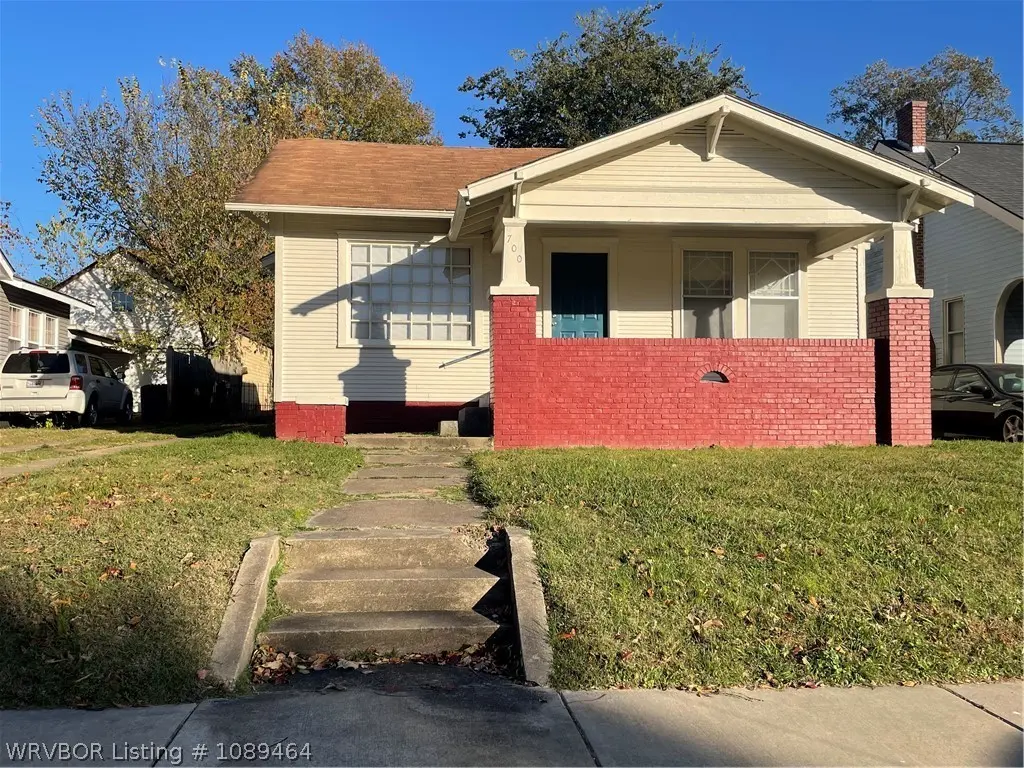
700 Clifton Ct · Fort Smith, AR
Flood risk 1/10 · Minimal
- FEMA flood zone
- X (unshaded)
- Chance of flooding over 30 yrs
- 0.0%
- Est. flood insurance / yr
- $507 – $1,088
Fire risk 1/10 · Minimal
- Est. fire insurance / yr
- $1,499 – $2,785
Heat risk 7/10 · Major
- Hot days now (above 111°F)
- 7 days/yr
- Hot days in 30 yrs
- 20 days/yr
Wind risk 2/10 · Minimal
- Chance of severe wind over 30 yrs
- 3.0%
Air-quality risk 2/10 · Minimal
- Unhealthy air days now
- 0 days/yr
- Unhealthy air days in 30 yrs
- 1 days/yr
Risk factors via First Street. Map © Google.
Why this score? — see what drove the D grade
The composite is a weighted blend of 9 inputs, each scored 0–100. Each bar is that input's sub-score; the figure is the points it added to the 100-point composite (weight × sub-score).
- Cash flow +15.8/30.0
- DSCR +4.9/10.0
- ARV discount +4.1/15.0
- Rent growth +3.7/5.0
- 1% rule +3.4/10.0
- Livability +3.2/5.0
- Schools +3.1/10.0
- Condition / age +2.5/5.0
- Appreciation +0.0/10.0
$117,500
🖨 Deal sheet (PDF) 📄 Offer letter ✓ Due diligence
Listing remarks
Charming 2 bed, 1 bath Clifton Court cottage with the hard work already done. Why pay rent when you can possibly own in this desirable neighborhood. Enjoy original hardwood floors paired with new interior paint, new carpet & blinds for a clean, move-in ready feel. No knob & tube electrical, giving buyers modern peace of mind in a vintage setting. The covered front porch is perfect for relaxing, & eat-in kitchen, bonus storage room & usable attic space make everyday living practical & efficient.
Key facts
- Covered front porch
- Updated electrical
- New carpet
Tags
Property features AI
Exterior
- Parking: Concrete parking
- Security: Smoke detectors
- Utilities: Public water; Public sewer; Electricity available; Natural gas available
- Home design: Single family residence; One story
- Construction: Brick and frame construction; Asphalt shingle roof
- Exterior features: Back yard with partial wood privacy fencing; Public maintained paved road access; Subdivision: Clifton Court; Curbs; Park nearby; On-site storage structure
Interior
- Kitchen: Oven; Range; Gas water heater
- Flooring: Carpet; Ceramic tile; Wood
- Bathrooms: 1 full bathroom
- Heating & cooling: Central heating (natural gas); Central electric air conditioning
- Interior features: Eat-in kitchen; Storage; Wood window frames; No fireplace
- Laundry & utility: Washer hookup; Gas dryer hookup
Neighborhood map
What this means for you Summary
Snapshot
- This is a 2-bed/1.0-bath single-family listed at $118k.
Deal economics
- At list price, monthly cash flow is $54 ($643/yr) — positive.
- The deal already cash-flows at list — no discount required.
- To meet the 1% rule (rent ≥ 1% of price), the offer needs to be $98k (16.3% below list).
- Recommended offer: $98k (16.3% below list) — sets the bar for 1% rule.
- Cap rate 6.8% vs local median 4.3% in Fort Smith — top-decile yield for the area; either an underpriced asset or a hidden risk that comps aren't pricing in. Stress-test before assuming the spread holds.
Location & tenants
- Location reads 65/100 on livability (#151 in AR) — a middle-class / working-renter tenant base. Strengths: cost of living A+, housing A+, health & safety A+; Watch: crime F, amenities F, commute F.
- Fort Smith School District (urban): math 35% / reading 39% proficiency, ranked #106 of 238 in AR (top 44%) — families likely to look elsewhere, expect single-tenant / working-renter base with shorter leases; 64% free/reduced lunch — lower-income household profile, screen leases tightly.
- Zoned schools: Albert Pike Elementary School (math 19% / reading 21%, grade F, #376 of 454 statewide, top 84%, 356 students, 90% FRL); William O. Darby Jr. High Sch. (math 20% / reading 30%, grade F, #164 of 201 statewide, top 82%, 700 students, 87% FRL); Northside High School (math 12% / reading 27%, grade F, #239 of 292 statewide, top 85%, 2,433 students, 74% FRL) — zoned schools average 83% FRL vs 64% district-wide (19 pts higher); higher-poverty schools than district average — tighter screening recommended.
- Zoned-school proficiency averages 22% at this address vs 37% district-wide (-16 pts) — the specific schools serving this property underperform the Fort Smith School District average; the district grade overstates school quality for this exact location.
- Market conditions: Rents rising fast (+4.9%/yr); 200 active listings in the ZIP; 30 comparable units currently listed for rent nearby; rentals at typical pace (median 23d on market — plan ~3-4 weeks tenant-placement turnaround); 388 units permitted in Sebastian County in 2024 (16 in 5+ unit buildings).
Forward outlook
- Local home prices are declining (-3.0%/yr); year-one equity from $812 of loan paydown is wiped out by about $4k of value loss. Plan a longer hold.
- Sebastian County population projected at +7% by 2050 — modest demand growth; plan on rents tracking national, not racing it.
Negotiation context
- It's been on market 19 days — a 2% lower offer ($116k) is reasonable based on typical stale-listing flexibility.
Risks & watch-outs
- Watch-outs: built in 1945 — expect roof / HVAC / electrical / plumbing capex.
- Climate carrying-cost: extreme-heat days projected 7→20/yr by 2055 (HVAC capex compounding) — expect insurance premiums to compound above CPI over the hold.
Questions for the listing agent
- Built in 1945 — when were the roof, HVAC, electrical panel, plumbing, and water heater last replaced?
- Is there a deadline driving the sale (1031 exchange, divorce, estate, relocation)? That informs how much negotiation room exists.
- Schools are D-rated, which usually means shorter tenancies and higher turnover. Who's the typical renter profile here, and what's been the actual vacancy rate?
- Crime grade is F in this area — have there been break-ins, vandalism, or insurance claims at this property in the last 3 years? What carrier currently insures it and at what premium?
- The area grade is low — what's the realistic commute time and amenity access for the typical tenant pool here? Any planned neighborhood developments (good or bad) we should know about?
- What's the average days-on-market for RENTAL listings here right now (not sales)? A rising rental-DOM trend means longer vacancies and softer asking-rent achievability than the comps imply.
- What's the recent tenant-quality profile in this submarket — average credit score on applications, eviction rate, late-payment / NSF rate, and stable-employment percentage? A property-management company in the area should have these aggregated.
- How much new for-sale + rental construction is in the pipeline within 1–3 miles? Heavy new supply typically softens prices + rents 12–24 months out; constrained supply supports both.
Investment metrics
- 1% rule
- 0.84% ✗
- Cap rate
- 6.84%
- Cash-on-cash
- 1.95%
- DSCR
- 1.09
- GRM
- 10.0
CMA / ARV
- ARV (on-the-fly)
- $109,200
- Comps found
- 12
Show comp detail 12 sales within ~0.75 mi
| Address | Dist | Beds/Ba | Sqft | Sold | Price | $/sf | Match |
|---|---|---|---|---|---|---|---|
| 635 Clifton Ct | 0.03mi | 2/1.0 | 1,168 (-3%) | 1mo | $90,000 | $77 | 94 |
| 808 N 34th St | 0.09mi | 3/1.0 (+1) | 1,064 (-11%) | 6mo | $114,000 | $107 | 67 |
| 1201 N 39th St | 0.48mi | 3/1.0 (+1) | 1,152 (-4%) | 6mo | $105,000 | $91 | 61 |
| 1301 N Greenwood Ave | 0.54mi | 2/1.0 | 1,304 (+9%) | 2mo | $112,000 | $86 | 58 |
| 709 N 41st St | 0.50mi | 3/1.0 (+1) | 1,111 (-7%) | 2mo | $136,000 | $122 | 58 |
| 2808 Alabama Ave | 0.30mi | 3/2.0 (+1) | 1,316 (+10%) | 4mo | $138,400 | $105 | 57 |
| 1716 N J St | 0.73mi | 3/1.5 (+1) | 1,196 (-0%) | 5mo | $60,000 | $50 | 54 |
| 1015 N 41st St | 0.55mi | 3/2.0 (+1) | 1,300 (+8%) | 2mo | $167,900 | $129 | 50 |
| 3300 N O St | 0.64mi | 3/1.0 (+1) | 1,312 (+9%) | 2mo | $35,000 | $27 | 48 |
| 421 N 40th St | 0.52mi | 2/1.0 | 1,023 (-15%) | 6mo | $26,000 | $25 | 46 |
| 510 N 40th St | 0.50mi | 3/2.0 (+1) | 1,376 (+15%) | 3mo | $164,900 | $120 | 41 |
| 1711 N J St | 0.74mi | 2/1.0 | 1,028 (-14%) | 3mo | $50,000 | $49 | 39 |
Match score weights: distance 35% · size 25% · config 20% · recency 20%. Top-matched comps best support the ARV.
Projected returns pro-forma
-3.0% appreciation · 4.9% rent growth · sell at horizon
- IRR
- -11.3%
- Equity multiple
- 0.58×
- Total profit
- $-13,753
- Equity at exit
- $17,520
- IRR
- 0.2%
- Equity multiple
- 1.01×
- Total profit
- $428
- Equity at exit
- $10,159
Cash invested: $32,900 (down + closing). Projections, not guarantees.
Landlord ↔ Tenant lean methodology
- Overall (STATE)
- 92 Strongly Landlord-Friendly
- State Arkansas
- 92 Strongly Landlord-Friendly · R+14
- County
- — inherits STATE
- City
- — inherits STATE
ZIP-level market 72903
- Rents YoY
- 4.9%
- Active inventory
- 200
- Price-to-rent
- 10.0×
Monthly cashflow live
- Estimated rent
- $984 high interval (Pro) →
- Mortgage (P&I)
- −$616
- Tax from tax record
- −$58 /mo · $700/yr
- Insurance
- −$49
- HOA
- −$0
- Vacancy / Maint / Mgmt
- −$207
- Net cashflow
- $54
Break-even live
Sensitivity live
| Price | -10% $120 | -5% $87 | +0% $54 | +5% $20 | +10% $-13 |
|---|---|---|---|---|---|
| Rent | -10% $-24 | -5% $15 | +0% $54 | +5% $92 | +10% $131 |
| Rate | -1.0pp $113 | -0.5pp $83 | base $54 | +0.5pp $23 | +1.0pp $-8 |
UW: 25.0% down · 7.5% · 30yr · 1.5% tax · 5.0% vac · 8.0% maint · 8.0% mgmt
Financing live
Cash to close
- Down payment
- $29,375
- Closing costs
- $3,525
- Reserves months
- —
- Total cash needed
- —
Loan-product check · same deal, 3 products live
Conventional
25% down · 7.5% · 30yr
- Down + closing
- —
- Monthly P&I
- —
- Monthly cashflow
- —
- DSCR
- —
- Eligible?
- —
Personal DTI + credit; lowest rate.
DSCR
20% down · 8.5% · 30yr
- Down + closing
- —
- Monthly P&I
- —
- Monthly cashflow
- —
- DSCR
- —
- Eligible?
- —
No personal income docs; deal must DSCR.
Hard money
10% down · 12.0% · 12mo
- Down + closing
- —
- Monthly P&I
- —
- Monthly cashflow
- —
- DSCR
- —
- Eligible?
- —
Short-term bridge; refi at stabilization.
Rent comps 30 comps
| Address | Beds | Baths | Sqft | Rent | $/sqft | DOM | Units | Dist |
|---|---|---|---|---|---|---|---|---|
| 1117 N 32nd St Fort Smith, AR | 2.0 | 1.0 | 744 | $850 | $1.14 | 15d | 1 | 0.25mi |
| 2905 Alabama Ave Fort Smith, AR | 1.0 | 1.0 | 711 | $795 | $1.12 | 5d | 1 | 0.26mi |
| 3600 Kinkead Ave Fort Smith, AR | 1.0–2.0 | 1.0 | 797 | $1,490 | $1.87 | 15d | 15 | 0.28mi |
| 3605 Barry Ave Fort Smith, AR | 2.0 | 1.0 | 562 | $845 | $1.50 | 22d | 3 | 0.45mi |
| 501 N May Ave Fort Smith, AR | 2.0 | 1.0 | 1022 | $825 | $0.81 | 22d | 1 | 0.46mi |
| 811 N 41st St Fort Smith, AR | 2.0 | 1.0 | 1306 | $900 | $0.69 | 15d | 1 | 0.48mi |
| 1453 N 35th St Fort Smith, AR | 2.0 | 1.0 | 913 | $900 | $0.99 | 22d | 1 | 0.53mi |
| 3014 Presley St Unit FB44 Fort Smith, AR | 2.0 | 1.5 | 1040 | $925 | $0.89 | 22d | 1 | 0.58mi |
| 3014 Presley St Fort Smith, AR | 1.0–2.0 | 1.0–1.5 | 782 | $925 | $1.18 | 15d | 4 | 0.58mi |
| 1224 N Albert Pike Ave Fort Smith, AR | 1.0–2.0 | 1.0 | 735 | $695 | $0.95 | 15d | 6 | 0.68mi |
| 802 S 25th St Fort Smith, AR | 1.0 | 1.0 | 716 | $745 | $1.04 | 13d | 2 | 0.81mi |
| 4515 Kinkead Ave Apt 7 Fort Smith, AR | 1.0 | 1.0 | 750 | $650 | $0.87 | 22d | 1 | 0.87mi |
| 2322 S I St Fort Smith, AR | 1.0–2.0 | 1.0 | 755 | $895 | $1.19 | 13d | 2 | 0.95mi |
| 813 N 48th St Fort Smith, AR | 2.0 | 1.0 | 1170 | $800 | $0.68 | 22d | 1 | 0.98mi |
| 2500 Dodson Ave Unit 1 Fort Smith, AR | 2.0 | 1.0 | 700 | $695 | $0.99 | 15d | 1 | 0.99mi |
| 3500 S N St Fort Smith, AR | 1.0–2.0 | 1.0–1.5 | 834 | $935 | $1.12 | 22d | 1 | 1.06mi |
| 3906 S N St Unit 3904 Fort Smith, AR | 2.0 | 1.5 | 1024 | $800 | $0.78 | 22d | 1 | 1.09mi |
| 800 S 19th St Fort Smith, AR | 2.0 | 1.0 | 1286 | $1,095 | $0.85 | 5d | 1 | 1.12mi |
| 1218 D St N Unit 1218 Fort Smith, AR | 1.0 | 1.0 | 726 | $550 | $0.76 | 22d | 1 | 1.15mi |
| 2820 S O St Fort Smith, AR | 2.0 | 1.5 | 1024 | $875 | $0.85 | 22d | 1 | 1.17mi |
| 4911 Free Ferry Rd Unit Vi Fort Smith, AR | 2.0 | 2.0 | 1232 | $1,150 | $0.93 | 22d | 1 | 1.23mi |
| 1700 S 28th St Unit 1 Fort Smith, AR | 2.0 | 1.0 | 850 | $795 | $0.94 | 15d | 1 | 1.25mi |
| 1331 S 46th St Fort Smith, AR | 1.0–2.0 | 1.0–1.5 | 1075 | $1,150 | $1.07 | 15d | 6 | 1.29mi |
| 601 S 14th St Unit 8 Fort Smith, AR | 1.0 | 1.0 | 700 | $495 | $0.71 | 22d | 1 | 1.33mi |
| 4300 Wynnewood Dr Unit 2 Fort Smith, AR | 2.0 | 2.0 | 1200 | $1,100 | $0.92 | 22d | 1 | 1.35mi |
| 2409 N 30th St Unit 1 Fort Smith, AR | 2.0 | 2.5 | 1258 | $950 | $0.76 | 22d | 1 | 1.35mi |
| 101 N 11th St Unit 112 Fort Smith, AR | 2.0 | 2.0 | 1040 | $1,240 | $1.19 | 22d | 1 | 1.36mi |
| 101 N 11th St Fort Smith, AR | 1.0–2.0 | 1.0–2.0 | 806 | $1,115 | $1.38 | 5d | 9 | 1.37mi |
| 1907 S N St Fort Smith, AR | 2.0 | 1.0 | 1114 | $950 | $0.85 | 22d | 1 | 1.40mi |
| 1307 S 17th St Fort Smith, AR | 3.0 | 1.5 | 1161 | $1,150 | $0.99 | 22d | 1 | 1.40mi |
Listing history 15 events
-
2026-06-21days on market $117,500 Active 19 DOM
-
2026-06-19days on market $117,500 Active 17 DOM
-
2026-06-18days on market $117,500 Active 16 DOM
-
2026-06-17days on market $117,500 Active 15 DOM
-
2026-06-16days on market $117,500 Active 14 DOM
-
2026-06-15days on market $117,500 Active 13 DOM
-
2026-06-14days on market $117,500 Active 11 DOM
-
2026-06-13days on market $117,500 Active 10 DOM
-
2026-06-10days on market $117,500 Active 8 DOM
-
2026-06-09days on market $117,500 Active 7 DOM
-
2026-06-08days on market $117,500 Active 6 DOM
-
2026-06-07days on market $117,500 Active 5 DOM
-
2026-06-03days on market $117,500 Active 1 DOM
-
2026-02-27price $117,500
-
2025-12-16$125,000 Active
ⓘ Source: listings_history table (triggers on properties + properties_extension) + one-shot
backfill from property_details.listing_events for pre-trigger history.
Tax reassessment forecast AR · Resets to sale price
- Current annual tax
- $700 · $58/mo
- Projected year-2 tax
- $752 · $63/mo
- Expected delta
- +$52/yr (+$4/mo · 7.4%)
ⓘ Screening estimate from a state-policy table — verify with the county assessor before closing.
Climate risk First Street
- Flood 1/10 Low FEMA zone X (unshaded) · 0% chance over 30 yrs
- Wildfire 1/10 Low
- Heat 7/10 Severe 7 d/yr ≥111°F today · 20 d/yr by 30 yrs out
- Wind 2/10 Low 3% chance of damaging wind over 30 yrs
- Air quality 2/10 Low 0 unhealthy d/yr today · 1 by 30 yrs out
Nearby sold comps map
Loading sold comps map…
Walkable amenities ~0.75 mi
Loading nearby amenities…
Taxation est. · year 1
- Rental income
- $11,803
- − Mortgage interest
- −$6,582
- − Property taxes
- −$700
- − Insurance
- −$588
- − Repairs & maintenance
- −$944
- − Management
- −$944
- − Depreciation
- −$3,418
- Taxable loss
- −$1,373
- Est. tax savings @ 24.0%
- +$330
- After-tax cash flow
- $972/yr
For passive investors: Depreciation is non-cash, so a rental often shows a tax loss while cash-flowing — sheltering income. Rental losses are passive: they offset passive income freely, and up to $25,000/yr can offset ordinary (W-2) income if you actively participate and your MAGI is under $100k (phasing out to $0 by $150k); unused losses carry forward. On sale, claimed depreciation is recaptured at up to 25%, and gains may owe capital-gains tax (a 1031 exchange can defer both). Figures are a year-1 estimate at your 24.0% rate — not tax advice; consult a CPA.
Schools (NCES district)
- District
- Fort Smith School District
- NCES district ID
- 0506330
- Math proficiency
- 35% ▼ -11.00%
- Reading proficiency
- 39% ▼ -7.00%
- Median HH income
- $36,066
- Composite
- 30.66/100
- National rank
- #6183
- State rank
- #106 of 238 in AR
Livability — Fort Smith
- Score
- 65/100
- State rank
- #151
- US rank
- #13185
Category grades
Schools grade is shown separately in the Schools card above.
Census & demographics
- Census place
- Fort Smith, AR
- County
- Sebastian County · 99,312 people
- City population
- 94,356
- Metro
- Fort Smith, AR-OK
- Population (ZIP)
- 27,242
- Household income
- $61,434
- Rent vs Own
- Severe rent burden
- 1009.0
Population outlook (Sebastian County) Hauer SSP2
- Today (2025)
- 133,992 people
- By 2030
- 136,620 · +2.0%
- By 2040
- 140,832 · +5.1%
- By 2050
- 143,301 · +6.9%
- By 2075
- 147,964 · +10.4%
- By 2100
- 145,848 · +8.8%
Race, ethnicity, and origin ACS 2023
- Neighborhood character
- Predominantly White (71%)
- Race & ethnicity
- White 71% Hispanic / Latino 10% Two or more races 10% Black 8% Asian 3%
- Hispanic origin (detail)
- Mexican 7%
- Common ancestry
- Slovak 2% Serbian 2% Iranian 2%
- Foreign-born
- 5% · Canada, Vietnam
- Languages at home
- 90% English-only · Spanish 7% Vietnamese 2% Other Asian/Pacific 1%
Political lean MEDSL · Sebastian
- 2024 margin
- Solid R (+37.5) · D 30.0% · R 67.6% · Other 2.4%
- 2008→2024 swing
- -2.9pp toward R · 2008: -34.6pp · 2024: -37.5pp
- All cycles
- 2024: R+37.5 2020: R+35.5 2016: R+38.1 2012: R+37.1 2008: R+34.6
Not yet ingested
- Civics
- —
Market trends
- HPI YoY
- ▼ -183.19%
- Current HPI
- 201.125
- Rent YoY
- ▲ 4.90%
- Metro
- Fort Smith, AR-OK
- State GDP YoY
- ▲ 3.80%
- F500 in state
- 10
Industry mix (Fortune 500 HQ in AR)
| Industry | F500 HQs | Revenue |
|---|---|---|
| Retail | 1 | $681B |
|
||
| Food / Agriculture | 1 | $53B |
|
||
| Retail / Energy | 1 | $22B |
|
||
| Transportation / Logistics | 1 | $12B |
|
||
| Energy | 1 | $4B |
|
||
Price history
-6.0% since first listed2 events — show timeline
- 2026-02-27 Price Changed $117,500 WRVBOR
- 2025-12-16 Listed $125,000 WRVBOR
Property tax history
+3.4%/yrLatest (2025): $700 · +9.0% YoY. Source: county tax records.
Cash-flow waterfall
monthlySold comps — $/sqft
last 12 mo · ≤1 miLoading sold comps…