 🏷️ Likely Rental
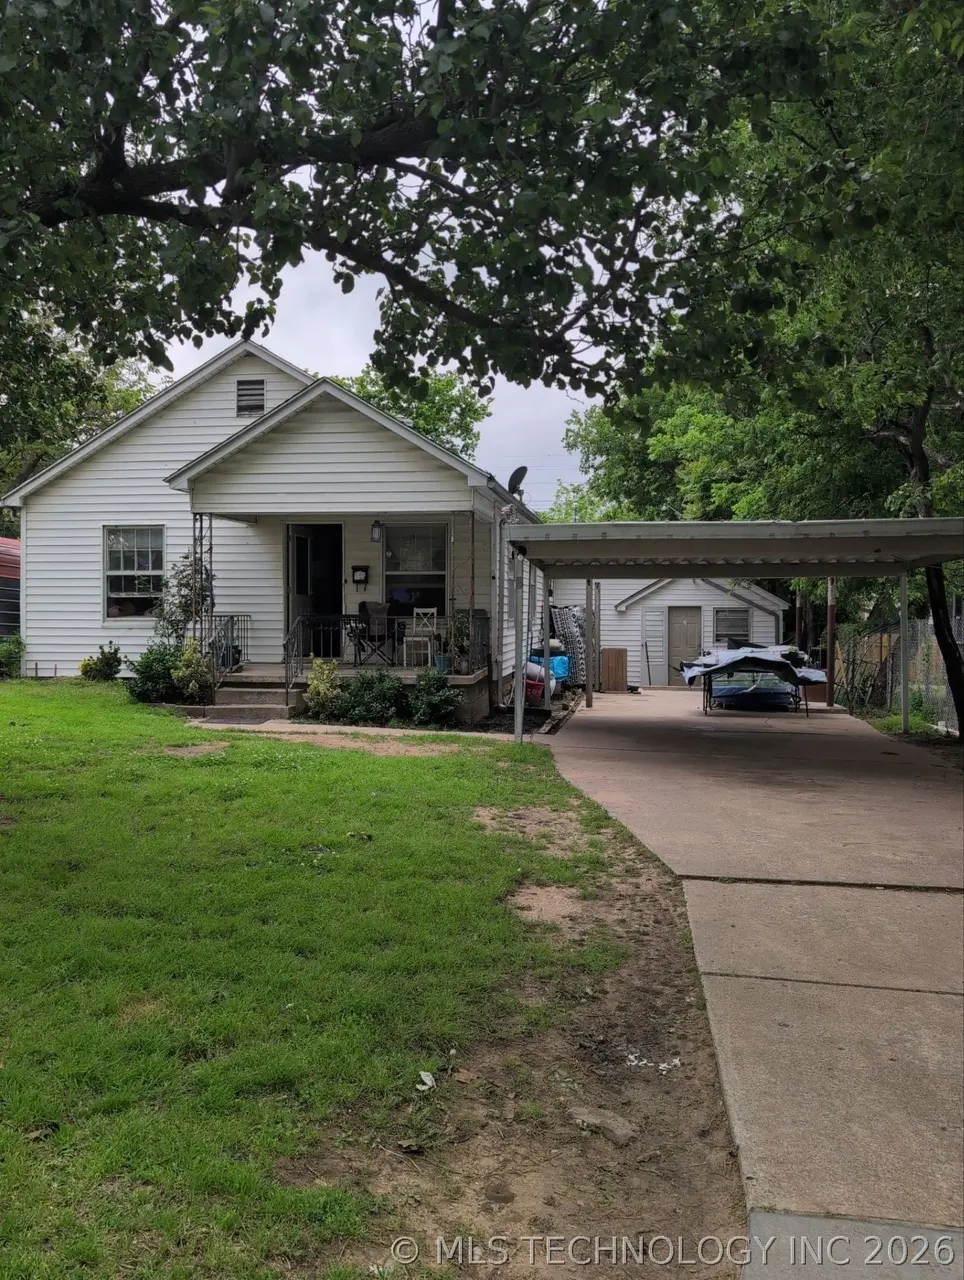
1316 N Allegheny Ave · Tulsa, OK
Flood risk 1/10 · Minimal
- FEMA flood zone
- X (unshaded)
- Chance of flooding over 30 yrs
- 0.0%
- Est. flood insurance / yr
- $507 – $1,088
Fire risk 1/10 · Minimal
- Est. fire insurance / yr
- $2,463 – $4,575
Heat risk 6/10 · Moderate
- Hot days now (above 110°F)
- 7 days/yr
- Hot days in 30 yrs
- 18 days/yr
Wind risk 2/10 · Minimal
- Chance of severe wind over 30 yrs
- 4.0%
Air-quality risk 3/10 · Minor
- Unhealthy air days now
- 2 days/yr
- Unhealthy air days in 30 yrs
- 3 days/yr
Risk factors via First Street. Map © Google.
Why this score? — see what drove the B- grade
The composite is a weighted blend of 9 inputs, each scored 0–100. Each bar is that input's sub-score; the figure is the points it added to the 100-point composite (weight × sub-score).
- Cash flow +25.1/30.0
- ARV discount +15.0/15.0
- DSCR +8.2/10.0
- 1% rule +6.0/10.0
- Livability +3.8/5.0
- Rent growth +3.6/5.0
- Condition / age +2.5/5.0
- Schools +0.8/10.0
- Appreciation +0.0/10.0
$129,000
🖨 Deal sheet (PDF) 📄 Offer letter ✓ Due diligence
Listing remarks
Great investment opportunity in Tulsa! Located at 1316 N Allegheny Ave, this property offers strong potential for both investors and future homeowners. The home is currently tenant-occupied with a long-term renter of over 6 years who pays $1,100/month plus all utilities, making this a true turnkey rental opportunity from day one. The tenant is currently on a month-to-month lease, giving the new owner full flexibility—continue collecting rental income immediately or transition the property into an owner-occupied home. This flexibility makes it ideal for investors looking for cash flow or buyers willing to add a little TLC and build equity. The property is being sold as-is and is priced
Key facts
- Month to month lease
- Tenant occupied
- Solid rental area
Tags
Property features AI
Exterior
- Parking: 2-car garage; Carport
- Security: No safety shelter
- Utilities: Cable available; Electricity available; Natural gas available; Public water; Public sewer
- Home design: Single-story home; Faces east; Entry on first floor
- Construction: Built with vinyl siding and wood frame; Asphalt/fiberglass roof; Crawlspace foundation; Year built per public records
- Exterior features: Covered porch; Porch; Privacy fencing; Shed(s); Garage apartment; No additional exterior features listed
Interior
- Kitchen: Cooktop; Oven
- Bedrooms: Master bedroom (first floor); Bedroom (first floor)
- Flooring: Wood flooring
- Bathrooms: 1 full bathroom
- Heating & cooling: Central heating; Floor furnace; Gas heating; Central air conditioning
- Interior features: Wood window frames; Laminate counters; Gas range connection; Crawl space basement
- Laundry & utility: Gas water heater
Neighborhood map
What this means for you Summary
Snapshot
- This is a 4-bed/1.0-bath single-family listed at $129k.
Deal economics
- At list price, monthly cash flow is $286 ($3k/yr) — positive.
- The deal already cash-flows at list — no discount required.
- Meets the 1% rule at list price ($1k rent vs $129k).
- Recommended offer: $125k (3.0% below list) — sets the bar for market timing.
- Cap rate 8.9% vs local median 3.8% in Tulsa — top-decile yield for the area; either an underpriced asset or a hidden risk that comps aren't pricing in. Stress-test before assuming the spread holds.
Location & tenants
- Location reads 75/100 on livability (#13 in OK, #4,058 nationally) — a middle-class / working-renter tenant base. Strengths: amenities A+, commute A+, cost of living A+; Watch: crime F, employment D-.
- Tulsa (urban): math 7% / reading 12% proficiency, ranked #250 of 270 in OK (top 93%) — low school quality limits family demand, transient renter base, plan for 1-2y turnover; 76% free/reduced lunch — lower-income household profile, screen leases tightly.
- Zoned schools: Project Accept Traice Es (math 10% / reading 10%, grade F, #695 of 845 statewide, top 84%, 558 students, 0% FRL); Monroe Demonstration Ms (math 0% / reading 2%, grade F, #344 of 345 statewide, top 100%, 688 students, 0% FRL); Booker T. Washington Hs (math 41% / reading 61%, grade D+, #2 of 447 statewide, top 0%, 1,280 students, 0% FRL) — zoned schools average 0% FRL vs 76% district-wide (76 pts lower); this property's tenant base skews higher-income than the district average.
- Market conditions: Rents rising fast (+4.6%/yr); 89 active listings in the ZIP; 10 comparable units currently listed for rent nearby; rentals at typical pace (median 26d on market — plan ~3-4 weeks tenant-placement turnaround); lower-income renter base — watch delinquency; 2,818 units permitted in Tulsa County in 2024 (518 in 5+ unit buildings).
- This rent runs 38% of the median local income ($45k/yr) — at the standard rent-burdened threshold; future hikes will face affordability resistance.
Forward outlook
- Local home prices are declining (-3.0%/yr); year-one equity from $892 of loan paydown is wiped out by about $4k of value loss. Plan a longer hold.
- Tulsa County population projected at +30% by 2050 — long-run rental-demand tailwind backs the buy-and-hold thesis.
- At projected returns (-3.0% appreciation + 4.6% rent growth), your $36k cash investment doubles in ~10 years — after that, you're playing with house money.
Negotiation context
- It's been on market 51 days — a 3% lower offer ($125k) is reasonable based on typical stale-listing flexibility.
- Current owner paid $85k; list at $129k implies a 52% gain — meaningful room to come down on a strong offer.
Risks & watch-outs
- Watch-outs: built in 1950 — expect roof / HVAC / electrical / plumbing capex.
- Climate carrying-cost: extreme-heat days projected 7→18/yr by 2055 (HVAC capex compounding) — expect insurance premiums to compound above CPI over the hold.
Questions for the listing agent
- It's been on market 51 days. Have you received any prior offers? Is the seller open to a 3% concession, seller financing, or rate buy-down credit?
- Built in 1950 — when were the roof, HVAC, electrical panel, plumbing, and water heater last replaced?
- Is there a deadline driving the sale (1031 exchange, divorce, estate, relocation)? That informs how much negotiation room exists.
- Schools are F-rated, which usually means shorter tenancies and higher turnover. Who's the typical renter profile here, and what's been the actual vacancy rate?
- Crime grade is F in this area — have there been break-ins, vandalism, or insurance claims at this property in the last 3 years? What carrier currently insures it and at what premium?
- What's the average days-on-market for RENTAL listings here right now (not sales)? A rising rental-DOM trend means longer vacancies and softer asking-rent achievability than the comps imply.
- What's the recent tenant-quality profile in this submarket — average credit score on applications, eviction rate, late-payment / NSF rate, and stable-employment percentage? A property-management company in the area should have these aggregated.
- How much new for-sale + rental construction is in the pipeline within 1–3 miles? Heavy new supply typically softens prices + rents 12–24 months out; constrained supply supports both.
Investment metrics
- 1% rule
- 1.10% ✓
- Cap rate
- 8.95%
- Cash-on-cash
- 9.49%
- DSCR
- 1.42
- GRM
- 7.5
CMA / ARV
- ARV (on-the-fly)
- $211,410
- Comps found
- 12
Show comp detail 12 sales within ~0.75 mi
| Address | Dist | Beds/Ba | Sqft | Sold | Price | $/sf | Match |
|---|---|---|---|---|---|---|---|
| 1223 N Vandalia Ave | 0.19mi | 3/1.5 (-1) | 1,468 (+1%) | 17mo | $114,000 | $78 | 68 |
| 4636 E Independence St | 0.56mi | 4/2.0 | 1,471 (+1%) | 10mo | $228,000 | $155 | 60 |
| 4603 E Independence St | 0.58mi | 4/2.5 | 1,447 (-1%) | 12mo | $232,500 | $161 | 55 |
| 1302 N Toledo Ave | 0.31mi | 4/2.0 | 1,300 (-11%) | 13mo | $185,500 | $143 | 52 |
| 4902 E Haskell St N | 0.65mi | 4/2.0 | 1,439 (-1%) | 14mo | $160,000 | $111 | 52 |
| 4726 E Marshall St | 0.21mi | 3/2.0 (-1) | 1,264 (-13%) | 11mo | $97,000 | $77 | 50 |
| 2035 N Erie Ave | 0.75mi | 4/2.0 | 1,369 (-6%) | 2mo | $198,000 | $145 | 49 |
| 818 N Toledo Ave | 0.59mi | 3/2.0 (-1) | 1,348 (-8%) | 3mo | $217,000 | $161 | 48 |
| 4946 E Haskell Pl | 0.59mi | 3/3.0 (-1) | 1,384 (-5%) | 7mo | $135,000 | $98 | 45 |
| 1441 N Kingston Ave | 0.64mi | 3/1.0 (-1) | 1,326 (-9%) | 7mo | $100,000 | $75 | 44 |
| 911 N Urbana Ave | 0.52mi | 4/2.0 | 1,266 (-13%) | 13mo | $221,000 | $175 | 38 |
| 5931 E Marshall Pl | 0.64mi | 3/1.0 (-1) | 1,250 (-14%) | 10mo | $184,000 | $147 | 33 |
Match score weights: distance 35% · size 25% · config 20% · recency 20%. Top-matched comps best support the ARV.
Projected returns pro-forma
-3.0% appreciation · 4.57% rent growth · sell at horizon
- IRR
- -0.3%
- Equity multiple
- 0.99×
- Total profit
- $-436
- Equity at exit
- $19,234
- IRR
- 10.9%
- Equity multiple
- 1.91×
- Total profit
- $32,691
- Equity at exit
- $11,154
Cash invested: $36,120 (down + closing). Projections, not guarantees.
Landlord ↔ Tenant lean methodology
- Overall (STATE)
- 83 Strongly Landlord-Friendly
- State Oklahoma
- 83 Strongly Landlord-Friendly · R+20
- County
- — inherits STATE
- City
- — inherits STATE
ZIP-level market 74115
- Home prices YoY
- -9.7%
- Rents YoY
- 4.6%
- Active inventory
- 89
- Price-to-rent
- 7.5×
Monthly cashflow live
- Estimated rent
- $1,425 high interval (Pro) →
- Mortgage (P&I)
- −$676
- Tax from tax record
- −$110 /mo · $1,321/yr
- Insurance
- −$54
- HOA
- −$0
- Vacancy / Maint / Mgmt
- −$299
- Net cashflow
- $286
Break-even live
Sensitivity live
| Price | -10% $359 | -5% $322 | +0% $286 | +5% $249 | +10% $213 |
|---|---|---|---|---|---|
| Rent | -10% $173 | -5% $229 | +0% $286 | +5% $342 | +10% $398 |
| Rate | -1.0pp $351 | -0.5pp $318 | base $286 | +0.5pp $252 | +1.0pp $218 |
UW: 25.0% down · 7.5% · 30yr · 1.5% tax · 5.0% vac · 8.0% maint · 8.0% mgmt
Financing live
Cash to close
- Down payment
- $32,250
- Closing costs
- $3,870
- Reserves months
- —
- Total cash needed
- —
Loan-product check · same deal, 3 products live
Conventional
25% down · 7.5% · 30yr
- Down + closing
- —
- Monthly P&I
- —
- Monthly cashflow
- —
- DSCR
- —
- Eligible?
- —
Personal DTI + credit; lowest rate.
DSCR
20% down · 8.5% · 30yr
- Down + closing
- —
- Monthly P&I
- —
- Monthly cashflow
- —
- DSCR
- —
- Eligible?
- —
No personal income docs; deal must DSCR.
Hard money
10% down · 12.0% · 12mo
- Down + closing
- —
- Monthly P&I
- —
- Monthly cashflow
- —
- DSCR
- —
- Eligible?
- —
Short-term bridge; refi at stabilization.
Rent comps 10 comps
| Address | Beds | Baths | Sqft | Rent | $/sqft | DOM | Units | Dist |
|---|---|---|---|---|---|---|---|---|
| 1404 N Kingston Ave Tulsa, OK | 4.0 | 1.0 | 1279 | $1,350 | $1.06 | 25d | 1 | 0.62mi |
| 839 N New Haven Ave Tulsa, OK | 3.0 | 1.0 | 1238 | $1,250 | $1.01 | 25d | 1 | 0.75mi |
| 4008 E Virgin St Tulsa, OK | 3.0 | 1.0 | 1125 | $1,400 | $1.24 | 5d | 1 | 0.88mi |
| 728 N Marion Ave Tulsa, OK | 3.0 | 2.0 | 1405 | $1,305 | $0.93 | 18d | 1 | 0.92mi |
| 4257 E Young Pl Tulsa, OK | 4.0 | 1.0 | 1152 | $1,150 | $1.00 | 25d | 1 | 1.10mi |
| 43 S Toledo Ave Tulsa, OK | 3.0 | 2.0 | 884 | $1,650 | $1.87 | 18d | 1 | 1.12mi |
| 1507 N Florence Ave Tulsa, OK | 3.0 | 1.0 | 1000 | $1,100 | $1.10 | 25d | 1 | 1.25mi |
| 1462 N College Ave Tulsa, OK | 3.0 | 1.0 | 1150 | $1,250 | $1.09 | 25d | 1 | 1.34mi |
| 5347 E 5th St Tulsa, OK | 3.0 | 1.0 | 1181 | $1,600 | $1.35 | 25d | 1 | 1.41mi |
| 3531 E 4th St Tulsa, OK | 3.0 | 2.0 | 1652 | $1,745 | $1.06 | 25d | 1 | 1.47mi |
Listing history 17 events
-
2026-06-22days on market $129,000 Active 51 DOM
-
2026-06-18days on market $129,000 Active 48 DOM
-
2026-06-17days on market $129,000 Active 47 DOM
-
2026-06-16days on market $129,000 Active 46 DOM
-
2026-06-15days on market $129,000 Active 45 DOM
-
2026-06-13days on market $129,000 Active 43 DOM
-
2026-06-10days on market $129,000 Active 40 DOM
-
2026-06-09days on market $129,000 Active 39 DOM
-
2026-06-08days on market $129,000 Active 38 DOM
-
2026-06-07days on market $129,000 Active 37 DOM
-
2026-06-05days on market $129,000 Active 34 DOM
-
2026-06-03days on market $129,000 Active 33 DOM
-
2026-06-02days on market $129,000 Active 32 DOM
-
2026-06-01days on market $129,000 Active 31 DOM
-
2026-05-31days on market $129,000 Active 30 DOM
-
2026-05-01$129,000 Active
-
2022-07-14soldstatus $85,000
ⓘ Source: listings_history table (triggers on properties + properties_extension) + one-shot
backfill from property_details.listing_events for pre-trigger history.
Tax reassessment forecast OK · Resets to sale price
- Current annual tax
- $1,321 · $110/mo
- Projected year-2 tax
- $1,321 · $110/mo
- Expected delta
- $0/yr ($0/mo · 0.0%)
ⓘ Screening estimate from a state-policy table — verify with the county assessor before closing.
Climate risk First Street
- Flood 1/10 Low FEMA zone X (unshaded) · 0% chance over 30 yrs
- Wildfire 1/10 Low
- Heat 6/10 Major 7 d/yr ≥110°F today · 18 d/yr by 30 yrs out
- Wind 2/10 Low 4% chance of damaging wind over 30 yrs
- Air quality 3/10 Moderate 2 unhealthy d/yr today · 3 by 30 yrs out
Nearby sold comps map
Loading sold comps map…
Walkable amenities ~0.75 mi
Loading nearby amenities…
Taxation est. · year 1
- Rental income
- $17,103
- − Mortgage interest
- −$7,226
- − Property taxes
- −$1,321
- − Insurance
- −$645
- − Repairs & maintenance
- −$1,368
- − Management
- −$1,368
- − Depreciation
- −$3,753
- Taxable income
- $1,422
- Est. tax owed @ 24.0%
- −$341
- After-tax cash flow
- $3,086/yr
For passive investors: Depreciation is non-cash, so a rental often shows a tax loss while cash-flowing — sheltering income. Rental losses are passive: they offset passive income freely, and up to $25,000/yr can offset ordinary (W-2) income if you actively participate and your MAGI is under $100k (phasing out to $0 by $150k); unused losses carry forward. On sale, claimed depreciation is recaptured at up to 25%, and gains may owe capital-gains tax (a 1031 exchange can defer both). Figures are a year-1 estimate at your 24.0% rate — not tax advice; consult a CPA.
Schools (NCES district)
- District
- Tulsa
- NCES district ID
- 4030240
- Math proficiency
- 7% ▼ -9.00%
- Reading proficiency
- 12% ▼ -7.00%
- Median HH income
- $37,895
- Composite
- 8.04/100
- National rank
- #9919
- State rank
- #250 of 270 in OK
Livability — Tulsa
- Score
- 75/100
- State rank
- #13
- US rank
- #4058
Category grades
Schools grade is shown separately in the Schools card above.
Census & demographics
- Census place
- Tulsa, OK
- County
- Tulsa County · 640,811 people
- City population
- 389,418
- Metro
- Tulsa, OK
- Population (ZIP)
- 24,297
- Household income
- $44,608
- Rent vs Own
- Severe rent burden
- 805.0
Population outlook (Tulsa County) Hauer SSP2
- Today (2025)
- 723,846 people
- By 2030
- 766,033 · +5.8%
- By 2040
- 851,386 · +17.6%
- By 2050
- 938,389 · +29.6%
- By 2075
- 1,166,011 · +61.1%
- By 2100
- 1,350,277 · +86.5%
Race, ethnicity, and origin ACS 2023
- Neighborhood character
- Diverse neighborhood (Simpson 0.68)
- Race & ethnicity
- Hispanic / Latino 44% White 33% Two or more races 19% Black 13% Native American 5%
- Hispanic origin (detail)
- Mexican 39%
- Common ancestry
- Italian 1% Slovak 1% Lithuanian 1%
- Foreign-born
- 19% · Canada
- Languages at home
- 57% English-only · Spanish 42%
Political lean MEDSL · Tulsa
- 2024 margin
- R (+15.2) · D 41.3% · R 56.5% · Other 2.2%
- 2008→2024 swing
- +9.2pp toward D · 2008: -24.5pp · 2024: -15.2pp
- All cycles
- 2024: R+15.2 2020: R+15.6 2016: R+22.9 2012: R+27.4 2008: R+24.5
Not yet ingested
- Civics
- —
Market trends
- HPI YoY
- ▼ -26.82%
- Current HPI
- 251.0869
- Rent YoY
- ▲ 4.57%
- Metro
- Tulsa, OK
- State GDP YoY
- ▲ 1.55%
- F500 in state
- 6
Industry mix (Fortune 500 HQ in OK)
| Industry | F500 HQs | Revenue |
|---|---|---|
| Energy | 3 | $48B |
|
||
Price history
+51.8% since first listed2 events — show timeline
- 2026-05-01 Listed $129,000 MLS Technology, Inc.
- 2022-07-14 Sold (Public Records) $85,000 Public Records
Property tax history
+3.0%/yrLatest (2025): $1,321 · +8.6% YoY. Source: county tax records.
Cash-flow waterfall
monthlySold comps — $/sqft
last 12 mo · ≤1 miLoading sold comps…