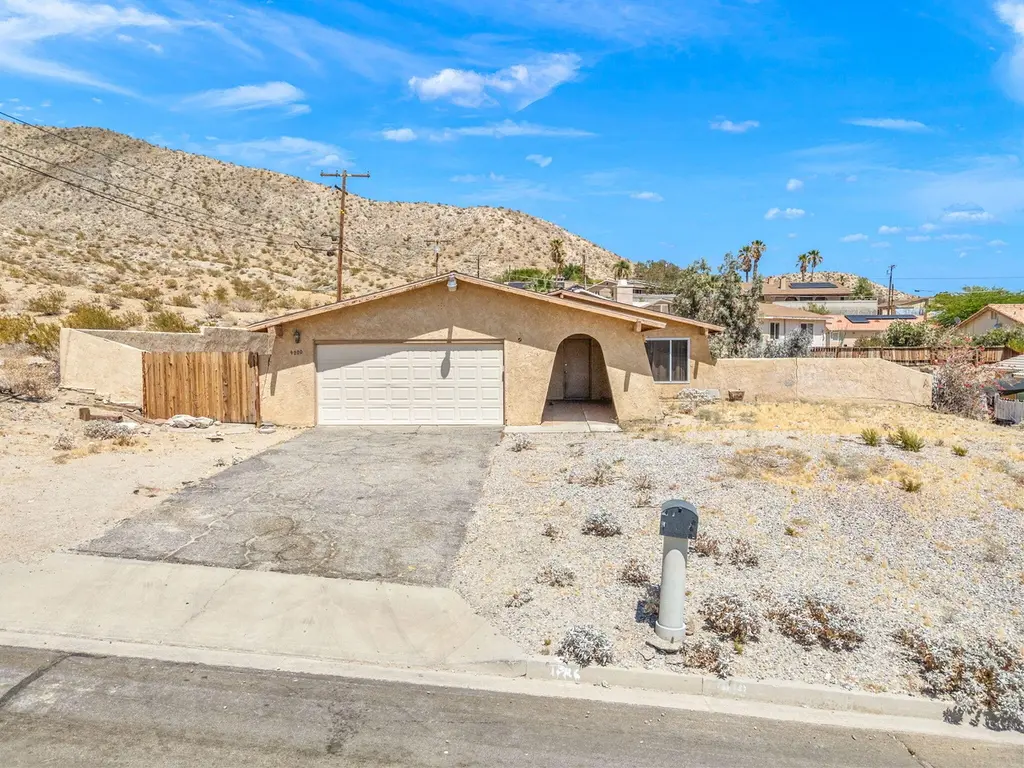
9000 West Dr · Desert Hot Springs, CA
Flood risk 1/10 · Minimal
- FEMA flood zone
- X (unshaded)
- Chance of flooding over 30 yrs
- 0.0%
- Est. flood insurance / yr
- $507 – $1,088
Fire risk 6/10 · Moderate
- Est. fire insurance / yr
- $659 – $1,223
Heat risk 8/10 · Major
- Hot days now (above 109°F)
- 8 days/yr
- Hot days in 30 yrs
- 23 days/yr
Wind risk 1/10 · Minimal
- Chance of severe wind over 30 yrs
- —
Air-quality risk 5/10 · Moderate
- Unhealthy air days now
- 7 days/yr
- Unhealthy air days in 30 yrs
- 10 days/yr
Risk factors via First Street. Map © Google.
Why this score? — see what drove the D+ grade
The composite is a weighted blend of 9 inputs, each scored 0–100. Each bar is that input's sub-score; the figure is the points it added to the 100-point composite (weight × sub-score).
- ARV discount +15.0/15.0
- Cash flow +14.1/30.0
- DSCR +4.3/10.0
- 1% rule +3.5/10.0
- Rent growth +3.4/5.0
- Schools +2.7/10.0
- Livability +2.5/5.0
- Condition / age +2.5/5.0
- Appreciation +0.0/10.0
$305,000
🖨 Deal sheet (PDF) 📄 Offer letter ✓ Due diligence
Listing remarks
This classic Desert View home is located on a LARGE PRIME LOT!! The location cannot get any better! A majestic view of the Desert Floor and city lights and the magnificent San Jacinto Mountain and your back yard view is open Desert and more expansive northern mountain views. Located minutes from Highway 62. This is a great opportunity for a contractor investment property, family or a short term rental!!
Key facts
- Large prime lot
- San jacinto mountain
- Majestic view
Tags
Property features AI
Finance
- Other: Listing terms may include Conventional and 1031 Exchange; possession at close of escrow; Short-term rental status unknown; will not consider lease
- HOA & community: No monthly association fee
Exterior
- Parking: Driveway; Attached 2-car garage (total 2 parking spaces)
- Security: No security features
- Utilities: Water provided by Mission Springs Water District; Sewer is connected and paid
- Home design: Single family detached residence; One story
- Construction: Stucco construction; Year built per assessor
- Exterior features: Stucco exterior; City lights, panoramic, mountain and desert views; Fee simple land; Use GPS for directions; Cross streets: West and Mission Lakes Dr; Not in a gated community
Interior
- Kitchen: Gas cooktop; Gas oven
- Flooring: Carpet; Linoleum
- Bathrooms: Two full bathrooms
- Heating & cooling: Central heating; Central air conditioning; Gas service for appliances/heating
- Interior features: Unfurnished; Family room; Dining area; No fireplace; Property sold as-is
- Laundry & utility: Laundry located in the garage
Neighborhood map
What this means for you Summary
Snapshot
- This is a 3-bed/2.0-bath single-family listed at $305k.
Deal economics
- At list price, monthly cash flow is $45 ($535/yr) — positive.
- The deal already cash-flows at list — no discount required.
- To meet the 1% rule (rent ≥ 1% of price), the offer needs to be $260k (14.9% below list).
- Recommended offer: $260k (14.9% below list) — sets the bar for 1% rule.
- Cap rate 6.5% vs local median 3.9% in Desert Hot Springs — top-decile yield for the area; either an underpriced asset or a hidden risk that comps aren't pricing in. Stress-test before assuming the spread holds.
Location & tenants
- Location reads 49/100 on livability (#1,149 in CA) — a working-class tenant base; expect higher turnover. Strengths: housing B+; Watch: crime D+, amenities F, commute F.
- Palm Springs Unified (suburban): math 21% / reading 42% proficiency, ranked #328 of 517 in CA (top 63%) — families likely to look elsewhere, expect single-tenant / working-renter base with shorter leases; 73% free/reduced lunch — lower-income household profile, screen leases tightly.
- Zoned schools: Bella Vista Elementary (755 students, 94% FRL); Painted Hills Middle (741 students, 98% FRL); Desert Hot Springs High (math 27% / reading 52%, grade F, #532 of 1,170 statewide, top 48%, 1,742 students, 98% FRL) — zoned schools average 97% FRL vs 73% district-wide (24 pts higher); higher-poverty schools than district average — tighter screening recommended.
- Market conditions: Rents rising (+3.7%/yr); 521 active listings in the ZIP; 22 comparable units currently listed for rent nearby; rentals at typical pace (median 24d on market — plan ~3-4 weeks tenant-placement turnaround); 9,195 units permitted in Riverside County in 2024 (1,512 in 5+ unit buildings).
- At $2,597/mo this rent would consume 58% of the median local household income ($54k/yr) (locally 2095% of renters already pay >50% of income on rent) — very limited rent-growth headroom before tenants either downsize or default.
Forward outlook
- Local home prices are declining (-3.0%/yr); year-one equity from $2k of loan paydown is wiped out by about $9k of value loss. Plan a longer hold.
- Riverside County population projected at +22% by 2050 — long-run rental-demand tailwind backs the buy-and-hold thesis.
Negotiation context
- Only 14 days on market — expect competitive offers; lowballing is unlikely to land.
- Current owner paid $120k; list at $305k implies a 154% gain — meaningful room to come down on a strong offer.
Risks & watch-outs
- Climate carrying-cost: major wildfire risk; extreme-heat days projected 8→23/yr by 2055 (HVAC capex compounding) — expect insurance premiums to compound above CPI over the hold.
Questions for the listing agent
- Built in 1979 — when were the roof, HVAC, electrical panel, plumbing, and water heater last replaced?
- Is there a deadline driving the sale (1031 exchange, divorce, estate, relocation)? That informs how much negotiation room exists.
- Schools are F-rated, which usually means shorter tenancies and higher turnover. Who's the typical renter profile here, and what's been the actual vacancy rate?
- Crime grade is D in this area — have there been break-ins, vandalism, or insurance claims at this property in the last 3 years? What carrier currently insures it and at what premium?
- The area grade is low — what's the realistic commute time and amenity access for the typical tenant pool here? Any planned neighborhood developments (good or bad) we should know about?
- What's the average days-on-market for RENTAL listings here right now (not sales)? A rising rental-DOM trend means longer vacancies and softer asking-rent achievability than the comps imply.
- What's the recent tenant-quality profile in this submarket — average credit score on applications, eviction rate, late-payment / NSF rate, and stable-employment percentage? A property-management company in the area should have these aggregated.
- How much new for-sale + rental construction is in the pipeline within 1–3 miles? Heavy new supply typically softens prices + rents 12–24 months out; constrained supply supports both.
Investment metrics
- 1% rule
- 0.85% ✗
- Cap rate
- 6.47%
- Cash-on-cash
- 0.63%
- DSCR
- 1.03
- GRM
- 9.8
CMA / ARV
- ARV (on-the-fly)
- $389,120
- Comps found
- 12
Show comp detail 12 sales within ~0.75 mi
| Address | Dist | Beds/Ba | Sqft | Sold | Price | $/sf | Match |
|---|---|---|---|---|---|---|---|
| 66235 Avenue Suenos | 0.31mi | 4/2.0 (+1) | 1,248 (-2%) | 0mo | $380,000 | $304 | 76 |
| 66247 Avenida Suenos | 0.32mi | 3/2.0 | 1,322 (+3%) | 6mo | $340,000 | $257 | 74 |
| 66087 Avenida Cadena | 0.35mi | 3/2.0 | 1,210 (-6%) | 1mo | $340,000 | $281 | 74 |
| 9708 Del Ray Ln | 0.35mi | 3/2.0 | 1,200 (-6%) | 3mo | $400,000 | $333 | 71 |
| 66161 Avenida Dorado | 0.42mi | 4/2.0 (+1) | 1,248 (-2%) | 6mo | $369,900 | $296 | 66 |
| 66195 Santa Rosa | 0.60mi | 3/2.0 | 1,239 (-3%) | 5mo | $342,500 | $276 | 62 |
| 66124 Avenida Ladera | 0.43mi | 3/2.0 | 1,134 (-11%) | 2mo | $337,500 | $298 | 59 |
| 66308 Mission Lakes Blvd | 0.55mi | 3/2.0 | 1,405 (+10%) | 2mo | $440,000 | $313 | 56 |
| 66180 14th St | 0.63mi | 2/2.0 (-1) | 1,375 (+7%) | 2mo | $335,000 | $244 | 51 |
| 9836 El Mirador Blvd | 0.63mi | 3/2.0 | 1,134 (-11%) | 0mo | $375,000 | $331 | 51 |
| 66423 San Marcus Rd | 0.75mi | 2/2.0 (-1) | 1,206 (-6%) | 4mo | $465,000 | $386 | 47 |
| 10304 Santa Cruz Rd | 0.66mi | 3/2.0 | 1,134 (-11%) | 4mo | $410,000 | $362 | 46 |
Match score weights: distance 35% · size 25% · config 20% · recency 20%. Top-matched comps best support the ARV.
Projected returns pro-forma
-3.0% appreciation · 3.66% rent growth · sell at horizon
- IRR
- -14.6%
- Equity multiple
- 0.47×
- Total profit
- $-44,873
- Equity at exit
- $45,476
- IRR
- -4.9%
- Equity multiple
- 0.67×
- Total profit
- $-28,296
- Equity at exit
- $26,371
Cash invested: $85,400 (down + closing). Projections, not guarantees.
Landlord ↔ Tenant lean methodology
- Overall (STATE)
- 18 Strongly Tenant-Friendly
- State California
- 18 Strongly Tenant-Friendly · D+13
- County
- — inherits STATE
- City
- — inherits STATE
ZIP-level market 92240
- Home prices YoY
- -19.6%
- Rents YoY
- 3.7%
- Active inventory
- 521
- Price-to-rent
- 9.8×
Monthly cashflow live
- Estimated rent
- $2,597 high interval (Pro) →
- Mortgage (P&I)
- −$1,599
- Tax from tax record
- −$280 /mo · $3,363/yr
- Insurance
- −$127
- HOA
- −$0
- Vacancy / Maint / Mgmt
- −$545
- Net cashflow
- $45
Break-even live
Sensitivity live
| Price | -10% $217 | -5% $131 | +0% $45 | +5% $-42 | +10% $-128 |
|---|---|---|---|---|---|
| Rent | -10% $-161 | -5% $-58 | +0% $45 | +5% $147 | +10% $250 |
| Rate | -1.0pp $198 | -0.5pp $122 | base $45 | +0.5pp $-34 | +1.0pp $-115 |
UW: 25.0% down · 7.5% · 30yr · 1.5% tax · 5.0% vac · 8.0% maint · 8.0% mgmt
Financing live
Cash to close
- Down payment
- $76,250
- Closing costs
- $9,150
- Reserves months
- —
- Total cash needed
- —
Loan-product check · same deal, 3 products live
Conventional
25% down · 7.5% · 30yr
- Down + closing
- —
- Monthly P&I
- —
- Monthly cashflow
- —
- DSCR
- —
- Eligible?
- —
Personal DTI + credit; lowest rate.
DSCR
20% down · 8.5% · 30yr
- Down + closing
- —
- Monthly P&I
- —
- Monthly cashflow
- —
- DSCR
- —
- Eligible?
- —
No personal income docs; deal must DSCR.
Hard money
10% down · 12.0% · 12mo
- Down + closing
- —
- Monthly P&I
- —
- Monthly cashflow
- —
- DSCR
- —
- Eligible?
- —
Short-term bridge; refi at stabilization.
Rent comps 22 comps
| Address | Beds | Baths | Sqft | Rent | $/sqft | DOM | Units | Dist |
|---|---|---|---|---|---|---|---|---|
| 66144 Avenida Cadena Desert Hot Springs, CA | 3.0 | 2.0 | 1488 | $2,395 | $1.61 | 45d | 1 | 0.32mi |
| 66144 Avenida Cadena Desert Hot Springs, CA | 3.0 | 2.0 | 1488 | $2,295 | $1.54 | 20d | 1 | 0.32mi |
| 66163 Avenida Cadena Desert Hot Springs, CA | 3.0 | 2.0 | 1134 | $2,500 | $2.20 | 1d | 1 | 0.36mi |
| 65548 Avenida Barona Desert Hot Springs, CA | 3.0 | 2.0 | 1200 | $2,799 | $2.33 | 12d | 1 | 0.52mi |
| 65548 Avenida Barona Unit NA Desert Hot Springs, CA | 3.0 | 2.0 | 1200 | $2,799 | $2.33 | 1d | 1 | 0.52mi |
| 66113 14th St Desert Hot Springs, CA | 3.0 | 2.0 | 1219 | $2,500 | $2.05 | 20d | 1 | 0.63mi |
| 10270 Santa Cruz Rd Desert Hot Springs, CA | 4.0 | 2.0 | 1248 | $2,900 | $2.32 | 25d | 1 | 0.65mi |
| 65439 Via del Sol Desert Hot Springs, CA | 3.0 | 2.0 | 1811 | $2,500 | $1.38 | 16d | 1 | 0.73mi |
| 9750 Valencia Dr Desert Hot Springs, CA | 3.0 | 2.0 | 1638 | $3,165 | $1.93 | 23d | 1 | 0.74mi |
| 9190 Puesta del Sol Desert Hot Springs, CA | 3.0 | 2.0 | 1708 | $3,600 | $2.11 | 19d | 1 | 0.80mi |
| 66560 Ocotillo Rd Desert Hot Springs, CA | 4.0 | 2.0 | 1678 | $2,999 | $1.79 | 6d | 1 | 0.88mi |
| 10792 Santa Cruz Rd Desert Hot Springs, CA | 3.0 | 2.5 | 1321 | $2,295 | $1.74 | 26d | 1 | 0.89mi |
| 66600 San Marcus Rd Desert Hot Springs, CA | 3.0 | 2.0 | 1657 | $3,200 | $1.93 | 45d | 1 | 0.90mi |
| 10510 Ocotillo Rd Desert Hot Springs, CA | 3.0 | 2.0 | 1400 | $3,000 | $2.14 | 6d | 1 | 0.96mi |
| 10510 Ocotillo Rd Desert Hot Springs, CA | 3.0 | 2.5 | 1400 | $3,000 | $2.14 | 45d | 1 | 0.96mi |
| 66300 6th St Desert Hot Springs, CA | 3.0 | 2.0 | 1364 | $2,550 | $1.87 | 26d | 1 | 1.13mi |
| 65841 6th St Desert Hot Springs, CA | 2.0 | 2.0 | 1204 | $2,250 | $1.87 | 45d | 1 | 1.14mi |
| 66023 4th St Desert Hot Springs, CA | 4.0 | 2.0 | 1743 | $2,600 | $1.49 | 45d | 1 | 1.25mi |
| 66212 2nd St Desert Hot Springs, CA | 2.0 | 1.0 | 960 | $2,000 | $2.08 | 45d | 1 | 1.36mi |
| 66700 Crescent Dr Unit A Desert Hot Springs, CA | 3.0 | 2.0 | 1400 | $2,195 | $1.57 | 16d | 1 | 1.36mi |
| 11693 Mountain Hawk Ln Desert Hot Springs, CA | 4.0 | 3.0 | 1666 | $2,500 | $1.50 | 45d | 1 | 1.38mi |
| 66815 Vista Pl Desert Hot Springs, CA | 4.0 | 2.0 | 1759 | $2,600 | $1.48 | 3d | 1 | 1.49mi |
Listing history 10 events
-
2026-06-21days on market $305,000 Active 14 DOM
-
2026-06-18days on market $305,000 Active 11 DOM
-
2026-06-17days on market $305,000 Active 10 DOM
-
2026-06-16days on market $305,000 Active 9 DOM
-
2026-06-15days on market $305,000 Active 8 DOM
-
2026-06-13days on market $305,000 Active 6 DOM
-
2026-06-13days on market $305,000 Active 5 DOM
-
2026-06-09days on market $305,000 Active 2 DOM
-
2026-06-08remarks 408-char remark
-
2026-06-08$305,000 Active 1 DOM
ⓘ Source: listings_history table (triggers on properties + properties_extension) + one-shot
backfill from property_details.listing_events for pre-trigger history.
Tax reassessment forecast CA · Resets to sale price
- Current annual tax
- $3,363 · $280/mo
- Projected year-2 tax
- $3,363 · $280/mo
- Expected delta
- $0/yr ($0/mo · 0.0%)
ⓘ Screening estimate from a state-policy table — verify with the county assessor before closing.
Climate risk First Street
- Flood 1/10 Low FEMA zone X (unshaded) · 0% chance over 30 yrs
- Wildfire 6/10 Major
- Heat 8/10 Severe 8 d/yr ≥109°F today · 23 d/yr by 30 yrs out
- Wind 1/10 Low
- Air quality 5/10 Major 7 unhealthy d/yr today · 10 by 30 yrs out
Nearby sold comps map
Loading sold comps map…
Walkable amenities ~0.75 mi
Loading nearby amenities…
Taxation est. · year 1
- Rental income
- $31,160
- − Mortgage interest
- −$17,085
- − Property taxes
- −$3,363
- − Insurance
- −$1,525
- − Repairs & maintenance
- −$2,493
- − Management
- −$2,493
- − Depreciation
- −$8,873
- Taxable loss
- −$4,671
- Est. tax savings @ 24.0%
- +$1,121
- After-tax cash flow
- $1,656/yr
For passive investors: Depreciation is non-cash, so a rental often shows a tax loss while cash-flowing — sheltering income. Rental losses are passive: they offset passive income freely, and up to $25,000/yr can offset ordinary (W-2) income if you actively participate and your MAGI is under $100k (phasing out to $0 by $150k); unused losses carry forward. On sale, claimed depreciation is recaptured at up to 25%, and gains may owe capital-gains tax (a 1031 exchange can defer both). Figures are a year-1 estimate at your 24.0% rate — not tax advice; consult a CPA.
Schools (NCES district)
- District
- Palm Springs Unified
- NCES district ID
- 0629550
- Math proficiency
- 21% ▼ -7.00%
- Reading proficiency
- 42% ▬ 0.00%
- Median HH income
- $43,638
- Composite
- 26.76/100
- National rank
- #7131
- State rank
- #328 of 517 in CA
Livability — Desert Hot Springs
- Score
- 49/100
- State rank
- #1149
- US rank
- #25774
Category grades
Schools grade is shown separately in the Schools card above.
Census & demographics
- Census place
- Desert Hot Springs, CA
- County
- Riverside County · 2,287,001 people
- City population
- 41,615
- Metro
- Riverside-San Bernardino-Ontario, CA
- Population (ZIP)
- 41,615
- Household income
- $54,023
- Rent vs Own
- Severe rent burden
- 2095.0
Population outlook (Riverside County) Hauer SSP2
- Today (2025)
- 2,664,475 people
- By 2030
- 2,802,692 · +5.2%
- By 2040
- 3,050,904 · +14.5%
- By 2050
- 3,256,783 · +22.2%
- By 2075
- 3,655,058 · +37.2%
- By 2100
- 3,766,594 · +41.4%
Race, ethnicity, and origin ACS 2023
- Neighborhood character
- Majority Hispanic (64%)
- Race & ethnicity
- Hispanic / Latino 64% Two or more races 27% White 23% Black 7% Native American 2% Asian 2%
- Hispanic origin (detail)
- Mexican 53%
- Common ancestry
- Lithuanian 1% Romanian 1% Italian 1%
- Foreign-born
- 27% · Canada, Vietnam
- Languages at home
- 47% English-only · Spanish 50% Russian/Polish/Slavic 1%
Political lean MEDSL · Riverside
- 2024 margin
- Toss-up / Even · D 48.0% · R 49.3% · Other 2.6%
- 2008→2024 swing
- -3.6pp toward R · 2008: 2.3pp · 2024: -1.3pp
- All cycles
- 2024: R+1.3 2020: D+8.0 2016: D+4.3 2012: R+0.4 2008: D+2.3
Not yet ingested
- Civics
- —
Market trends
- HPI YoY
- ▼ -102.10%
- Current HPI
- 418.4691
- Rent YoY
- ▲ 3.66%
- Metro
- Riverside-San Bernardino-Ontario, CA
- State GDP YoY
- ▲ 3.21%
- F500 in state
- 116
Industry mix (Fortune 500 HQ in CA)
| Industry | F500 HQs | Revenue |
|---|---|---|
| Technology | 27 | $1,492B |
|
||
| Financial Services | 3 | $174B |
|
||
| Retail | 3 | $44B |
|
||
| Insurance | 3 | $26B |
|
||
| Media / Entertainment | 2 | $115B |
|
||
| Pharmaceuticals / Biotech | 2 | $62B |
|
||
Price history
+1170.8% since first listed4 events — show timeline
- 2026-06-07 Listed $305,000 GPSMLS
- 2003-09-05 Sold (Public Records) $120,000 Public Records
- 2000-07-13 Sold (Public Records) $85,000 Public Records
- 1980-08-01 Sold (Public Records) $24,000 Public Records
Property tax history
+3.5%/yrLatest (2025): $3,363 · -0.8% YoY. Source: county tax records.
Cash-flow waterfall
monthlySold comps — $/sqft
last 12 mo · ≤1 miLoading sold comps…