 🏷️ Likely Rental
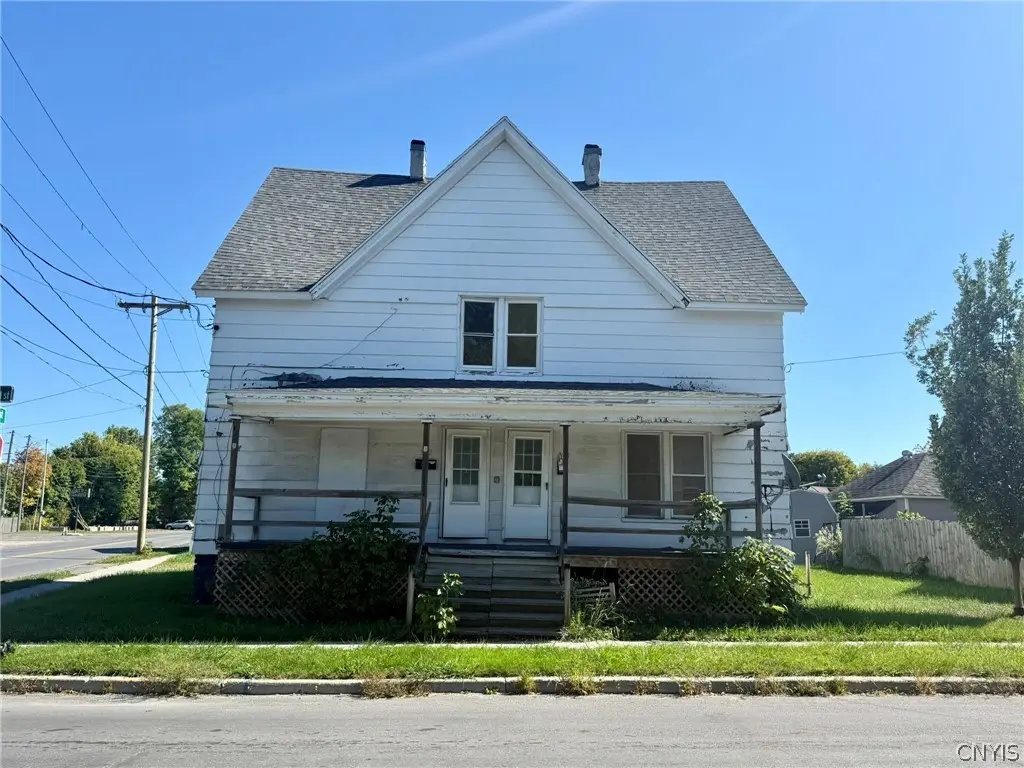
340-342 N Rutland St · Watertown, NY
Flood risk 1/10 · Minimal
- FEMA flood zone
- X
- Chance of flooding over 30 yrs
- 0.0%
- Est. flood insurance / yr
- $473 – $860
Fire risk 1/10 · Minimal
- Est. fire insurance / yr
- $691 – $1,283
Heat risk 2/10 · Minimal
- Hot days now (above 91°F)
- 7 days/yr
- Hot days in 30 yrs
- 16 days/yr
Wind risk 1/10 · Minimal
- Chance of severe wind over 30 yrs
- 0.0%
Air-quality risk 2/10 · Minimal
- Unhealthy air days now
- 1 days/yr
- Unhealthy air days in 30 yrs
- 1 days/yr
Risk factors via First Street. Map © Google.
Why this score? — see what drove the B+ grade
The composite is a weighted blend of 9 inputs, each scored 0–100. Each bar is that input's sub-score; the figure is the points it added to the 100-point composite (weight × sub-score).
- Cash flow +30.0/30.0
- ARV discount +15.0/15.0
- 1% rule +10.0/10.0
- DSCR +10.0/10.0
- Rent growth +5.0/5.0
- Schools +3.7/10.0
- Livability +3.4/5.0
- Condition / age +2.5/5.0
- Appreciation +0.0/10.0
$109,900
🖨 Deal sheet 📄 Offer letter ✓ Due diligence
Listing remarks
Conveniently located duplex situated on a corner city lot. This two-family home is full of opportunity for investors or owner-occupants. Each unit features a large living room, dining room and kitchen on the first floor (unit 340 has laundry hookups in the kitchen) and two bedrooms and one full bath upstairs for both units. Situated just minutes from Fort Drum and neighborhood amenities, the property sits in a prime area for steady tenant demand. With separate utilities, off street parking and a desirable location, this could be a great opportunity! Bring your ideas and see the potential this home has to offer. Schedule your private showing today!
Key facts
- Kitchen
- Corner city lot
- Large living room
Tags
Property features AI
Finance
- Other: Owner pays: other (see remarks); Rent includes: see remarks
- Financial info: Two-unit property with separate gas and electric meters for each unit; Operating expense details: see remarks
Exterior
- Parking: Two or more parking spaces
- Utilities: Public water connected; Sewer connected; Electricity available; Cable available; High-speed internet available
- Home design: Two-story multi-family property; Existing construction; City street frontage
- Construction: Wood siding; Asphalt and metal roof; Stone foundation; Built as existing (year built details: existing)
- Exterior features: Corner lot; Near public transit; Rectangular residential lot; Porch
Interior
- Kitchen: Oven/Range; Refrigerator
- Bedrooms: Two 2-bedroom units
- Flooring: Laminate; Varies
- Bathrooms: Two full bathrooms (one in each unit)
- Heating & cooling: Gas forced air heating
- Interior features: Enclosed porch; Covered porch
- Laundry & utility: Gas water heater
Neighborhood map
What this means for you Summary
Snapshot
- This is a 4-bed/2.0-bath townhouse listed at $110k.
Deal economics
- At list price, monthly cash flow is $676 ($8k/yr) — positive.
- The deal already cash-flows at list — no discount required.
- Meets the 1% rule at list price ($2k rent vs $110k).
- Recommended offer: $107k (3.0% below list) — sets the bar for market timing.
- Cap rate 13.7% vs local median 6.2% in Watertown — top-decile yield for the area; either an underpriced asset or a hidden risk that comps aren't pricing in. Stress-test before assuming the spread holds.
Location & tenants
- Location reads 68/100 on livability (#540 in NY) — a middle-class / working-renter tenant base. Strengths: health & safety A+, cost of living A-, housing A-; Watch: amenities C-, schools D, crime F.
- Watertown City School District (urban): math 34% / reading 54% proficiency, ranked #481 of 590 in NY (top 82%) — families likely to look elsewhere, expect single-tenant / working-renter base with shorter leases.
- Market conditions: Rents rising fast (+10.0%/yr); 223 active listings in the ZIP; 8 comparable units currently listed for rent nearby; rentals lingering (median 44d on market — plan ~5-8 weeks vacancy on turnover, expect pricing pressure); 100% of comp listings sitting > 30 days — soft ceiling on asking rent; 196 units permitted in Jefferson County in 2024 (0 in 5+ unit buildings).
- This rent runs 36% of the median local income ($59k/yr) — at the standard rent-burdened threshold; future hikes will face affordability resistance.
Forward outlook
- Local home prices are declining (-3.0%/yr); year-one equity from $760 of loan paydown is wiped out by about $3k of value loss. Plan a longer hold.
- Jefferson County population projected at -12% by 2050 — secular population decline; favor cash flow + early exit over multi-decade hold.
- At projected returns (-3.0% appreciation + 8.0% rent growth), your $31k cash investment doubles in ~4 years — after that, you're playing with house money.
Negotiation context
- It's been on market 39 days — a 3% lower offer ($107k) is reasonable based on typical stale-listing flexibility.
- 8 sale attempts since 17y ago; this cycle's ask has dropped $15k (12%) from the opening price — seller is motivated, your offer sets the floor, not the list.
- Current owner paid $67k; list at $110k implies a 64% gain — meaningful room to come down on a strong offer.
Risks & watch-outs
- Watch-outs: built in 1900 — expect roof / HVAC / electrical / plumbing capex.
Questions for the listing agent
- It's been on market 39 days. Have you received any prior offers? Is the seller open to a 3% concession, seller financing, or rate buy-down credit?
- Built in 1900 — when were the roof, HVAC, electrical panel, plumbing, and water heater last replaced?
- Is there a deadline driving the sale (1031 exchange, divorce, estate, relocation)? That informs how much negotiation room exists.
- Schools are D-rated, which usually means shorter tenancies and higher turnover. Who's the typical renter profile here, and what's been the actual vacancy rate?
- Crime grade is F in this area — have there been break-ins, vandalism, or insurance claims at this property in the last 3 years? What carrier currently insures it and at what premium?
- What's the average days-on-market for RENTAL listings here right now (not sales)? A rising rental-DOM trend means longer vacancies and softer asking-rent achievability than the comps imply.
- What's the recent tenant-quality profile in this submarket — average credit score on applications, eviction rate, late-payment / NSF rate, and stable-employment percentage? A property-management company in the area should have these aggregated.
- How much new for-sale + rental construction is in the pipeline within 1–3 miles? Heavy new supply typically softens prices + rents 12–24 months out; constrained supply supports both.
Investment metrics
- 1% rule
- 1.62% ✓
- Cap rate
- 13.68%
- Cash-on-cash
- 26.37%
- DSCR
- 2.17
- GRM
- 5.1
CMA / ARV
- ARV (median comp)
- $180,382
- List price
- $109,900
- Delta
- -39.07%
- Verdict
- UNDERPRICED
- Comps
- 12 within 1.0 mi
Show comp detail 4 sales within ~0.75 mi
| Address | Dist | Beds/Ba | Sqft | Sold | Price | $/sf | Match |
|---|---|---|---|---|---|---|---|
| 1200 Bronson St | 0.39mi | 5/2.0 (+1) | 2,352 (+2%) | 6mo | $102,000 | $43 | 69 |
| 134 Michigan Ave | 0.55mi | 4/2.0 | 2,118 (-8%) | 0mo | $199,000 | $94 | 60 |
| 132 Central St | 0.28mi | 5/2.0 (+1) | 2,457 (+6%) | 22mo | $65,000 | $26 | 53 |
| 127 N Pleasant St | 0.36mi | 4/3.0 | 2,014 (-13%) | 21mo | $117,500 | $58 | 40 |
Match score weights: distance 35% · size 25% · config 20% · recency 20%. Top-matched comps best support the ARV.
Projected returns pro-forma
-3.0% appreciation · 8.0% rent growth · sell at horizon
- IRR
- 25.6%
- Equity multiple
- 2.13×
- Total profit
- $34,665
- Equity at exit
- $16,386
- IRR
- 36.2%
- Equity multiple
- 5.17×
- Total profit
- $128,467
- Equity at exit
- $9,502
Cash invested: $30,772 (down + closing). Projections, not guarantees.
Landlord ↔ Tenant lean methodology
- Overall (STATE)
- 15 Strongly Tenant-Friendly
- State New York
- 15 Strongly Tenant-Friendly · D+10
- County
- — inherits STATE
- City
- — inherits STATE
ZIP-level market 13601
- Home prices YoY
- -5.6%
- Rents YoY
- 10.0%
- Active inventory
- 223
- Price-to-rent
- 5.1×
Monthly cashflow live
- Estimated rent
- $1,779 high interval (Pro) →
- Mortgage (P&I)
- −$576
- Tax from tax record
- −$107 /mo · $1,289/yr
- Insurance
- −$46
- HOA
- −$0
- Vacancy / Maint / Mgmt
- −$374
- Net cashflow
- $676
Break-even live
UW: 25.0% down · 7.5% · 30yr · 1.5% tax · 5.0% vac · 8.0% maint · 8.0% mgmt
Financing live
Cash to close
- Down payment
- $27,475
- Closing costs
- $3,297
- Reserves months
- —
- Total cash needed
- —
Loan-product check · same deal, 3 products live
Conventional
25% down · 7.5% · 30yr
- Down + closing
- —
- Monthly P&I
- —
- Monthly cashflow
- —
- DSCR
- —
- Eligible?
- —
Personal DTI + credit; lowest rate.
DSCR
20% down · 8.5% · 30yr
- Down + closing
- —
- Monthly P&I
- —
- Monthly cashflow
- —
- DSCR
- —
- Eligible?
- —
No personal income docs; deal must DSCR.
Hard money
10% down · 12.0% · 12mo
- Down + closing
- —
- Monthly P&I
- —
- Monthly cashflow
- —
- DSCR
- —
- Eligible?
- —
Short-term bridge; refi at stabilization.
Rent comps 8 comps
| Address | Beds | Baths | Sqft | Rent | $/sqft | DOM | Units | Dist |
|---|---|---|---|---|---|---|---|---|
| 621 Academy St Watertown, NY | 3.0 | 2.0 | 1652 | $1,600 | $0.97 | 44d | 1 | 0.47mi |
| 256 Michigan Ave Watertown, NY | 2.0–4.0 | 1.0–2.5 | 1435 | $1,626 | $1.13 | 44d | 9 | 0.55mi |
| 417 Franklin St Watertown, NY | 3.0 | 2.5 | 3000 | $1,750 | $0.58 | 44d | 1 | 0.57mi |
| 377 W Main St Unit 1 Watertown, NY | 3.0 | 1.0 | 1991 | $1,350 | $0.68 | 44d | 1 | 0.90mi |
| 702 Leray St Watertown, NY | 3.0 | 1.0 | 2700 | $1,300 | $0.48 | 44d | 1 | 0.98mi |
| 128 Park Ave Watertown, NY | 3.0 | 2.0 | 2300 | $2,400 | $1.04 | 44d | 1 | 1.05mi |
| 156 N Meadow St Watertown, NY | 4.0 | 1.0 | 2535 | $1,500 | $0.59 | 44d | 1 | 1.16mi |
| 1815 Olmstead Dr Watertown, NY | 2.0–4.0 | 1.0–2.0 | 1380 | $1,676 | $1.21 | 44d | 6 | 1.22mi |
Listing history 35 events
-
2026-06-19days on market $109,900 Active 39 DOM
-
2026-06-18days on market $109,900 Active 38 DOM
-
2026-06-17days on market $109,900 Active 37 DOM
-
2026-06-16days on market $109,900 Active 36 DOM
-
2026-06-15days on market $109,900 Active 35 DOM
-
2026-06-14days on market $109,900 Active 33 DOM
-
2026-06-12pricedays on market $109,900 Active 32 DOM
-
2026-06-09days on market $125,000 Active 29 DOM
-
2026-06-08days on market $125,000 Active 28 DOM
-
2026-06-07days on market $125,000 Active 27 DOM
-
2026-06-05days on market $125,000 Active 24 DOM
-
2026-06-03days on market $125,000 Active 23 DOM
-
2026-06-02days on market $125,000 Active 22 DOM
-
2026-06-01days on market $125,000 Active 21 DOM
-
2026-05-31days on market $125,000 Active 20 DOM
-
2026-05-30days on market $125,000 Active 19 DOM
-
2026-05-11$125,000 Active 655-char remark
-
2025-11-08historical
-
2025-10-07$125,000 Active
-
2024-10-31historical
-
2024-10-07status Active
-
2024-09-30historical
-
2024-06-17price $99,900
-
2024-06-08price $109,000
-
2024-05-27$114,000 Active
-
2021-09-13historical
-
2021-03-14$107,700 Active
-
2014-02-07soldstatus $67,100
-
2014-02-06soldstatus $67,000
-
2013-12-30$74,800
-
2013-12-01historical
-
2013-06-01$79,000
-
2010-07-28soldstatus $59,100
-
2010-07-27soldstatus $59,000
-
2009-05-11$69,900
ⓘ Source: listings_history table (triggers on properties + properties_extension) + one-shot
backfill from property_details.listing_events for pre-trigger history.
Tax reassessment forecast NY · Partial reset (capped growth)
- Current annual tax
- $1,289 · $107/mo
- Projected year-2 tax
- $1,573 · $131/mo
- Expected delta
- +$284/yr (+$24/mo · 22.0%)
ⓘ Screening estimate from a state-policy table — verify with the county assessor before closing.
Climate risk First Street
- Flood 1/10 Low FEMA zone X · 0% chance over 30 yrs
- Wildfire 1/10 Low
- Heat 2/10 Low 7 d/yr ≥91°F today · 16 d/yr by 30 yrs out
- Wind 1/10 Low 0% chance of damaging wind over 30 yrs
- Air quality 2/10 Low 1 unhealthy d/yr today · 1 by 30 yrs out
Nearby sold comps map
Loading sold comps map…
Walkable amenities ~0.75 mi
Loading nearby amenities…
Taxation est. · year 1
- Rental income
- $21,352
- − Mortgage interest
- −$6,156
- − Property taxes
- −$1,289
- − Insurance
- −$550
- − Repairs & maintenance
- −$1,708
- − Management
- −$1,708
- − Depreciation
- −$3,197
- Taxable income
- $6,744
- Est. tax owed @ 24.0%
- −$1,618
- After-tax cash flow
- $6,495/yr
For passive investors: Depreciation is non-cash, so a rental often shows a tax loss while cash-flowing — sheltering income. Rental losses are passive: they offset passive income freely, and up to $25,000/yr can offset ordinary (W-2) income if you actively participate and your MAGI is under $100k (phasing out to $0 by $150k); unused losses carry forward. On sale, claimed depreciation is recaptured at up to 25%, and gains may owe capital-gains tax (a 1031 exchange can defer both). Figures are a year-1 estimate at your 24.0% rate — not tax advice; consult a CPA.
Schools (NCES district)
- District
- Watertown City School District
- NCES district ID
- 3630120
- Math proficiency
- 34% ▼ -10.00%
- Reading proficiency
- 54% ▲ 12.00%
- Median HH income
- $40,919
- Composite
- 36.86/100
- National rank
- #4551
- State rank
- #481 of 590 in NY
Livability — Watertown
- Score
- 68/100
- State rank
- #540
- US rank
- #9700
Category grades
Schools grade is shown separately in the Schools card above.
Census & demographics
- Census place
- Watertown, NY
- County
- Jefferson County · 47,417 people
- City population
- 36,839
- Metro
- Watertown-Fort Drum, NY
- Population (ZIP)
- 36,839
- Household income
- $58,791
- Rent vs Own
- Severe rent burden
- 1634.0
Population outlook (Jefferson County) Hauer SSP2
- Today (2025)
- 111,748 people
- By 2030
- 109,370 · -2.1%
- By 2040
- 103,828 · -7.1%
- By 2050
- 98,523 · -11.8%
- By 2075
- 91,422 · -18.2%
- By 2100
- 78,214 · -30.0%
Race, ethnicity, and origin ACS 2023
- Neighborhood character
- Predominantly White (82%)
- Race & ethnicity
- White 82% Two or more races 7% Hispanic / Latino 6% Black 4% Asian 2%
- Hispanic origin (detail)
- Mexican 2% Puerto Rican 2%
- Common ancestry
- Lithuanian 7% Romanian 3% Slovak 2%
- Foreign-born
- 4% · Canada
- Languages at home
- 94% English-only · Spanish 3% Other Indo-European 1% German/W. Germanic 1%
Political lean MEDSL · Jefferson
- 2024 margin
- Strong R (+23.6) · D 38.2% · R 61.8%
- 2008→2024 swing
- -18.3pp toward R · 2008: -5.3pp · 2024: -23.6pp
- All cycles
- 2024: R+23.6 2020: R+19.0 2016: R+22.4 2012: R+2.9 2008: R+5.3
Not yet ingested
- Civics
- —
Market trends
- HPI YoY
- ▼ -18.86%
- Current HPI
- 316.636
- Rent YoY
- ▲ 9.96%
- Metro
- Watertown-Fort Drum, NY
- State GDP YoY
- ▲ 2.60%
- F500 in state
- 92
Industry mix (Fortune 500 HQ in NY)
| Industry | F500 HQs | Revenue |
|---|---|---|
| Financial Services | 10 | $950B |
|
||
| Consumer Goods | 9 | $162B |
|
||
| Insurance | 4 | $225B |
|
||
| Telecommunications | 2 | $144B |
|
||
| Pharmaceuticals | 2 | $112B |
|
||
| Media / Entertainment | 2 | $69B |
|
||
Price history
+57.2% since first listed20 events — show timeline
- 2026-06-09 Price Changed $109,900 CNYIS
- 2026-05-11 Listed $125,000 CNYIS
- 2025-11-08 Listing Removed — CNYIS
- 2025-10-07 Listed $125,000 CNYIS
- 2024-10-31 Listing Removed — CNYIS
- 2024-10-07 Relisted — CNYIS
- 2024-09-30 Listing Removed — CNYIS
- 2024-06-17 Price Changed $99,900 CNYIS
- 2024-06-08 Price Changed $109,000 CNYIS
- 2024-05-27 Listed $114,000 CNYIS
- 2021-09-13 Listing Removed — CNYIS
- 2021-03-14 Listed $107,700 CNYIS
- 2014-02-07 Sold (Public Records) $67,100 Public Records
- 2014-02-06 Sold (MLS) $67,000 CNYIS
- 2013-12-30 Listed $74,800 CNYIS
- 2013-12-01 Listing Removed — CNYIS
- 2013-06-01 Listed $79,000 CNYIS
- 2010-07-28 Sold (Public Records) $59,100 Public Records
- 2010-07-27 Sold (MLS) $59,000 CNYIS
- 2009-05-11 Listed $69,900 CNYIS
Property tax history
+18.7%/yrLatest (2025): $1,289 · +3.9% YoY. Source: county tax records.
Cash-flow waterfall
monthlySold comps — $/sqft
last 12 mo · ≤1 miLoading sold comps…