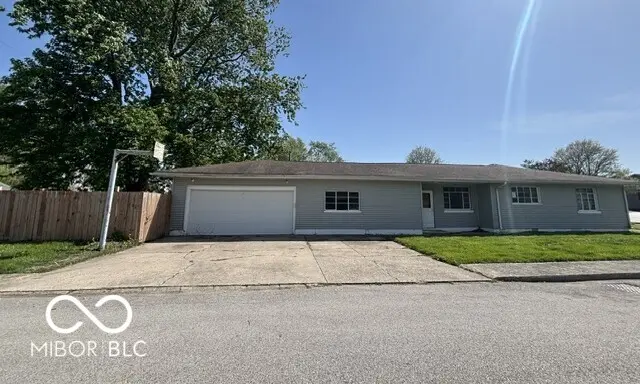
213 N Posey St · Windfall City, IN
Flood risk 1/10 · Minimal
- FEMA flood zone
- X (unshaded)
- Chance of flooding over 30 yrs
- 0.0%
- Est. flood insurance / yr
- $507 – $1,088
Fire risk 1/10 · Minimal
- Est. fire insurance / yr
- $717 – $1,331
Heat risk 3/10 · Minor
- Hot days now (above 100°F)
- 7 days/yr
- Hot days in 30 yrs
- 18 days/yr
Wind risk 2/10 · Minimal
- Chance of severe wind over 30 yrs
- 0.0%
Air-quality risk 3/10 · Minor
- Unhealthy air days now
- 2 days/yr
- Unhealthy air days in 30 yrs
- 3 days/yr
Risk factors via First Street. Map © Google.
Why this score? — see what drove the B grade
The composite is a weighted blend of 9 inputs, each scored 0–100. Each bar is that input's sub-score; the figure is the points it added to the 100-point composite (weight × sub-score).
- Cash flow +24.5/30.0
- ARV discount +15.0/15.0
- Appreciation +8.4/10.0
- DSCR +7.9/10.0
- 1% rule +5.5/10.0
- Schools +3.0/10.0
- Livability +2.9/5.0
- Rent growth +2.5/5.0
- Condition / age +2.5/5.0
$116,000
🖨 Deal sheet 📄 Offer letter ✓ Due diligence
Listing remarks MLS
Adorable 3 bed, 2 bath home on a large corner lot. Both baths have been updated, all new carpet throughout and new laminate flooring in family room.
Key facts
- Functional peninsula
- Comfortable patio
- Private yard
Tags
Property features AI
Exterior
- Parking: Attached 2-car garage (garage approx. 528 sq ft)
- Utilities: Public water; Municipal sewer; No solid waste service listed
- Home design: Single-family residence; One story
- Construction: Vinyl siding; Crawl space foundation
- Exterior features: Covered patio and porch; Patio; Porch; Privacy fence; Property sits on a corner lot with sidewalks and mature trees
Interior
- Kitchen: Eat-in kitchen; Breakfast bar
- Bedrooms: 3 bedrooms (all on main level); Bedroom dimensions include 12x12, 12x11, and 12x9
- Flooring: Hardwood floors
- Bathrooms: 2 full bathrooms; Primary bath with double sinks, full shower stall, and whirlpool tub
- Heating & cooling: Forced air heating (natural gas); Central air conditioning
- Interior features: Attic access; Breakfast bar; Hardwood floors; Eat-in kitchen; Stained/painted woodwork; Walk-in closets; Smoke alarm
- Laundry & utility: Main level laundry; Utility room
Neighborhood map
What this means for you Summary
Snapshot
- This is a 3-bed/2.0-bath single-family listed at $116k.
Deal economics
- At list price, monthly cash flow is $238 ($3k/yr) — positive.
- The deal already cash-flows at list — no discount required.
- Meets the 1% rule at list price ($1k rent vs $116k).
- Recommended offer: $113k (3.0% below list) — sets the bar for market timing.
Location & tenants
- Location reads 57/100 on livability (#609 in IN) — a working-class tenant base; expect higher turnover. Strengths: cost of living A+, housing A-; Watch: employment D+, crime D, schools F.
- Tri-Central Community Schools (rural): math 28% / reading 39% proficiency, ranked #196 of 301 in IN (top 65%) — families likely to look elsewhere, expect single-tenant / working-renter base with shorter leases.
- Market conditions: 12 active listings in the ZIP; 32 units permitted in Tipton County in 2024 (0 in 5+ unit buildings).
Forward outlook
- In year one you build about $9k of equity ($802 loan paydown + $8k appreciation (6.9% local appreciation)).
- Tipton County population projected at -23% by 2050 — secular population decline; favor cash flow + early exit over multi-decade hold.
- At projected returns (6.9% appreciation + 3.0% rent growth), your $32k cash investment doubles in ~3 years — after that, you're playing with house money.
- By year 4, paydown + projected appreciation supports a ~$30k cash-out refi (75% LTV) — recoverable capital for the next deal without selling this one.
Negotiation context
- It's been on market 44 days — a 3% lower offer ($113k) is reasonable based on typical stale-listing flexibility.
- 3 sale attempts since 14y ago with the ask held roughly flat each time — persistent listings suggest the price (not the market) is what's stuck; bring a comps-based counter.
Risks & watch-outs
- Watch-outs: built in 1947 — expect roof / HVAC / electrical / plumbing capex.
Questions for the listing agent
- It's been on market 44 days. Have you received any prior offers? Is the seller open to a 3% concession, seller financing, or rate buy-down credit?
- Built in 1947 — when were the roof, HVAC, electrical panel, plumbing, and water heater last replaced?
- Is there a deadline driving the sale (1031 exchange, divorce, estate, relocation)? That informs how much negotiation room exists.
- Schools are F-rated, which usually means shorter tenancies and higher turnover. Who's the typical renter profile here, and what's been the actual vacancy rate?
- Crime grade is D in this area — have there been break-ins, vandalism, or insurance claims at this property in the last 3 years? What carrier currently insures it and at what premium?
- What's the average days-on-market for RENTAL listings here right now (not sales)? A rising rental-DOM trend means longer vacancies and softer asking-rent achievability than the comps imply.
- What's the recent tenant-quality profile in this submarket — average credit score on applications, eviction rate, late-payment / NSF rate, and stable-employment percentage? A property-management company in the area should have these aggregated.
- How much new for-sale + rental construction is in the pipeline within 1–3 miles? Heavy new supply typically softens prices + rents 12–24 months out; constrained supply supports both.
Investment metrics
- 1% rule
- 1.05% ✓
- Cap rate
- 8.76%
- Cash-on-cash
- 8.80%
- DSCR
- 1.39
- GRM
- 7.9
CMA / ARV
- ARV (median comp)
- $161,758
- List price
- $116,000
- Delta
- -28.29%
- Verdict
- UNDERPRICED
- Comps
- 13 within 1.0 mi
Show comp detail 3 sales within ~0.75 mi
| Address | Dist | Beds/Ba | Sqft | Sold | Price | $/sf | Match |
|---|---|---|---|---|---|---|---|
| 115 N Posey St | 0.06mi | 3/1.0 | 1,663 (-2%) | 10mo | $160,000 | $96 | 81 |
| 400 W Sherman St | 0.24mi | 4/2.5 (+1) | 1,902 (+12%) | 12mo | $241,000 | $127 | 52 |
| 206 Davis St | 0.64mi | 3/1.0 | 1,794 (+6%) | 10mo | $117,000 | $65 | 49 |
Match score weights: distance 35% · size 25% · config 20% · recency 20%. Top-matched comps best support the ARV.
Projected returns pro-forma
6.9% appreciation · 3.0% rent growth · sell at horizon
- IRR
- 24.5%
- Equity multiple
- 2.69×
- Total profit
- $54,916
- Equity at exit
- $79,599
- IRR
- 22.7%
- Equity multiple
- 5.57×
- Total profit
- $148,287
- Equity at exit
- $150,495
Cash invested: $32,480 (down + closing). Projections, not guarantees.
Landlord ↔ Tenant lean methodology
- Overall (STATE)
- 90 Strongly Landlord-Friendly
- State Indiana
- 90 Strongly Landlord-Friendly · R+11
- County
- — inherits STATE
- City
- — inherits STATE
ZIP-level market 46076
- Home prices YoY
- 2.4%
- Active inventory
- 12
- Price-to-rent
- 7.9×
Monthly cashflow live
- Estimated rent
- $1,219 medium interval (Pro) →
- Mortgage (P&I)
- −$608
- Tax from tax record
- −$68 /mo · $819/yr
- Insurance
- −$48
- HOA
- −$0
- Vacancy / Maint / Mgmt
- −$256
- Net cashflow
- $238
Break-even live
UW: 25.0% down · 7.5% · 30yr · 1.5% tax · 5.0% vac · 8.0% maint · 8.0% mgmt
Financing live
Cash to close
- Down payment
- $29,000
- Closing costs
- $3,480
- Reserves months
- —
- Total cash needed
- —
Loan-product check · same deal, 3 products live
Conventional
25% down · 7.5% · 30yr
- Down + closing
- —
- Monthly P&I
- —
- Monthly cashflow
- —
- DSCR
- —
- Eligible?
- —
Personal DTI + credit; lowest rate.
DSCR
20% down · 8.5% · 30yr
- Down + closing
- —
- Monthly P&I
- —
- Monthly cashflow
- —
- DSCR
- —
- Eligible?
- —
No personal income docs; deal must DSCR.
Hard money
10% down · 12.0% · 12mo
- Down + closing
- —
- Monthly P&I
- —
- Monthly cashflow
- —
- DSCR
- —
- Eligible?
- —
Short-term bridge; refi at stabilization.
Listing history 19 events
-
2026-06-13statusdays on market $116,000 Pending 44 DOM
-
2026-06-10days on market $116,000 Active 42 DOM
-
2026-06-09days on market $116,000 Active 41 DOM
-
2026-06-08days on market $116,000 Active 40 DOM
-
2026-06-07days on market $116,000 Active 39 DOM
-
2026-06-05days on market $116,000 Active 36 DOM
-
2026-06-03days on market $116,000 Active 35 DOM
-
2026-06-02days on market $116,000 Active 34 DOM
-
2026-06-01days on market $116,000 Active 33 DOM
-
2026-05-31days on market $116,000 Active 32 DOM
-
2026-05-30days on market $116,000 Active 31 DOM
-
2026-04-29$116,000 Active 510-char remark
-
2022-06-10soldstatus $127,500 148-char remark
Show marketing remark (148 chars)
Adorable 3 bed, 2 bath home on a large corner lot. Both baths have been updated, all new carpet throughout and new laminate flooring in family room.
-
2022-06-10soldstatus $127,500
Show marketing remark (148 chars)
Adorable 3 bed, 2 bath home on a large corner lot. Both baths have been updated, all new carpet throughout and new laminate flooring in family room.
-
2022-05-06$119,900 148-char remark
Show marketing remark (148 chars)
Adorable 3 bed, 2 bath home on a large corner lot. Both baths have been updated, all new carpet throughout and new laminate flooring in family room.
-
2013-05-13soldstatus $70,000
-
2013-05-10historical
Show marketing remark (454 chars)
Amazing home 1700sq/ ft. Three bedrooms and two baths. Home sets on a corner lot in downtown Windfall. New siding, new furnace, and a new roof within the last year. All kitchen appliances are included. Hardwood flooring under carpet. Basketball goal is ready for the new owners. Check out the Low property taxes and this is without a homestead and mortgage exemption filed. New bathrooms with ceramic tile and a large jetted tub. Immediate occupancy.
-
2013-05-09soldstatus $70,000
Show marketing remark (454 chars)
Amazing home 1700sq/ ft. Three bedrooms and two baths. Home sets on a corner lot in downtown Windfall. New siding, new furnace, and a new roof within the last year. All kitchen appliances are included. Hardwood flooring under carpet. Basketball goal is ready for the new owners. Check out the Low property taxes and this is without a homestead and mortgage exemption filed. New bathrooms with ceramic tile and a large jetted tub. Immediate occupancy.
-
2012-11-07$74,900
Show marketing remark (454 chars)
Amazing home 1700sq/ ft. Three bedrooms and two baths. Home sets on a corner lot in downtown Windfall. New siding, new furnace, and a new roof within the last year. All kitchen appliances are included. Hardwood flooring under carpet. Basketball goal is ready for the new owners. Check out the Low property taxes and this is without a homestead and mortgage exemption filed. New bathrooms with ceramic tile and a large jetted tub. Immediate occupancy.
ⓘ Source: listings_history table (triggers on properties + properties_extension) + one-shot
backfill from property_details.listing_events for pre-trigger history.
Tax reassessment forecast IN · Partial reset (capped growth)
- Current annual tax
- $819 · $68/mo
- Projected year-2 tax
- $902 · $75/mo
- Expected delta
- +$84/yr (+$7/mo · 10.2%)
ⓘ Screening estimate from a state-policy table — verify with the county assessor before closing.
Climate risk First Street
- Flood 1/10 Low FEMA zone X (unshaded) · 0% chance over 30 yrs
- Wildfire 1/10 Low
- Heat 3/10 Moderate 7 d/yr ≥100°F today · 18 d/yr by 30 yrs out
- Wind 2/10 Low 0% chance of damaging wind over 30 yrs
- Air quality 3/10 Moderate 2 unhealthy d/yr today · 3 by 30 yrs out
Nearby sold comps map
Loading sold comps map…
Walkable amenities ~0.75 mi
Loading nearby amenities…
Taxation est. · year 1
- Rental income
- $14,631
- − Mortgage interest
- −$6,498
- − Property taxes
- −$819
- − Insurance
- −$580
- − Repairs & maintenance
- −$1,170
- − Management
- −$1,170
- − Depreciation
- −$3,375
- Taxable income
- $1,019
- Est. tax owed @ 24.0%
- −$244
- After-tax cash flow
- $2,615/yr
For passive investors: Depreciation is non-cash, so a rental often shows a tax loss while cash-flowing — sheltering income. Rental losses are passive: they offset passive income freely, and up to $25,000/yr can offset ordinary (W-2) income if you actively participate and your MAGI is under $100k (phasing out to $0 by $150k); unused losses carry forward. On sale, claimed depreciation is recaptured at up to 25%, and gains may owe capital-gains tax (a 1031 exchange can defer both). Figures are a year-1 estimate at your 24.0% rate — not tax advice; consult a CPA.
Schools (NCES district)
- District
- Tri-Central Community Schools
- NCES district ID
- 1808040
- Math proficiency
- 28% ▼ -8.00%
- Reading proficiency
- 39% ▼ -8.00%
- Median HH income
- $54,902
- Composite
- 29.54/100
- National rank
- #6492
- State rank
- #196 of 301 in IN
Livability — Windfall City
- Score
- 57/100
- State rank
- #609
- US rank
- #21957
Category grades
Schools grade is shown separately in the Schools card above.
Census & demographics
- Census place
- Windfall City, IN
- Population (ZIP)
- 1,754
Population outlook (Tipton County) Hauer SSP2
- Today (2025)
- 14,332 people
- By 2030
- 13,717 · -4.3%
- By 2040
- 12,357 · -13.8%
- By 2050
- 11,032 · -23.0%
- By 2075
- 8,640 · -39.7%
- By 2100
- 6,544 · -54.3%
Race, ethnicity, and origin ACS 2023
- Neighborhood character
- Predominantly White (86%)
- Race & ethnicity
- White 86% Two or more races 8% Hispanic / Latino 5%
- Common ancestry
- Iranian 4% Slovak 2% Lithuanian 1%
- Languages at home
- 97% English-only · Spanish 2% Tagalog/Filipino 1%
Political lean MEDSL · Tipton
- 2024 margin
- Solid R (+50.8) · D 23.7% · R 74.5% · Other 1.7%
- 2008→2024 swing
- -35.5pp toward R · 2008: -15.4pp · 2024: -50.8pp
- All cycles
- 2024: R+50.8 2020: R+52.7 2016: R+53.3 2012: R+31.8 2008: R+15.4
Not yet ingested
- Civics
- —
Market trends
- HPI YoY
- ▲ 6.90%
- Current HPI
- 289.8652
- Rent YoY
- —
- Metro
- —
- State GDP YoY
- ▲ 2.90%
- F500 in state
- 18
Industry mix (Fortune 500 HQ in IN)
| Industry | F500 HQs | Revenue |
|---|---|---|
| Industrial Machinery | 2 | $37B |
|
||
| Healthcare | 1 | $177B |
|
||
| Pharmaceuticals | 1 | $45B |
|
||
| Metals / Steel | 1 | $18B |
|
||
| Agriculture | 1 | $17B |
|
||
| Packaging | 1 | $12B |
|
||
Price history
+54.9% since first listed9 events — show timeline
- 2026-06-12 Pending — MIBOR as Distributed by MLS Grid
- 2026-04-29 Listed $116,000 MIBOR as Distributed by MLS Grid
- 2022-06-10 Sold (Public Records) $127,500 Public Records
- 2022-06-10 Sold (MLS) $127,500 IRMLS
- 2022-05-06 Listed $119,900 IRMLS
- 2013-05-13 Sold (Public Records) $70,000 Public Records
- 2013-05-10 Listing Removed — MIBOR as Distributed by MLS Grid
- 2013-05-09 Sold (MLS) $70,000 MIBOR as Distributed by MLS Grid
- 2012-11-07 Listed $74,900 MIBOR as Distributed by MLS Grid
Property tax history
+8.2%/yrLatest (2024): $819 · +1.8% YoY. Source: county tax records.
Cash-flow waterfall
monthlySold comps — $/sqft
last 12 mo · ≤1 miLoading sold comps…