2302 Middle Rd · Allison Park, PA
Flood risk 1/10 · Minimal
- FEMA flood zone
- X (unshaded)
- Chance of flooding over 30 yrs
- 0.0%
- Est. flood insurance / yr
- $473 – $860
Fire risk 1/10 · Minimal
- Est. fire insurance / yr
- $511 – $949
Heat risk 3/10 · Minor
- Hot days now (above 97°F)
- 7 days/yr
- Hot days in 30 yrs
- 17 days/yr
Wind risk 2/10 · Minimal
- Chance of severe wind over 30 yrs
- —
Air-quality risk 4/10 · Minor
- Unhealthy air days now
- 3 days/yr
- Unhealthy air days in 30 yrs
- 7 days/yr
Risk factors via First Street. Map © Google.
Why this score? — see what drove the B+ grade
The composite is a weighted blend of 9 inputs, each scored 0–100. Each bar is that input's sub-score; the figure is the points it added to the 100-point composite (weight × sub-score).
- Cash flow +30.0/30.0
- ARV discount +15.0/15.0
- DSCR +10.0/10.0
- 1% rule +9.4/10.0
- Schools +6.9/10.0
- Livability +3.7/5.0
- Rent growth +2.5/5.0
- Condition / age +2.5/5.0
- Appreciation +0.0/10.0
$195,000
🖨 Deal sheet (PDF) 📄 Offer letter ✓ Due diligence
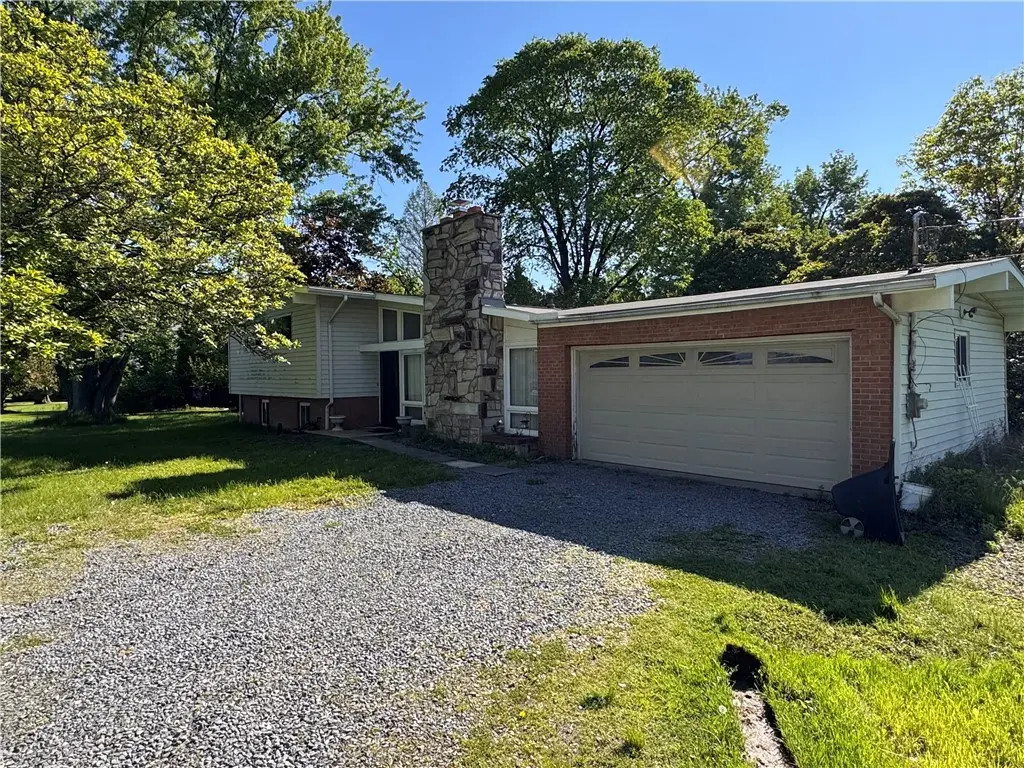
Listing remarks
Great floorplan! High ceilings and a retro layout with so much potential. The house is in disrepair and will require extensive repairs before moving in. Home is priced according to the home's condition. Home is being sold in as-is condition. Fox Chapel Schools and Fariview Elementary.
Key facts
- 0.87 acre lot
- 2 parking spots
- Built 1969
Property features AI
Finance
- HOA & community: Public transportation access
Exterior
- Parking: Two parking spaces
- Utilities: Public water; Public sewer; Electric service (implied)
- Home design: Two-story home; Asphalt roof
- Construction: Asphalt roof
- Exterior features: Public water; Public sewer; Approximately 0.871-acre lot; Property is resale
Interior
- Flooring: Tile
- Bathrooms: Two full bathrooms
- Heating & cooling: Gas hot water heating; Central air conditioning
- Interior features: Tile flooring; Has basement; Wood-burning fireplace on the lower level (one fireplace)
Neighborhood map
What this means for you Summary
Snapshot
- This is a 3-bed/1.5-bath single-family listed at $195k.
Deal economics
- At list price, monthly cash flow is $732 ($9k/yr) — positive.
- The deal already cash-flows at list — no discount required.
- Meets the 1% rule at list price ($3k rent vs $195k).
- Cap rate 10.8% vs local median 2.9% in Allison Park — top-decile yield for the area; either an underpriced asset or a hidden risk that comps aren't pricing in. Stress-test before assuming the spread holds.
Location & tenants
- Location reads 74/100 on livability (#509 in PA, #4,653 nationally) — a middle-class / working-renter tenant base. Strengths: crime A+, employment A+, housing A+; Watch: health & safety D, amenities F, commute F.
- Fox Chapel Area SD (suburban): math 73% / reading 85% proficiency, ranked #7 of 539 in PA (top 1%) — strong family-tenant draw, lease renewals of 3-5y typical; only 16% free/reduced lunch — higher-income household profile.
- Zoned schools: Dorseyville Ms (math 59% / reading 82%, grade A, #11 of 512 statewide, top 2%, 967 students, 24% FRL); Fox Chapel Area Hs (math 87%, 1,283 students, 25% FRL).
- Market conditions: 33 active listings in the ZIP; 1 comparable units currently listed for rent nearby; 2,996 units permitted in Allegheny County in 2024 (1,588 in 5+ unit buildings).
Forward outlook
- Local home prices are declining (-3.0%/yr); year-one equity from $1k of loan paydown is wiped out by about $6k of value loss. Plan a longer hold.
- At projected returns (-3.0% appreciation + 3.0% rent growth), your $55k cash investment doubles in ~8 years — after that, you're playing with house money.
Negotiation context
- Only 1 days on market — expect competitive offers; lowballing is unlikely to land.
Questions for the listing agent
- Built in 1969 — when were the roof, HVAC, electrical panel, plumbing, and water heater last replaced?
- Is there a deadline driving the sale (1031 exchange, divorce, estate, relocation)? That informs how much negotiation room exists.
- Schools are A-rated — typically a magnet for longer-tenancy family renters. What's the average tenant stay here, and is there a school-zone premium baked into asking?
- What's the average days-on-market for RENTAL listings here right now (not sales)? A rising rental-DOM trend means longer vacancies and softer asking-rent achievability than the comps imply.
- What's the recent tenant-quality profile in this submarket — average credit score on applications, eviction rate, late-payment / NSF rate, and stable-employment percentage? A property-management company in the area should have these aggregated.
- How much new for-sale + rental construction is in the pipeline within 1–3 miles? Heavy new supply typically softens prices + rents 12–24 months out; constrained supply supports both.
Investment metrics
- 1% rule
- 1.44% ✓
- Cap rate
- 10.80%
- Cash-on-cash
- 16.10%
- DSCR
- 1.72
- GRM
- 5.8
CMA / ARV
- ARV (on-the-fly)
- $384,741
- Comps found
- 12
Show comp detail 12 sales within ~0.75 mi
| Address | Dist | Beds/Ba | Sqft | Sold | Price | $/sf | Match |
|---|---|---|---|---|---|---|---|
| 2302 Middle Rd | 0.00mi | 4/2.0 (+1) | 1,953 (0%) | 0mo | $195,000 | $100 | 93 |
| 2709 Tillia St | 0.44mi | 3/2.5 | 1,832 (-6%) | 0mo | $360,000 | $197 | 65 |
| 2642 Sapling | 0.51mi | 3/3.0 | 2,023 (+4%) | 3mo | $350,000 | $173 | 62 |
| 2729 Tillia St | 0.38mi | 4/2.0 (+1) | 1,931 (-1%) | 15mo | $376,000 | $195 | 61 |
| 1421 Lakeside Dr | 0.64mi | 3/2.0 | 1,868 (-4%) | 1mo | $400,000 | $214 | 60 |
| 2521 Rose Dr | 0.63mi | 4/2.5 (+1) | 1,933 (-1%) | 4mo | $310,000 | $160 | 57 |
| 708 Mica Dr | 0.75mi | 3/2.5 | 1,877 (-4%) | 8mo | $400,000 | $213 | 48 |
| 3111 Hemlock Dr | 0.55mi | 4/2.5 (+1) | 1,944 (-0%) | 21mo | $410,000 | $211 | 47 |
| 3112 Ponderosa Dr | 0.44mi | 4/2.5 (+1) | 1,810 (-7%) | 15mo | $260,000 | $144 | 46 |
| 1500 Fernledge Dr | 0.67mi | 3/2.5 | 1,714 (-12%) | 3mo | $378,000 | $221 | 42 |
| 1446 Balsam Dr | 0.59mi | 4/2.5 (+1) | 1,728 (-12%) | 21mo | $260,000 | $150 | 26 |
| 2605 Sapling St | 0.56mi | 4/2.5 (+1) | 1,674 (-14%) | 22mo | $440,000 | $263 | 22 |
Match score weights: distance 35% · size 25% · config 20% · recency 20%. Top-matched comps best support the ARV.
Projected returns pro-forma
-3.0% appreciation · 3.0% rent growth · sell at horizon
- IRR
- 7.1%
- Equity multiple
- 1.28×
- Total profit
- $15,174
- Equity at exit
- $29,075
- IRR
- 16.5%
- Equity multiple
- 2.35×
- Total profit
- $73,783
- Equity at exit
- $16,860
Cash invested: $54,600 (down + closing). Projections, not guarantees.
Landlord ↔ Tenant lean methodology
- Overall (STATE)
- 62 Landlord-Friendly
- State Pennsylvania
- 62 Landlord-Friendly · EVEN
- County
- — inherits STATE
- City
- — inherits STATE
ZIP-level market 15116
- Home prices YoY
- -32.7%
- Active inventory
- 33
- Price-to-rent
- 5.8×
Monthly cashflow live
- Estimated rent
- $2,800 medium interval (Pro) →
- Mortgage (P&I)
- −$1,023
- Tax from tax record
- −$376 /mo · $4,509/yr
- Insurance
- −$81
- HOA
- −$0
- Lot rent
- −$0
- Vacancy / Maint / Mgmt
- −$588
- Net cashflow
- $732
Break-even live
Sensitivity live
| Price | -10% $843 | -5% $788 | +0% $732 | +5% $677 | +10% $622 |
|---|---|---|---|---|---|
| Rent | -10% $511 | -5% $622 | +0% $732 | +5% $843 | +10% $954 |
| Rate | -1.0pp $831 | -0.5pp $782 | base $732 | +0.5pp $682 | +1.0pp $631 |
UW: 25.0% down · 7.5% · 30yr · 1.5% tax · 5.0% vac · 8.0% maint · 8.0% mgmt
Financing live
Cash to close
- Down payment
- $48,750
- Closing costs
- $5,850
- Reserves months
- —
- Total cash needed
- —
Loan-product check · same deal, 3 products live
Conventional
25% down · 7.5% · 30yr
- Down + closing
- —
- Monthly P&I
- —
- Monthly cashflow
- —
- DSCR
- —
- Eligible?
- —
Personal DTI + credit; lowest rate.
DSCR
20% down · 8.5% · 30yr
- Down + closing
- —
- Monthly P&I
- —
- Monthly cashflow
- —
- DSCR
- —
- Eligible?
- —
No personal income docs; deal must DSCR.
Hard money
10% down · 12.0% · 12mo
- Down + closing
- —
- Monthly P&I
- —
- Monthly cashflow
- —
- DSCR
- —
- Eligible?
- —
Short-term bridge; refi at stabilization.
Rent comps 1 comps
| Address | Beds | Baths | Sqft | Rent | $/sqft | DOM | Units | Dist |
|---|---|---|---|---|---|---|---|---|
| 3137 Harts Run Rd Allison Park, PA | 3.0 | 1.5 | 1386 | $2,800 | $2.02 | 0d | 1 | 0.79mi |
Listing history 2 events
-
2026-05-09status Pending
-
2026-05-08$195,000 Active
ⓘ Source: listings_history table (triggers on properties + properties_extension) + one-shot
backfill from property_details.listing_events for pre-trigger history.
Tax reassessment forecast PA · Partial reset (capped growth)
- Current annual tax
- $4,509 · $376/mo
- Projected year-2 tax
- $4,509 · $376/mo
- Expected delta
- $0/yr ($0/mo · 0.0%)
ⓘ Screening estimate from a state-policy table — verify with the county assessor before closing.
Climate risk First Street
- Flood 1/10 Low FEMA zone X (unshaded) · 0% chance over 30 yrs
- Wildfire 1/10 Low
- Heat 3/10 Moderate 7 d/yr ≥97°F today · 17 d/yr by 30 yrs out
- Wind 2/10 Low
- Air quality 4/10 Moderate 3 unhealthy d/yr today · 7 by 30 yrs out
Nearby sold comps map
Loading sold comps map…
Walkable amenities ~0.75 mi
Loading nearby amenities…
Taxation est. · year 1
- Rental income
- $33,600
- − Mortgage interest
- −$10,923
- − Property taxes
- −$4,509
- − Insurance
- −$975
- − Repairs & maintenance
- −$2,688
- − Management
- −$2,688
- − Depreciation
- −$5,673
- Taxable income
- $6,145
- Est. tax owed @ 24.0%
- −$1,475
- After-tax cash flow
- $7,315/yr
For passive investors: Depreciation is non-cash, so a rental often shows a tax loss while cash-flowing — sheltering income. Rental losses are passive: they offset passive income freely, and up to $25,000/yr can offset ordinary (W-2) income if you actively participate and your MAGI is under $100k (phasing out to $0 by $150k); unused losses carry forward. On sale, claimed depreciation is recaptured at up to 25%, and gains may owe capital-gains tax (a 1031 exchange can defer both). Figures are a year-1 estimate at your 24.0% rate — not tax advice; consult a CPA.
Schools (NCES district)
- District
- Fox Chapel Area SD
- NCES district ID
- 4210070
- Math proficiency
- 73% ▼ -5.00%
- Reading proficiency
- 85% ▼ -2.00%
- Median HH income
- $73,326
- Composite
- 69.02/100
- National rank
- #324
- State rank
- #7 of 539 in PA
Livability — Allison Park
- Score
- 74/100
- State rank
- #509
- US rank
- #4653
Category grades
Schools grade is shown separately in the Schools card above.
Census & demographics
- City population
- 26,036
- Population (ZIP)
- 14,294
Population outlook (Allegheny County) Hauer SSP2
- Today (2025)
- 1,250,282 people
- By 2030
- 1,256,482 · +0.5%
- By 2040
- 1,256,318 · +0.5%
- By 2050
- 1,244,169 · -0.5%
- By 2075
- 1,197,693 · -4.2%
- By 2100
- 1,093,187 · -12.6%
Race, ethnicity, and origin ACS 2023
- Neighborhood character
- Predominantly White (93%)
- Race & ethnicity
- White 93% Two or more races 4% Asian 1%
- Common ancestry
- Romanian 9% Italian 2% Slovak 1%
- Foreign-born
- 2% · Canada
- Languages at home
- 97% English-only · Other Indo-European 2%
Political lean MEDSL · Allegheny
- 2024 margin
- Strong D (+20.3) · D 59.7% · R 39.4%
- 2008→2024 swing
- +4.8pp toward D · 2008: 15.5pp · 2024: 20.3pp
- All cycles
- 2024: D+20.3 2020: D+20.4 2016: D+16.4 2012: D+14.4 2008: D+15.5
Not yet ingested
- Civics
- —
Market trends
- HPI YoY
- ▼ -128.02%
- Current HPI
- 263.6997
- Rent YoY
- —
- Metro
- —
- State GDP YoY
- ▲ 1.68%
- F500 in state
- 34
Industry mix (Fortune 500 HQ in PA)
| Industry | F500 HQs | Revenue |
|---|---|---|
| Healthcare | 2 | $309B |
|
||
| Insurance | 2 | $27B |
|
||
| Telecommunications / Media | 1 | $124B |
|
||
| Industrial Distribution | 1 | $22B |
|
||
| Financial Services | 1 | $20B |
|
||
| Chemicals / Materials | 1 | $18B |
|
||
Price history
2 events — show timeline
- 2026-05-09 Pending — West Penn MLS
- 2026-05-08 Listed $195,000 West Penn MLS
Property tax history
+1.6%/yrLatest (2026): $4,509 · +1.6% YoY. Source: county tax records.
Cash-flow waterfall
monthlySold comps — $/sqft
last 12 mo · ≤1 miLoading sold comps…