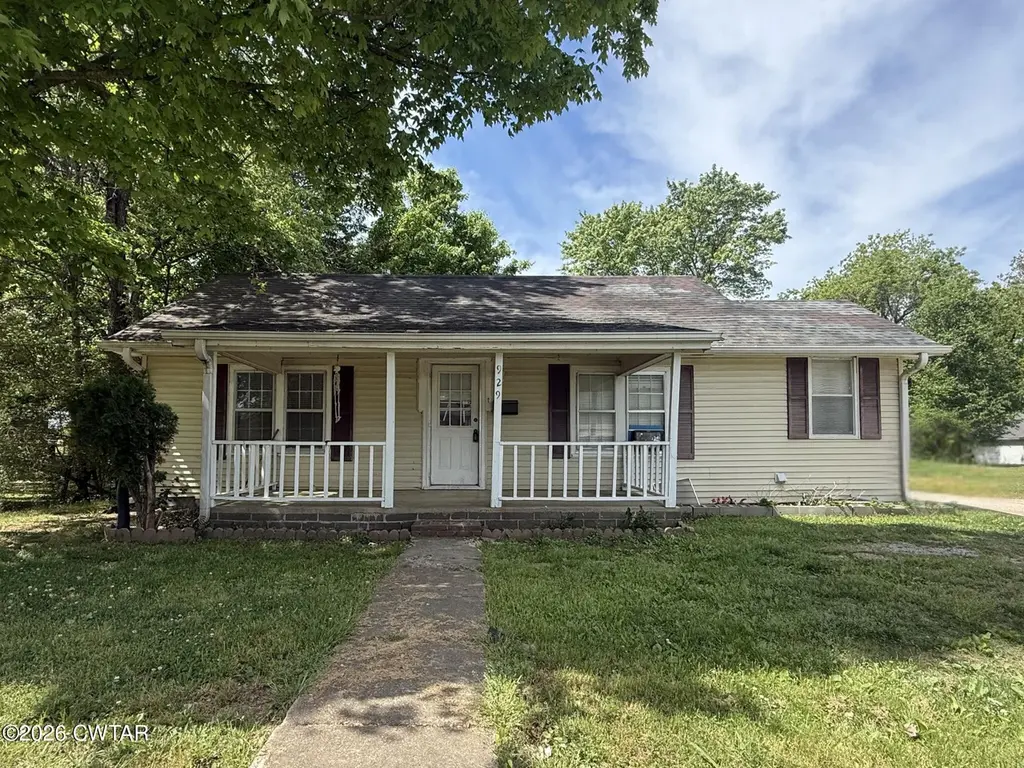
929 Hatchie St · Brownsville, TN
Flood risk 1/10 · Minimal
- FEMA flood zone
- X (unshaded)
- Chance of flooding over 30 yrs
- 0.0%
- Est. flood insurance / yr
- $507 – $1,088
Fire risk 1/10 · Minimal
- Est. fire insurance / yr
- $949 – $1,763
Heat risk 6/10 · Moderate
- Hot days now (above 109°F)
- 7 days/yr
- Hot days in 30 yrs
- 21 days/yr
Wind risk 4/10 · Minor
- Chance of severe wind over 30 yrs
- 14.0%
Air-quality risk 1/10 · Minimal
- Unhealthy air days now
- 0 days/yr
- Unhealthy air days in 30 yrs
- 0 days/yr
Risk factors via First Street. Map © Google.
Why this score? — see what drove the C- grade
The composite is a weighted blend of 9 inputs, each scored 0–100. Each bar is that input's sub-score; the figure is the points it added to the 100-point composite (weight × sub-score).
- Cash flow +19.9/30.0
- ARV discount +15.0/15.0
- DSCR +6.3/10.0
- 1% rule +4.5/10.0
- Livability +2.7/5.0
- Rent growth +2.5/5.0
- Condition / age +2.5/5.0
- Schools +0.6/10.0
- Appreciation +0.0/10.0
$120,000
🖨 Deal sheet 📄 Offer letter ✓ Due diligence
Listing remarks MLS
This home could be a great investment opportunity for the right buyer! Cash or conventional financing only. Home is being sold as is. Featuring 3 bedrooms, 1 bath, a living room, and a den for extra space. Shared driveway with neighboring property. Located in the heart of Haywood County. Great potential with the right vision!
Key facts
- 0.26 acre lot
- 2 parking spots
- Built 1948
Neighborhood map
What this means for you Summary
Snapshot
- This is a 3-bed/1.0-bath single-family listed at $120k.
Deal economics
- At list price, monthly cash flow is $145 ($2k/yr) — positive.
- The deal already cash-flows at list — no discount required.
- To meet the 1% rule (rent ≥ 1% of price), the offer needs to be $114k (5.2% below list).
- Recommended offer: $114k (5.2% below list) — sets the bar for 1% rule.
- Cap rate 7.7% vs local median 3.8% in Brownsville — top-decile yield for the area; either an underpriced asset or a hidden risk that comps aren't pricing in. Stress-test before assuming the spread holds.
Location & tenants
- Location reads 54/100 on livability (#374 in TN) — a working-class tenant base; expect higher turnover. Strengths: cost of living A+, health & safety A+, housing A-; Watch: schools F, crime F, amenities F.
- Haywood County (town): math 4% / reading 10% proficiency, ranked #137 of 139 in TN (top 99%) — low school quality limits family demand, transient renter base, plan for 1-2y turnover; 68% free/reduced lunch — lower-income household profile, screen leases tightly.
- Market conditions: 102 active listings in the ZIP; 10 comparable units currently listed for rent nearby; rentals lingering (median 44d on market — plan ~5-8 weeks vacancy on turnover, expect pricing pressure); 100% of comp listings sitting > 30 days — soft ceiling on asking rent; 22 units permitted in Haywood County in 2024 (0 in 5+ unit buildings).
Forward outlook
- Local home prices are declining (-3.0%/yr); year-one equity from $830 of loan paydown is wiped out by about $4k of value loss. Plan a longer hold.
- Haywood County population projected at -29% by 2050 — secular population decline; favor cash flow + early exit over multi-decade hold.
Negotiation context
- It's been on market 58 days — a 3% lower offer ($116k) is reasonable based on typical stale-listing flexibility.
- Current owner paid $68k; list at $120k implies a 77% gain — meaningful room to come down on a strong offer.
Risks & watch-outs
- Watch-outs: built in 1948 — expect roof / HVAC / electrical / plumbing capex.
- Climate carrying-cost: extreme-heat days projected 7→21/yr by 2055 (HVAC capex compounding) — expect insurance premiums to compound above CPI over the hold.
Questions for the listing agent
- It's been on market 58 days. Have you received any prior offers? Is the seller open to a 5% concession, seller financing, or rate buy-down credit?
- Built in 1948 — when were the roof, HVAC, electrical panel, plumbing, and water heater last replaced?
- Is there a deadline driving the sale (1031 exchange, divorce, estate, relocation)? That informs how much negotiation room exists.
- Schools are F-rated, which usually means shorter tenancies and higher turnover. Who's the typical renter profile here, and what's been the actual vacancy rate?
- Crime grade is F in this area — have there been break-ins, vandalism, or insurance claims at this property in the last 3 years? What carrier currently insures it and at what premium?
- What's the average days-on-market for RENTAL listings here right now (not sales)? A rising rental-DOM trend means longer vacancies and softer asking-rent achievability than the comps imply.
- What's the recent tenant-quality profile in this submarket — average credit score on applications, eviction rate, late-payment / NSF rate, and stable-employment percentage? A property-management company in the area should have these aggregated.
- How much new for-sale + rental construction is in the pipeline within 1–3 miles? Heavy new supply typically softens prices + rents 12–24 months out; constrained supply supports both.
Investment metrics
- 1% rule
- 0.95% ✗
- Cap rate
- 7.74%
- Cash-on-cash
- 5.18%
- DSCR
- 1.23
- GRM
- 8.8
CMA / ARV
- ARV (median comp)
- $162,332
- List price
- $120,000
- Delta
- -26.08%
- Verdict
- UNDERPRICED
- Comps
- 20 within 1.0 mi
Show comp detail 11 sales within ~0.75 mi
| Address | Dist | Beds/Ba | Sqft | Sold | Price | $/sf | Match |
|---|---|---|---|---|---|---|---|
| 833 Hatchie St | 0.08mi | 3/1.0 | 1,212 (-15%) | 2mo | $179,000 | $148 | 70 |
| 708 E Cooper St | 0.33mi | 3/1.5 | 1,296 (-9%) | 12mo | $198,000 | $153 | 57 |
| 309 Bellanti Cir | 0.28mi | 3/1.5 | 1,220 (-14%) | 6mo | $84,000 | $69 | 55 |
| 801 E Cooper St | 0.32mi | 3/2.0 | 1,274 (-11%) | 13mo | $99,950 | $78 | 53 |
| 457 Cottonwood Dr | 0.21mi | 3/2.0 | 1,246 (-13%) | 22mo | $180,000 | $144 | 47 |
| 210 Channing Loop | 0.45mi | 3/2.0 | 1,254 (-12%) | 12mo | $210,000 | $167 | 45 |
| 7 Harris Dr | 0.43mi | 3/2.0 | 1,254 (-12%) | 16mo | $229,000 | $183 | 42 |
| 230 Channing Loop | 0.46mi | 3/2.0 | 1,254 (-12%) | 18mo | $229,000 | $183 | 39 |
| 28 Harris Dr | 0.40mi | 3/2.0 | 1,247 (-13%) | 22mo | $239,900 | $192 | 38 |
| 28 Harris Dr | 0.40mi | 3/2.0 | 1,247 (-13%) | 22mo | $239,900 | $192 | 38 |
| 229 Channing Loop | 0.44mi | 3/2.0 | 1,254 (-12%) | 21mo | $225,000 | $179 | 38 |
Match score weights: distance 35% · size 25% · config 20% · recency 20%. Top-matched comps best support the ARV.
Projected returns pro-forma
-3.0% appreciation · 3.0% rent growth · sell at horizon
- IRR
- -8.3%
- Equity multiple
- 0.70×
- Total profit
- $-10,245
- Equity at exit
- $17,892
- IRR
- 1.2%
- Equity multiple
- 1.08×
- Total profit
- $2,844
- Equity at exit
- $10,375
Cash invested: $33,600 (down + closing). Projections, not guarantees.
Landlord ↔ Tenant lean methodology
- Overall (STATE)
- 87 Strongly Landlord-Friendly
- State Tennessee
- 87 Strongly Landlord-Friendly · R+13
- County
- — inherits STATE
- City
- — inherits STATE
ZIP-level market 38012
- Home prices YoY
- -17.6%
- Active inventory
- 102
- Price-to-rent
- 8.8×
Monthly cashflow live
- Estimated rent
- $1,137 high interval (Pro) →
- Mortgage (P&I)
- −$629
- Tax from tax record
- −$74 /mo · $890/yr
- Insurance
- −$50
- HOA
- −$0
- Vacancy / Maint / Mgmt
- −$239
- Net cashflow
- $145
Break-even live
UW: 25.0% down · 7.5% · 30yr · 1.5% tax · 5.0% vac · 8.0% maint · 8.0% mgmt
Financing live
Cash to close
- Down payment
- $30,000
- Closing costs
- $3,600
- Reserves months
- —
- Total cash needed
- —
Loan-product check · same deal, 3 products live
Conventional
25% down · 7.5% · 30yr
- Down + closing
- —
- Monthly P&I
- —
- Monthly cashflow
- —
- DSCR
- —
- Eligible?
- —
Personal DTI + credit; lowest rate.
DSCR
20% down · 8.5% · 30yr
- Down + closing
- —
- Monthly P&I
- —
- Monthly cashflow
- —
- DSCR
- —
- Eligible?
- —
No personal income docs; deal must DSCR.
Hard money
10% down · 12.0% · 12mo
- Down + closing
- —
- Monthly P&I
- —
- Monthly cashflow
- —
- DSCR
- —
- Eligible?
- —
Short-term bridge; refi at stabilization.
Rent comps 10 comps
| Address | Beds | Baths | Sqft | Rent | $/sqft | DOM | Units | Dist |
|---|---|---|---|---|---|---|---|---|
| 114 Holly Cv Brownsville, TN | 3.0 | 1.0 | 948 | $900 | $0.95 | 44d | 1 | 0.24mi |
| 610 Cottonwood Dr Brownsville, TN | 2.0 | 1.0 | 1100 | $1,200 | $1.09 | 44d | 1 | 0.27mi |
| 32 N Lafayette Ave Brownsville, TN | 2.0 | 2.0 | 1444 | $1,500 | $1.04 | 44d | 1 | 0.77mi |
| 105 S McLemore Ave Unit 2 Brownsville, TN | 2.0 | 1.0 | 1000 | $1,275 | $1.27 | 44d | 1 | 0.88mi |
| 229 N Church Ave Apt 2 Brownsville, TN | 2.0 | 2.0 | 1250 | $1,100 | $0.88 | 44d | 1 | 0.91mi |
| 216 N Russell Ave Brownsville, TN | 2.0 | 1.0 | 1350 | $1,250 | $0.93 | 44d | 1 | 0.93mi |
| 733 Madison Ave Unit 1 Brownsville, TN | 2.0 | 1.0 | 1736 | $700 | $0.40 | 44d | 1 | 1.04mi |
| 279 Easy Street Cv Unit 1 Brownsville, TN | 2.0 | 1.5 | 955 | $950 | $0.99 | 44d | 1 | 1.36mi |
| 489 Penny Ln Brownsville, TN | 2.0 | 1.0 | 1267 | $1,200 | $0.95 | 44d | 1 | 1.43mi |
| 1021 N Lafayette Ave Brownsville, TN | 2.0 | 1.0 | 957 | $900 | $0.94 | 44d | 1 | 1.44mi |
Listing history 20 events
-
2026-06-19days on market $120,000 Active 58 DOM
-
2026-06-18price $120,000 Active 57 DOM
-
2026-06-18days on market $130,000 Active 57 DOM
-
2026-06-17days on market $130,000 Active 56 DOM
-
2026-06-16days on market $130,000 Active 55 DOM
-
2026-06-15days on market $130,000 Active 54 DOM
-
2026-06-14days on market $130,000 Active 52 DOM
-
2026-06-13days on market $130,000 Active 51 DOM
-
2026-06-10days on market $130,000 Active 49 DOM
-
2026-06-09days on market $130,000 Active 48 DOM
-
2026-06-08days on market $130,000 Active 47 DOM
-
2026-06-07days on market $130,000 Active 46 DOM
-
2026-06-03days on market $130,000 Active 42 DOM
-
2026-06-02days on market $130,000 Active 41 DOM
-
2026-06-01days on market $130,000 Active 40 DOM
-
2026-05-31days on market $130,000 Active 39 DOM
-
2026-05-30days on market $130,000 Active 38 DOM
-
2026-04-17$130,000 Active 327-char remark
Show marketing remark (327 chars)
This home could be a great investment opportunity for the right buyer! Cash or conventional financing only. Home is being sold as is. Featuring 3 bedrooms, 1 bath, a living room, and a den for extra space. Shared driveway with neighboring property. Located in the heart of Haywood County. Great potential with the right vision!
-
2005-05-16soldstatus $67,900
-
2005-04-04soldstatus $39,000
ⓘ Source: listings_history table (triggers on properties + properties_extension) + one-shot
backfill from property_details.listing_events for pre-trigger history.
Tax reassessment forecast TN · Resets to sale price
- Current annual tax
- $890 · $74/mo
- Projected year-2 tax
- $890 · $74/mo
- Expected delta
- $0/yr ($0/mo · 0.0%)
ⓘ Screening estimate from a state-policy table — verify with the county assessor before closing.
Climate risk First Street
- Flood 1/10 Low FEMA zone X (unshaded) · 0% chance over 30 yrs
- Wildfire 1/10 Low
- Heat 6/10 Major 7 d/yr ≥109°F today · 21 d/yr by 30 yrs out
- Wind 4/10 Moderate 14% chance of damaging wind over 30 yrs
- Air quality 1/10 Low 0 unhealthy d/yr today · 0 by 30 yrs out
Nearby sold comps map
Loading sold comps map…
Walkable amenities ~0.75 mi
Loading nearby amenities…
Taxation est. · year 1
- Rental income
- $13,646
- − Mortgage interest
- −$6,722
- − Property taxes
- −$890
- − Insurance
- −$600
- − Repairs & maintenance
- −$1,092
- − Management
- −$1,092
- − Depreciation
- −$3,491
- Taxable loss
- −$240
- Est. tax savings @ 24.0%
- +$58
- After-tax cash flow
- $1,797/yr
For passive investors: Depreciation is non-cash, so a rental often shows a tax loss while cash-flowing — sheltering income. Rental losses are passive: they offset passive income freely, and up to $25,000/yr can offset ordinary (W-2) income if you actively participate and your MAGI is under $100k (phasing out to $0 by $150k); unused losses carry forward. On sale, claimed depreciation is recaptured at up to 25%, and gains may owe capital-gains tax (a 1031 exchange can defer both). Figures are a year-1 estimate at your 24.0% rate — not tax advice; consult a CPA.
Schools (NCES district)
- District
- Haywood County
- NCES district ID
- 4701770
- Math proficiency
- 4% ▼ -16.00%
- Reading proficiency
- 10% ▼ -10.00%
- Median HH income
- $34,095
- Composite
- 5.6/100
- National rank
- #10024
- State rank
- #137 of 139 in TN
Livability — Brownsville
- Score
- 54/100
- State rank
- #374
- US rank
- #23967
Category grades
Schools grade is shown separately in the Schools card above.
Census & demographics
- Census place
- Brownsville, TN
- City population
- 13,079
- Population (ZIP)
- 13,079
Population outlook (Haywood County) Hauer SSP2
- Today (2025)
- 16,649 people
- By 2030
- 15,733 · -5.5%
- By 2040
- 13,718 · -17.6%
- By 2050
- 11,876 · -28.7%
- By 2075
- 8,673 · -47.9%
- By 2100
- 7,001 · -57.9%
Race, ethnicity, and origin ACS 2023
- Neighborhood character
- Majority Black (59%)
- Race & ethnicity
- Black 59% White 35% Hispanic / Latino 4% Two or more races 2%
- Common ancestry
- Lithuanian 1% Italian 1% Slovak 1%
- Foreign-born
- 2% · Canada
- Languages at home
- 97% English-only · Spanish 2% Arabic 1%
Political lean MEDSL · Haywood
- 2024 margin
- Toss-up / Even · D 49.8% · R 49.4%
- 2008→2024 swing
- -20.9pp toward R · 2008: 21.3pp · 2024: 0.4pp
- All cycles
- 2024: D+0.4 2020: D+9.0 2016: D+10.2 2012: D+21.2 2008: D+21.3
Not yet ingested
- Civics
- —
Market trends
- HPI YoY
- ▼ -47.81%
- Current HPI
- 224.2645
- Rent YoY
- —
- Metro
- —
- State GDP YoY
- ▲ 2.78%
- F500 in state
- 22
Industry mix (Fortune 500 HQ in TN)
| Industry | F500 HQs | Revenue |
|---|---|---|
| Healthcare | 3 | $91B |
|
||
| Retail | 3 | $72B |
|
||
| Transportation / Logistics | 1 | $88B |
|
||
| Paper / Packaging | 1 | $19B |
|
||
| Insurance | 1 | $13B |
|
||
| Energy | 1 | $12B |
|
||
Price history
+233.3% since first listed3 events — show timeline
- 2026-04-17 Listed $130,000 CWTAR
- 2005-05-16 Sold (Public Records) $67,900 Public Records
- 2005-04-04 Sold (Public Records) $39,000 Public Records
Property tax history
+5.2%/yrLatest (2025): $890 · +0.0% YoY. Source: county tax records.
Cash-flow waterfall
monthlySold comps — $/sqft
last 12 mo · ≤1 miLoading sold comps…