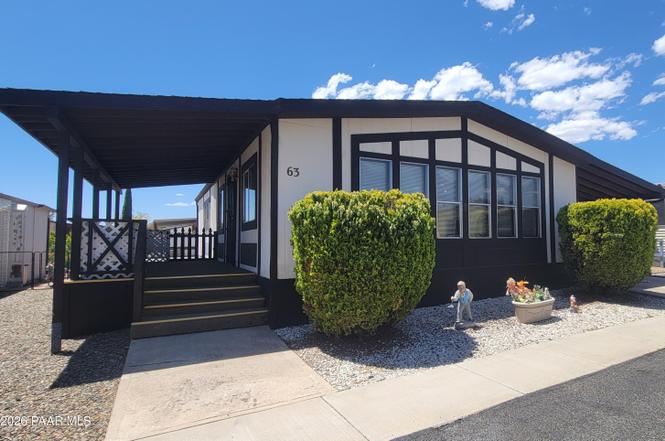
7901 E State Route 69 #63 · Prescott Valley, AZ
Flood risk 1/10 · Minimal
- FEMA flood zone
- X (unshaded)
- Chance of flooding over 30 yrs
- 0.0%
- Est. flood insurance / yr
- $507 – $1,088
Fire risk 5/10 · Moderate
- Est. fire insurance / yr
- $610 – $1,132
Heat risk 4/10 · Minor
- Hot days now (above 94°F)
- 1 days/yr
- Hot days in 30 yrs
- 4 days/yr
Wind risk 1/10 · Minimal
- Chance of severe wind over 30 yrs
- —
Air-quality risk 1/10 · Minimal
- Unhealthy air days now
- 0 days/yr
- Unhealthy air days in 30 yrs
- 0 days/yr
Risk factors via First Street. Map © Google.
Why this score? — see what drove the B- grade
The composite is a weighted blend of 9 inputs, each scored 0–100. Each bar is that input's sub-score; the figure is the points it added to the 100-point composite (weight × sub-score).
- Cash flow +30.0/30.0
- 1% rule +10.0/10.0
- DSCR +10.0/10.0
- ARV discount +7.5/15.0
- Livability +3.1/5.0
- Schools +2.9/10.0
- Condition / age +2.8/5.0
- Rent growth +2.7/5.0
- Appreciation +0.0/10.0
$95,000
🖨 Deal sheet 📄 Offer letter ✓ Due diligence
Listing remarks
Welcome home to your spacious doublewide featuring two bedrooms, two full bathrooms, and a large living area with bright windows. Stylish ceiling beams create immediate visual interest and match the dining room's built-in cabinet display. Throughout the house, walls are finished with sheetrock to provide a highly customizable blank canvas ready for paint or wallpaper giving you the flexibility of finishes and colors to fit your style as you make it your own. With a comfortable porch and a versatile workshop for your projects or storage off the covered parking area, this home is ready for you. The exterior has recently been painted and the interior is ready for you to personalize as you like
Key facts
- Comfortable porch
- Large living area
- Covered parking area
Tags
Property features AI
Finance
- Other: Subdivision maintained roads; Level topography; Zoning: RU-18
- Financial info: Land is leased
- HOA & community: Senior community; Subdivision membership required
Exterior
- Parking: Attached carport (1 parking space)
- Utilities: Public water; City sewer; Electricity available; Natural gas available; Natural gas water heater
- Home design: Residential manufactured home (double wide); Single-story
- Construction: Frame construction; Composition roof; Piers foundation; Built as a double wide manufactured home
- Exterior features: Covered patio/porch; Concrete driveway; Aluminum window frames with blinds
Interior
- Kitchen: Electric cooktop; Electric range/oven; Microwave; Refrigerator
- Flooring: Carpet; Vinyl
- Bathrooms: 2 full bathrooms
- Heating & cooling: Forced air gas heating; Central air conditioning; Ceiling fan cooling
- Interior features: Ceiling fans; Formal dining area; Soaking tub; Laminate counters; Hobby/Studio
- Laundry & utility: Washer; Dryer
Neighborhood map
What this means for you Summary
Snapshot
- This is a 2-bed/2.0-bath single-family listed at $95k. Condition is rated average.
Deal economics
- At list price, monthly cash flow is $721 ($9k/yr) — positive.
- The deal already cash-flows at list — no discount required.
- Meets the 1% rule at list price ($2k rent vs $95k).
- Cap rate 15.4% vs local median 3.2% in Prescott Valley — top-decile yield for the area; either an underpriced asset or a hidden risk that comps aren't pricing in. Stress-test before assuming the spread holds.
Location & tenants
- Location reads 62/100 on livability (#126 in AZ) — a middle-class / working-renter tenant base. Strengths: housing A+, crime A-; Watch: schools C-, amenities F, commute F.
- Humboldt Unified District (4469) (suburban): math 31% / reading 37% proficiency, ranked #94 of 249 in AZ (top 38%) — families likely to look elsewhere, expect single-tenant / working-renter base with shorter leases.
- Market conditions: Rents flat; 447 active listings in the ZIP; 24 comparable units currently listed for rent nearby; rentals at typical pace (median 21d on market — plan ~3-4 weeks tenant-placement turnaround); 46% of comp listings sitting > 30 days — soft ceiling on asking rent; 2,062 units permitted in Yavapai County in 2024 (98 in 5+ unit buildings).
- This rent runs 30% of the median local income ($69k/yr) — at the standard rent-burdened threshold; future hikes will face affordability resistance.
Forward outlook
- Local home prices are declining (-3.0%/yr); year-one equity from $657 of loan paydown is wiped out by about $3k of value loss. Plan a longer hold.
- Yavapai County population projected at +10% by 2050 — modest demand growth; plan on rents tracking national, not racing it.
- At projected returns (-3.0% appreciation + 1.0% rent growth), your $27k cash investment doubles in ~4 years — after that, you're playing with house money.
Negotiation context
- Only 1 days on market — expect competitive offers; lowballing is unlikely to land.
Risks & watch-outs
- Climate carrying-cost: moderate wildfire risk — expect insurance premiums to compound above CPI over the hold.
Questions for the listing agent
- Is there a deadline driving the sale (1031 exchange, divorce, estate, relocation)? That informs how much negotiation room exists.
- What's the average days-on-market for RENTAL listings here right now (not sales)? A rising rental-DOM trend means longer vacancies and softer asking-rent achievability than the comps imply.
- What's the recent tenant-quality profile in this submarket — average credit score on applications, eviction rate, late-payment / NSF rate, and stable-employment percentage? A property-management company in the area should have these aggregated.
- How much new for-sale + rental construction is in the pipeline within 1–3 miles? Heavy new supply typically softens prices + rents 12–24 months out; constrained supply supports both.
Investment metrics
- 1% rule
- 1.84% ✓
- Cap rate
- 15.40%
- Cash-on-cash
- 32.53%
- DSCR
- 2.45
- GRM
- 4.5
CMA / ARV
- ARV (on-the-fly)
- $336,000
- Comps found
- 12
Show comp detail 12 sales within ~0.75 mi
| Address | Dist | Beds/Ba | Sqft | Sold | Price | $/sf | Match |
|---|---|---|---|---|---|---|---|
| 7901 E State Route 69 #53 | 0.00mi | 2/2.0 | 1,152 (-4%) | 8mo | $85,000 | $74 | 86 |
| 7901 E State Route 69 #31 | 0.00mi | 3/2.0 (+1) | 1,152 (-4%) | 9mo | $109,200 | $95 | 81 |
| 2701 N Mesa Dr | 0.20mi | 3/2.0 (+1) | 1,340 (+12%) | 3mo | $332,000 | $248 | 64 |
| 8101 E Prescott Rd | 0.54mi | 3/2.0 (+1) | 1,226 (+2%) | 6mo | $390,000 | $318 | 62 |
| 3400 N Tani Rd | 0.58mi | 3/2.0 (+1) | 1,249 (+4%) | 7mo | $349,900 | $280 | 55 |
| 3475 N Etheridge Dr | 0.75mi | 3/2.0 (+1) | 1,176 (-2%) | 3mo | $375,000 | $319 | 54 |
| 8131 E Canyon Ln | 0.24mi | 3/2.0 (+1) | 1,344 (+12%) | 12mo | $280,000 | $208 | 54 |
| 8366 E Yavapai Rd | 0.63mi | 3/2.0 (+1) | 1,216 (+1%) | 14mo | $341,000 | $280 | 52 |
| 3547 N Lynn Dr | 0.75mi | 2/2.0 | 1,264 (+5%) | 7mo | $317,500 | $251 | 51 |
| 3280 N Bumblebee Dr | 0.60mi | 3/2.0 (+1) | 1,120 (-7%) | 10mo | $339,000 | $303 | 47 |
| 3191 N Bumblebee Dr | 0.44mi | 3/2.0 (+1) | 1,032 (-14%) | 12mo | $330,000 | $320 | 41 |
| 3484 N Tani Rd | 0.66mi | 3/2.0 (+1) | 1,368 (+14%) | 11mo | $335,000 | $245 | 32 |
Match score weights: distance 35% · size 25% · config 20% · recency 20%. Top-matched comps best support the ARV.
Projected returns pro-forma
-3.0% appreciation · 0.97% rent growth · sell at horizon
- IRR
- 25.3%
- Equity multiple
- 2.02×
- Total profit
- $27,061
- Equity at exit
- $14,165
- IRR
- 31.8%
- Equity multiple
- 3.60×
- Total profit
- $69,046
- Equity at exit
- $8,214
Cash invested: $26,600 (down + closing). Projections, not guarantees.
Landlord ↔ Tenant lean methodology
- Overall (STATE)
- 87 Strongly Landlord-Friendly
- State Arizona
- 87 Strongly Landlord-Friendly · R+3
- County
- — inherits STATE
- City
- — inherits STATE
ZIP-level market 86314
- Home prices YoY
- -32.3%
- Rents YoY
- 1.0%
- Active inventory
- 447
- Price-to-rent
- 4.5×
Monthly cashflow live
- Estimated rent
- $1,744 high interval (Pro) →
- Mortgage (P&I)
- −$498
- Tax est. 1.5%
- −$119 /mo · $1,425/yr
- Insurance
- −$40
- HOA
- −$0
- Vacancy / Maint / Mgmt
- −$366
- Net cashflow
- $721
Break-even live
UW: 25.0% down · 7.5% · 30yr · 1.5% tax · 5.0% vac · 8.0% maint · 8.0% mgmt
Financing live
Cash to close
- Down payment
- $23,750
- Closing costs
- $2,850
- Reserves months
- —
- Total cash needed
- —
Loan-product check · same deal, 3 products live
Conventional
25% down · 7.5% · 30yr
- Down + closing
- —
- Monthly P&I
- —
- Monthly cashflow
- —
- DSCR
- —
- Eligible?
- —
Personal DTI + credit; lowest rate.
DSCR
20% down · 8.5% · 30yr
- Down + closing
- —
- Monthly P&I
- —
- Monthly cashflow
- —
- DSCR
- —
- Eligible?
- —
No personal income docs; deal must DSCR.
Hard money
10% down · 12.0% · 12mo
- Down + closing
- —
- Monthly P&I
- —
- Monthly cashflow
- —
- DSCR
- —
- Eligible?
- —
Short-term bridge; refi at stabilization.
Rent comps 24 comps
| Address | Beds | Baths | Sqft | Rent | $/sqft | DOM | Units | Dist |
|---|---|---|---|---|---|---|---|---|
| 2885 N Panorama Dr Prescott Valley, AZ | 2.0 | 2.0 | 1056 | $1,800 | $1.70 | 43d | 1 | 0.10mi |
| 2885 N Panorama Dr Prescott Valley, AZ | 2.0 | 2.0 | 1056 | $1,800 | $1.70 | 13d | 1 | 0.10mi |
| 3230 N Victor Rd Unit C Prescott Valley, AZ | 2.0 | 1.0 | 850 | $1,350 | $1.59 | 13d | 1 | 0.35mi |
| 3148 N Navajo Dr Unit C Prescott Valley, AZ | 2.0 | 1.5 | 1024 | $1,425 | $1.39 | 20d | 1 | 0.54mi |
| 3131 N Main St Prescott Valley, AZ | 1.0–3.0 | 1.0–2.0 | 935 | $1,722 | $1.84 | 13d | 33 | 0.59mi |
| 3290 N Bumblebee Dr Unit A Prescott Valley, AZ | 2.0 | 2.0 | 1050 | $1,550 | $1.48 | 13d | 1 | 0.60mi |
| 8411 E Sommer Dr Prescott Valley, AZ | 3.0 | 2.0 | 1254 | $1,900 | $1.52 | 20d | 1 | 0.72mi |
| 8683 E Commons Cir Prescott Valley, AZ | 1.0–2.0 | 1.0–2.0 | 834 | $1,785 | $2.14 | 13d | 5 | 0.78mi |
| 8132 E Lakeshore Dr Unit B Prescott Valley, AZ | 2.0 | 2.0 | 890 | $1,400 | $1.57 | 43d | 1 | 0.81mi |
| 3028 N Corrine Dr Unit A Prescott Valley, AZ | 2.0 | 1.0 | 889 | $1,600 | $1.80 | 20d | 1 | 0.82mi |
| 3027 N Corrine Dr #2 Prescott Valley, AZ | 3.0 | 2.0 | 1211 | $1,695 | $1.40 | 20d | 1 | 0.85mi |
| 3123 N Corrine Dr Apt B Prescott Valley, AZ | 2.0 | 2.0 | 1111 | $1,595 | $1.44 | 43d | 1 | 0.91mi |
| 3830 N Windsong Dr Prescott Valley, AZ | 1.0–3.0 | 1.0–2.0 | 1097 | $2,034 | $1.85 | 13d | 22 | 0.94mi |
| 3231 N Corrine Dr Unit B Prescott Valley, AZ | 2.0 | 2.0 | 948 | $1,500 | $1.58 | 43d | 1 | 0.98mi |
| 3172 N Truwood Dr Unit D Prescott Valley, AZ | 3.0 | 2.0 | 1335 | $1,525 | $1.14 | 43d | 1 | 0.98mi |
| 3279 N Corrine Dr Unit A Prescott Valley, AZ | 2.0 | 1.0 | 738 | $1,400 | $1.90 | 43d | 1 | 1.01mi |
| 8396 E Stevens Dr Unit B Prescott Valley, AZ | 2.0 | 2.0 | 978 | $2,000 | $2.04 | 43d | 1 | 1.03mi |
| 8396 E Stevens Dr Unit A Prescott Valley, AZ | 2.0 | 2.0 | 950 | $2,000 | $2.11 | 43d | 1 | 1.03mi |
| 3850 E Teri Ct #1 Prescott Valley, AZ | 3.0 | 2.0 | 1453 | $2,000 | $1.38 | 43d | 1 | 1.04mi |
| 3866 E Teri Ct Unit A Prescott Valley, AZ | 3.0 | 2.0 | 1050 | $1,675 | $1.60 | 13d | 1 | 1.08mi |
| 8503 E Leigh Dr Unit 3 Prescott Valley, AZ | 3.0 | 2.5 | 1414 | $2,195 | $1.55 | 43d | 1 | 1.12mi |
| 3901 N Main St Prescott Valley, AZ | 1.0–3.0 | 1.0–2.0 | 978 | $1,910 | $1.95 | 13d | 16 | 1.34mi |
| 4348 N Sauter Dr W Prescott Valley, AZ | 3.0 | 2.0 | 1400 | $2,100 | $1.50 | 20d | 1 | 1.38mi |
| 4357 N Miner Rd Prescott Valley, AZ | 2.0 | 2.0 | 960 | $1,600 | $1.67 | 43d | 1 | 1.45mi |
Listing history 2 events
-
2026-06-17remarks 699-char remark
-
2026-06-17$95,000 Active 1 DOM
ⓘ Source: listings_history table (triggers on properties + properties_extension) + one-shot
backfill from property_details.listing_events for pre-trigger history.
Climate risk First Street
- Flood 1/10 Low FEMA zone X (unshaded) · 0% chance over 30 yrs
- Wildfire 5/10 Major
- Heat 4/10 Moderate 1 d/yr ≥94°F today · 4 d/yr by 30 yrs out
- Wind 1/10 Low
- Air quality 1/10 Low 0 unhealthy d/yr today · 0 by 30 yrs out
Nearby sold comps map
Loading sold comps map…
Walkable amenities ~0.75 mi
Loading nearby amenities…
Taxation est. · year 1
- Rental income
- $20,924
- − Mortgage interest
- −$5,321
- − Property taxes
- −$1,425
- − Insurance
- −$475
- − Repairs & maintenance
- −$1,674
- − Management
- −$1,674
- − Depreciation
- −$2,764
- Taxable income
- $7,591
- Est. tax owed @ 24.0%
- −$1,822
- After-tax cash flow
- $6,830/yr
For passive investors: Depreciation is non-cash, so a rental often shows a tax loss while cash-flowing — sheltering income. Rental losses are passive: they offset passive income freely, and up to $25,000/yr can offset ordinary (W-2) income if you actively participate and your MAGI is under $100k (phasing out to $0 by $150k); unused losses carry forward. On sale, claimed depreciation is recaptured at up to 25%, and gains may owe capital-gains tax (a 1031 exchange can defer both). Figures are a year-1 estimate at your 24.0% rate — not tax advice; consult a CPA.
Condition & rehab AI · 12 photos
This doublewide home is in average condition with cosmetic repairs needed. Painting, flooring, and appliance upgrades can significantly enhance its resale and rental value.
Repairs flagged
- Minor Paint — Paint appears faded in some areas.
- Minor Flooring — Carpet shows some wear and tear.
- Minor Kitchen appliances — Standard appliances may need cleaning or minor repairs.
Value-add opportunities
- Resale Painting — Fresh paint can enhance curb appeal and interior aesthetics.
- Resale New flooring — New carpet or hardwood flooring can significantly improve the home's appearance.
- Resale Upgraded appliances — Modern appliances can attract more buyers and renters.
- Both Landscaping — A well-maintained garden can increase both resale and rental value.
- Both HVAC maintenance — A clean and efficient HVAC system can improve comfort and energy efficiency, attracting more tenants and buyers.
Renovation cost estimate screening
| Repair item | Severity | Est. cost |
|---|---|---|
| Paint · Paint appears faded in some areas. | Minor | $500–3,000 |
| Flooring · Carpet shows some wear and tear. | Minor | $500–3,000 |
| Kitchen appliances · Standard appliances may need cleaning or minor repairs. | Minor | $500–3,000 |
| Total estimated repair cost · 3 items | $1,500–9,000 |
Value-add ROI direction
- Resale Painting — Fresh paint can enhance curb appeal and interior aesthetics. ↑
- Resale New flooring — New carpet or hardwood flooring can significantly improve the home's appearance. ↑
- Resale Upgraded appliances — Modern appliances can attract more buyers and renters. ↑
- Both Landscaping — A well-maintained garden can increase both resale and rental value. ↑
- Both HVAC maintenance — A clean and efficient HVAC system can improve comfort and energy efficiency, attracting more tenants and buyers. ↑
ⓘ Cost ranges are severity-bucket heuristics (US national rule-of-thumb). Get contractor quotes + a written scope before underwriting a rehab budget.
Schools (NCES district)
- District
- Humboldt Unified District (4469)
- NCES district ID
- 0403870
- Math proficiency
- 31% ▼ -13.00%
- Reading proficiency
- 37% ▼ -14.00%
- Median HH income
- $45,326
- Composite
- 29.06/100
- National rank
- #6605
- State rank
- #94 of 249 in AZ
Livability — Prescott Valley
- Score
- 62/100
- State rank
- #126
- US rank
- #16160
Category grades
Schools grade is shown separately in the Schools card above.
Census & demographics
- Census place
- Prescott Valley, AZ
- County
- Yavapai County · 190,406 people
- City population
- 63,155
- Metro
- Prescott Valley-Prescott, AZ
- Population (ZIP)
- 40,317
- Household income
- $69,208
- Rent vs Own
- Severe rent burden
- 1236.0
Population outlook (Yavapai County) Hauer SSP2
- Today (2025)
- 241,389 people
- By 2030
- 249,523 · +3.4%
- By 2040
- 259,966 · +7.7%
- By 2050
- 264,736 · +9.7%
- By 2075
- 269,334 · +11.6%
- By 2100
- 256,505 · +6.3%
Race, ethnicity, and origin ACS 2023
- Neighborhood character
- Predominantly White (71%)
- Race & ethnicity
- White 71% Hispanic / Latino 22% Two or more races 15% Asian 1% Native American 1%
- Hispanic origin (detail)
- Mexican 20%
- Common ancestry
- Slovak 4% Lithuanian 3% Romanian 3%
- Foreign-born
- 8% · Canada
- Languages at home
- 83% English-only · Spanish 15%
Political lean MEDSL · Yavapai
- 2024 margin
- Solid R (+33.9) · D 32.6% · R 66.5%
- 2008→2024 swing
- -9.5pp toward R · 2008: -24.4pp · 2024: -33.9pp
- All cycles
- 2024: R+33.9 2020: R+29.3 2016: R+31.4 2012: R+30.7 2008: R+24.4
Not yet ingested
- Civics
- —
Market trends
- HPI YoY
- ▼ -176.27%
- Current HPI
- 370.04
- Rent YoY
- ▲ 0.97%
- Metro
- Prescott Valley-Prescott, AZ
- State GDP YoY
- ▲ 4.54%
- F500 in state
- 20
Industry mix (Fortune 500 HQ in AZ)
| Industry | F500 HQs | Revenue |
|---|---|---|
| Technology | 2 | $13B |
|
||
| Mining / Metals | 1 | $23B |
|
||
| Environmental Services | 1 | $16B |
|
||
| Metals / Steel | 1 | $14B |
|
||
| Technology Distribution | 1 | $9B |
|
||
| Homebuilding | 1 | $8B |
|
||
Price history
1 event — show timeline
- 2026-06-17 Listed $95,000 PAARMLS as Distributed by MLS Grid
Cash-flow waterfall
monthlySold comps — $/sqft
last 12 mo · ≤1 miLoading sold comps…