2375 Clinton Dr · Sunrise Shores, TX
Flood risk 1/10 · Minimal
- FEMA flood zone
- X (unshaded)
- Chance of flooding over 30 yrs
- 0.0%
- Est. flood insurance / yr
- $507 – $1,088
Fire risk 3/10 · Minor
- Est. fire insurance / yr
- $1,222 – $2,270
Heat risk 7/10 · Major
- Hot days now (above 109°F)
- 7 days/yr
- Hot days in 30 yrs
- 26 days/yr
Wind risk 6/10 · Moderate
- Chance of severe wind over 30 yrs
- 67.0%
Air-quality risk 1/10 · Minimal
- Unhealthy air days now
- 0 days/yr
- Unhealthy air days in 30 yrs
- 0 days/yr
Risk factors via First Street. Map © Google.
Why this score? — see what drove the D grade
The composite is a weighted blend of 9 inputs, each scored 0–100. Each bar is that input's sub-score; the figure is the points it added to the 100-point composite (weight × sub-score).
- Cash flow +19.1/30.0
- DSCR +6.0/10.0
- 1% rule +5.1/10.0
- Condition / age +4.0/5.0
- Schools +3.7/10.0
- Rent growth +2.5/5.0
- Livability +2.5/5.0
- ARV discount +0.0/15.0
- Appreciation +0.0/10.0
$149,500
🖨 Deal sheet (PDF) 📄 Offer letter ✓ Due diligence
Listing remarks MLS
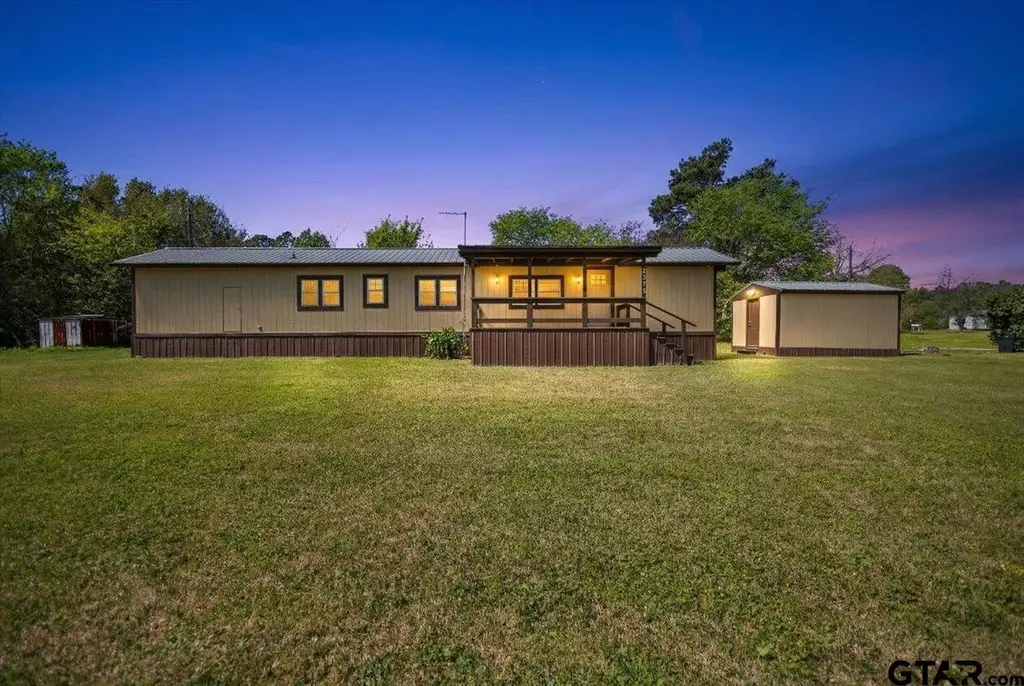
This wonderful 3/2 mobile home located at the end of a quiet street off Hwy 315 in Chandler is now available! On approx. 0.35 acres, this property has plenty of room to keep your outdoor toys and Flat Creek Public Boat Ramp is less than 2 miles away! The home has been completely remodeled with an abundance of updates and is MOVE IN READY! Exterior features include fresh paint, new windows and doors, and a sturdy aluminum roof. The interior has been completed refreshed with neutral paint, new subflooring and flooring, new doors and fixtures! The kitchen has brand new cabinets along with all necessary appliances and the bathrooms have been completely redone. Plumbing updates include a new water heater and piping. This home is in tip top shape and just needs your decorations. Make it yours today!
Key facts
- Quiet street
- Aluminum roof
- Fresh paint
Tags
Neighborhood map
What this means for you Summary
Snapshot
- This is a 3-bed/2.0-bath manufactured listed at $150k. Condition is rated good.
Deal economics
- At list price, monthly cash flow is $159 ($2k/yr) — positive.
- The deal already cash-flows at list — no discount required.
- Meets the 1% rule at list price ($2k rent vs $150k).
- Recommended offer: $141k (6.0% below list) — sets the bar for market timing.
- Cap rate 7.6% vs local median 4.1% in Sunrise Shores — top-decile yield for the area; either an underpriced asset or a hidden risk that comps aren't pricing in. Stress-test before assuming the spread holds.
Location & tenants
- Location reads: area grade D — affects rentability + tenant quality, not the cash-flow math above.
- Brownsboro ISD (rural): math 42% / reading 46% proficiency, ranked #290 of 826 in TX (top 35%) — families likely to look elsewhere, expect single-tenant / working-renter base with shorter leases.
- Zoned schools: Chandler El (math 42% / reading 37%, grade F, #1,545 of 4,322 statewide, top 38%, 450 students, 74% FRL); Brownsboro J H (math 48% / reading 49%, grade C-, #392 of 1,662 statewide, top 24%, 405 students, 60% FRL); Brownsboro H S (math 31% / reading 63%, grade D-, #591 of 1,632 statewide, top 38%, 757 students, 50% FRL).
- Market conditions: 228 active listings in the ZIP; 263 units permitted in Henderson County in 2024 (0 in 5+ unit buildings).
Forward outlook
- Local home prices are declining (-3.0%/yr); year-one equity from $1k of loan paydown is wiped out by about $4k of value loss. Plan a longer hold.
Negotiation context
- It's been on market 89 days — a 6% lower offer ($141k) is reasonable based on typical stale-listing flexibility.
- 3 sale attempts with the ask held roughly flat each time — persistent listings suggest the price (not the market) is what's stuck; bring a comps-based counter.
Risks & watch-outs
- Climate carrying-cost: major wind risk, 67% chance of damaging wind over 30y; extreme-heat days projected 7→26/yr by 2055 (HVAC capex compounding) — expect insurance premiums to compound above CPI over the hold.
Questions for the listing agent
- It's been on market 89 days. Have you received any prior offers? Is the seller open to a 6% concession, seller financing, or rate buy-down credit?
- Why hasn't it sold? Are there any deal-killer items the seller is aware of (foundation, flood, title, zoning, code violations)?
- Is there a deadline driving the sale (1031 exchange, divorce, estate, relocation)? That informs how much negotiation room exists.
- The area grade is low — what's the realistic commute time and amenity access for the typical tenant pool here? Any planned neighborhood developments (good or bad) we should know about?
- What's the average days-on-market for RENTAL listings here right now (not sales)? A rising rental-DOM trend means longer vacancies and softer asking-rent achievability than the comps imply.
- What's the recent tenant-quality profile in this submarket — average credit score on applications, eviction rate, late-payment / NSF rate, and stable-employment percentage? A property-management company in the area should have these aggregated.
- How much new for-sale + rental construction is in the pipeline within 1–3 miles? Heavy new supply typically softens prices + rents 12–24 months out; constrained supply supports both.
Investment metrics
- 1% rule
- 1.01% ✓
- Cap rate
- 7.57%
- Cash-on-cash
- 4.57%
- DSCR
- 1.20
- GRM
- 8.3
CMA / ARV
- ARV (median comp)
- $126,196
- List price
- $149,500
- Delta
- 18.47%
- Verdict
- OVERPRICED
- Comps
- 3 within 1.0 mi
Show comp detail 3 sales within ~0.75 mi
| Address | Dist | Beds/Ba | Sqft | Sold | Price | $/sf | Match |
|---|---|---|---|---|---|---|---|
| 20501 Shore Breeze Dr | 0.29mi | 3/2.0 | 1,568 (+15%) | 1mo | $175,000 | $112 | 61 |
| 21039 Woodland Ln | 0.48mi | 3/2.0 | 1,216 (-11%) | 10mo | $129,000 | $106 | 51 |
| 2957 Waterwood Dr | 0.46mi | 3/2.0 | 1,170 (-14%) | 8mo | $120,000 | $103 | 47 |
Match score weights: distance 35% · size 25% · config 20% · recency 20%. Top-matched comps best support the ARV.
Projected returns pro-forma
-3.0% appreciation · 3.0% rent growth · sell at horizon
- IRR
- -9.2%
- Equity multiple
- 0.66×
- Total profit
- $-14,055
- Equity at exit
- $22,291
- IRR
- 0.3%
- Equity multiple
- 1.02×
- Total profit
- $921
- Equity at exit
- $12,926
Cash invested: $41,860 (down + closing). Projections, not guarantees.
Landlord ↔ Tenant lean methodology
- Overall (STATE)
- 87 Strongly Landlord-Friendly
- State Texas
- 87 Strongly Landlord-Friendly · R+5
- County
- — inherits STATE
- City
- — inherits STATE
ZIP-level market 75758
- Home prices YoY
- -27.6%
- Active inventory
- 228
- Price-to-rent
- 8.3×
Monthly cashflow live
- Estimated rent
- $1,509 medium interval (Pro) →
- Mortgage (P&I)
- −$784
- Tax est. 1.5%
- −$187 /mo · $2,242/yr
- Insurance
- −$62
- HOA
- −$0
- Vacancy / Maint / Mgmt
- −$317
- Net cashflow
- $159
Break-even live
Sensitivity live
| Price | -10% $263 | -5% $211 | +0% $159 | +5% $108 | +10% $56 |
|---|---|---|---|---|---|
| Rent | -10% $40 | -5% $100 | +0% $159 | +5% $219 | +10% $279 |
| Rate | -1.0pp $235 | -0.5pp $197 | base $159 | +0.5pp $121 | +1.0pp $81 |
UW: 25.0% down · 7.5% · 30yr · 1.5% tax · 5.0% vac · 8.0% maint · 8.0% mgmt
Financing live
Cash to close
- Down payment
- $37,375
- Closing costs
- $4,485
- Reserves months
- —
- Total cash needed
- —
Loan-product check · same deal, 3 products live
Conventional
25% down · 7.5% · 30yr
- Down + closing
- —
- Monthly P&I
- —
- Monthly cashflow
- —
- DSCR
- —
- Eligible?
- —
Personal DTI + credit; lowest rate.
DSCR
20% down · 8.5% · 30yr
- Down + closing
- —
- Monthly P&I
- —
- Monthly cashflow
- —
- DSCR
- —
- Eligible?
- —
No personal income docs; deal must DSCR.
Hard money
10% down · 12.0% · 12mo
- Down + closing
- —
- Monthly P&I
- —
- Monthly cashflow
- —
- DSCR
- —
- Eligible?
- —
Short-term bridge; refi at stabilization.
Listing history 21 events
-
2026-06-21days on market $149,500 Active 89 DOM
-
2026-06-19days on market $149,500 Active 87 DOM
-
2026-06-18days on market $149,500 Active 86 DOM
-
2026-06-17days on market $149,500 Active 85 DOM
-
2026-06-16days on market $149,500 Active 84 DOM
-
2026-06-15days on market $149,500 Active 83 DOM
-
2026-06-14days on market $149,500 Active 81 DOM
-
2026-06-13days on market $149,500 Active 80 DOM
-
2026-06-10days on market $149,500 Active 78 DOM
-
2026-06-09days on market $149,500 Active 77 DOM
-
2026-06-08days on market $149,500 Active 76 DOM
-
2026-06-07days on market $149,500 Active 75 DOM
-
2026-06-02days on market $149,500 Active 70 DOM
-
2026-06-01days on market $149,500 Active 69 DOM
-
2026-05-31days on market $149,500 Active 68 DOM
-
2026-05-30days on market $149,500 Active 67 DOM
-
2026-03-24$149,500 Active 804-char remark
Show marketing remark (804 chars)
This wonderful 3/2 mobile home located at the end of a quiet street off Hwy 315 in Chandler is now available! On approx. 0.35 acres, this property has plenty of room to keep your outdoor toys and Flat Creek Public Boat Ramp is less than 2 miles away! The home has been completely remodeled with an abundance of updates and is MOVE IN READY! Exterior features include fresh paint, new windows and doors, and a sturdy aluminum roof. The interior has been completed refreshed with neutral paint, new subflooring and flooring, new doors and fixtures! The kitchen has brand new cabinets along with all necessary appliances and the bathrooms have been completely redone. Plumbing updates include a new water heater and piping. This home is in tip top shape and just needs your decorations. Make it yours today!
-
2025-08-12status Active
-
2025-08-12price $155,000
-
2025-08-04historical
-
2025-02-04$160,000 Active
ⓘ Source: listings_history table (triggers on properties + properties_extension) + one-shot
backfill from property_details.listing_events for pre-trigger history.
Climate risk First Street
- Flood 1/10 Low FEMA zone X (unshaded) · 0% chance over 30 yrs
- Wildfire 3/10 Moderate
- Heat 7/10 Severe 7 d/yr ≥109°F today · 26 d/yr by 30 yrs out
- Wind 6/10 Major 67% chance of damaging wind over 30 yrs
- Air quality 1/10 Low 0 unhealthy d/yr today · 0 by 30 yrs out
Nearby sold comps map
Loading sold comps map…
Walkable amenities ~0.75 mi
Loading nearby amenities…
Taxation est. · year 1
- Rental income
- $18,114
- − Mortgage interest
- −$8,374
- − Property taxes
- −$2,242
- − Insurance
- −$748
- − Repairs & maintenance
- −$1,449
- − Management
- −$1,449
- − Depreciation
- −$4,349
- Taxable loss
- −$498
- Est. tax savings @ 24.0%
- +$119
- After-tax cash flow
- $2,031/yr
For passive investors: Depreciation is non-cash, so a rental often shows a tax loss while cash-flowing — sheltering income. Rental losses are passive: they offset passive income freely, and up to $25,000/yr can offset ordinary (W-2) income if you actively participate and your MAGI is under $100k (phasing out to $0 by $150k); unused losses carry forward. On sale, claimed depreciation is recaptured at up to 25%, and gains may owe capital-gains tax (a 1031 exchange can defer both). Figures are a year-1 estimate at your 24.0% rate — not tax advice; consult a CPA.
Condition & rehab AI · 12 photos
This move-in ready mobile home has been completely remodeled with new cabinets, appliances, flooring, and fixtures. The exterior has been refreshed with fresh paint and new windows and doors. The property is located on a quiet street with ample outdoor space and is close to a public boat ramp.
Value-add opportunities
- Both Landscaping and curb appeal improvements — Enhances curb appeal and could attract more buyers
- Both Add a small garden or flower bed near the front door — Improves curb appeal and adds aesthetic value
- Both Install a security system — Enhances safety and could attract more buyers
Renovation cost estimate screening
Value-add ROI direction
- Both Landscaping and curb appeal improvements — Enhances curb appeal and could attract more buyers ↑
- Both Add a small garden or flower bed near the front door — Improves curb appeal and adds aesthetic value ↑
- Both Install a security system — Enhances safety and could attract more buyers ↑
ⓘ Cost ranges are severity-bucket heuristics (US national rule-of-thumb). Get contractor quotes + a written scope before underwriting a rehab budget.
Schools (NCES district)
- District
- Brownsboro ISD
- NCES district ID
- 4811640
- Math proficiency
- 42% ▼ -5.00%
- Reading proficiency
- 46% ▬ 0.00%
- Median HH income
- $45,624
- Composite
- 37.38/100
- National rank
- #4429
- State rank
- #290 of 826 in TX
Livability — Sunrise Shores
No livability data for this city. (Only ~50 U.S. cities are tracked.)
Census & demographics
- Population (ZIP)
- 10,357
Population outlook (Henderson County) Hauer SSP2
- Today (2025)
- 80,471 people
- By 2030
- 80,608 · +0.2%
- By 2040
- 80,087 · -0.5%
- By 2050
- 78,208 · -2.8%
- By 2075
- 72,423 · -10.0%
- By 2100
- 61,012 · -24.2%
Race, ethnicity, and origin ACS 2023
- Neighborhood character
- Predominantly White (79%)
- Race & ethnicity
- White 79% Hispanic / Latino 16% Two or more races 9% Black 2%
- Hispanic origin (detail)
- Mexican 14%
- Common ancestry
- Slovak 3% Serbian 2% Romanian 1%
- Foreign-born
- 5% · Canada, Vietnam
- Languages at home
- 91% English-only · Spanish 8% Other Indo-European 1%
Political lean MEDSL · Henderson
- 2024 margin
- Solid R (+63.5) · D 18.0% · R 81.4%
- 2008→2024 swing
- -18.8pp toward R · 2008: -44.6pp · 2024: -63.5pp
- All cycles
- 2024: R+63.5 2020: R+60.2 2016: R+60.0 2012: R+54.8 2008: R+44.6
Not yet ingested
- Civics
- —
Market trends
- HPI YoY
- ▼ -73.16%
- Current HPI
- 192.0837
- Rent YoY
- —
- Metro
- —
- State GDP YoY
- ▲ 3.95%
- F500 in state
- 110
Industry mix (Fortune 500 HQ in TX)
| Industry | F500 HQs | Revenue |
|---|---|---|
| Energy | 16 | $1,198B |
|
||
| Technology | 5 | $198B |
|
||
| Engineering / Construction | 4 | $72B |
|
||
| Energy Services | 3 | $60B |
|
||
| Utilities | 3 | $41B |
|
||
| Healthcare | 2 | $330B |
|
||
Price history
-6.6% since first listed5 events — show timeline
- 2026-03-24 Listed $149,500 GTAR
- 2025-08-12 Relisted — GTAR
- 2025-08-12 Price Changed $155,000 GTAR
- 2025-08-04 Delisted — GTAR
- 2025-02-04 Listed $160,000 GTAR
Cash-flow waterfall
monthlySold comps — $/sqft
last 12 mo · ≤1 miLoading sold comps…