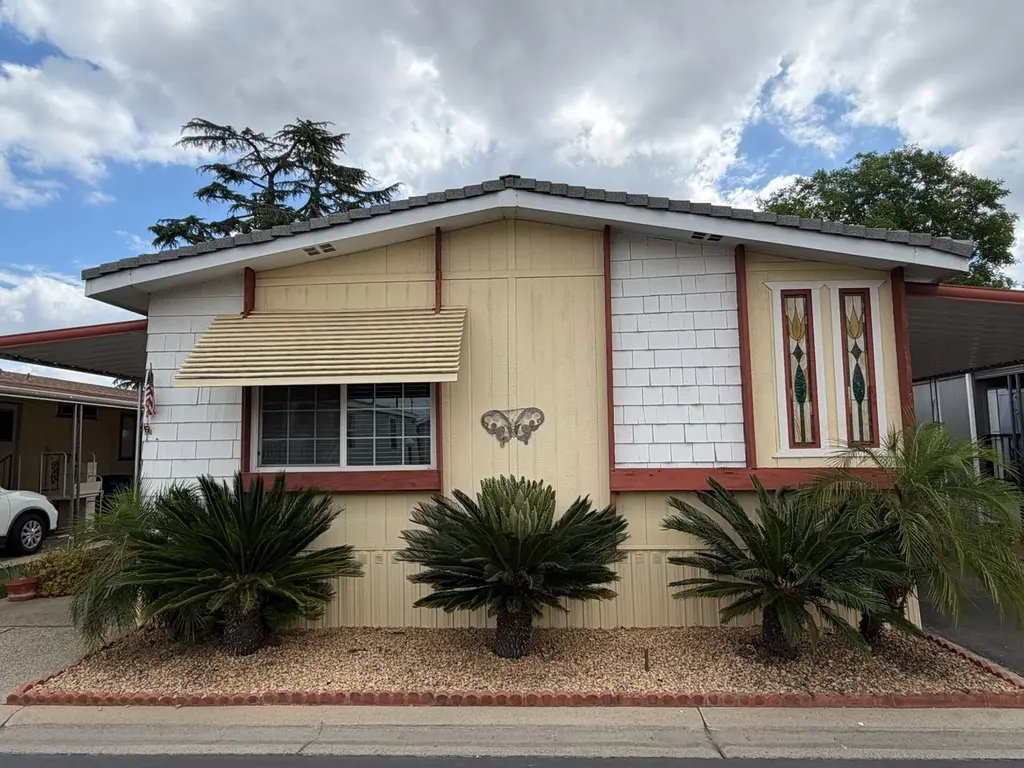
2706 W Ashlan Ave #306 · Fresno, CA
Flood risk 1/10 · Minimal
- FEMA flood zone
- X (unshaded)
- Chance of flooding over 30 yrs
- 0.0%
- Est. flood insurance / yr
- $507 – $1,088
Fire risk 1/10 · Minimal
- Est. fire insurance / yr
- $659 – $1,223
Heat risk 8/10 · Major
- Hot days now (above 105°F)
- 7 days/yr
- Hot days in 30 yrs
- 16 days/yr
Wind risk 1/10 · Minimal
- Chance of severe wind over 30 yrs
- —
Air-quality risk 10/10 · Severe
- Unhealthy air days now
- 48 days/yr
- Unhealthy air days in 30 yrs
- 50 days/yr
Risk factors via First Street. Map © Google.
Why this score? — see what drove the B grade
The composite is a weighted blend of 9 inputs, each scored 0–100. Each bar is that input's sub-score; the figure is the points it added to the 100-point composite (weight × sub-score).
- Cash flow +30.0/30.0
- ARV discount +10.4/15.0
- 1% rule +10.0/10.0
- DSCR +10.0/10.0
- Rent growth +3.8/5.0
- Livability +3.1/5.0
- Schools +2.7/10.0
- Condition / age +2.5/5.0
- Appreciation +0.0/10.0
$89,000
🖨 Deal sheet (PDF) 📄 Offer letter ✓ Due diligence
Listing remarks MLS
Tired of Fast Paced Living? Slow down in this peaceful and pristine gated community for 55 and over adults. You will enjoy this custom built mobile home with cathedral ceilings, dualpane windows, granite, newer central heat and air/14seers, fireplace, and a newer roof. Home is located in Westlake Park, a gated community which includes 2 clubhouses, pool tables, library, barbecue set up by 2 heated swimming pools, sauna, putting green, 2 Jacuzzi's, green belt, RV storage, a car wash and much more. So much for so little!
Key facts
- Spa
- Pool
- Indoor laundry
Tags
Property features AI
Finance
- HOA & community: Monthly association fees; Community amenities: pool, spa/hot tub, clubhouse, lake/pond, gated
Exterior
- Parking: Carport; Has carport
- Security: Gated community
- Utilities: Electric on; Public sewer; Public utilities
- Home design: Manufactured home; Dualwide mobile home; Park space rented
- Construction: Wood siding; Composition and metal roof; Wood subfloor foundation
- Exterior features: One level; Covered patio/porch; Shed(s); Urban setting; Private in-ground pool (fenced, community access); Community spa
Interior
- Kitchen: Built-in range/oven; Gas appliances; Dishwasher; Disposal; Refrigerator
- Flooring: Carpet; Laminate; Tile
- Bathrooms: 2 bathrooms; Tub/shower; Oval tub
- Heating & cooling: Central heat and central air
- Interior features: Bar; Double pane windows; Skylights
- Laundry & utility: Laundry inside
Neighborhood map
What this means for you Summary
Snapshot
- This is a 2-bed/2.0-bath manufactured listed at $89k.
Deal economics
- At list price, monthly cash flow is $855 ($10k/yr) — positive.
- The deal already cash-flows at list — no discount required.
- Meets the 1% rule at list price ($2k rent vs $89k).
- Cap rate 17.8% vs local median 3.7% in Fresno — top-decile yield for the area; either an underpriced asset or a hidden risk that comps aren't pricing in. Stress-test before assuming the spread holds.
Location & tenants
- Location reads 62/100 on livability (#469 in CA) — a middle-class / working-renter tenant base. Strengths: commute A+, housing A+; Watch: amenities D+, employment D+, crime F.
- Fresno Unified (urban): math 18% / reading 47% proficiency, ranked #327 of 517 in CA (top 63%) — families likely to look elsewhere, expect single-tenant / working-renter base with shorter leases; 77% free/reduced lunch — lower-income household profile, screen leases tightly.
- Zoned schools: Wilson Elementary (670 students, 97% FRL); Fort Miller Middle (623 students, 98% FRL); Fresno High (math 10% / reading 38%, grade F, #934 of 1,170 statewide, top 80%, 2,092 students, 90% FRL) — zoned schools average 95% FRL vs 77% district-wide (18 pts higher); higher-poverty schools than district average — tighter screening recommended.
- Market conditions: Rents rising fast (+5.2%/yr); 99 active listings in the ZIP; 24 comparable units currently listed for rent nearby; rentals at typical pace (median 25d on market — plan ~3-4 weeks tenant-placement turnaround); 2,426 units permitted in Fresno County in 2024 (296 in 5+ unit buildings).
- This rent runs 37% of the median local income ($57k/yr) — at the standard rent-burdened threshold; future hikes will face affordability resistance.
Forward outlook
- Local home prices are declining (-3.0%/yr); year-one equity from $615 of loan paydown is wiped out by about $3k of value loss. Plan a longer hold.
- Fresno County population projected at +11% by 2050 — modest demand growth; plan on rents tracking national, not racing it.
- At projected returns (-3.0% appreciation + 5.2% rent growth), your $25k cash investment doubles in ~3 years — after that, you're playing with house money.
Negotiation context
- Only 12 days on market — expect competitive offers; lowballing is unlikely to land.
- 3 sale attempts since 16y ago with the ask held roughly flat each time — persistent listings suggest the price (not the market) is what's stuck; bring a comps-based counter.
- Current owner paid $15k; list at $89k implies a 493% gain — meaningful room to come down on a strong offer.
Risks & watch-outs
- Climate carrying-cost: extreme-heat days projected 7→16/yr by 2055 (HVAC capex compounding) — expect insurance premiums to compound above CPI over the hold.
Questions for the listing agent
- Built in 1976 — when were the roof, HVAC, electrical panel, plumbing, and water heater last replaced?
- Is there a deadline driving the sale (1031 exchange, divorce, estate, relocation)? That informs how much negotiation room exists.
- Schools are D-rated, which usually means shorter tenancies and higher turnover. Who's the typical renter profile here, and what's been the actual vacancy rate?
- Crime grade is F in this area — have there been break-ins, vandalism, or insurance claims at this property in the last 3 years? What carrier currently insures it and at what premium?
- What's the average days-on-market for RENTAL listings here right now (not sales)? A rising rental-DOM trend means longer vacancies and softer asking-rent achievability than the comps imply.
- What's the recent tenant-quality profile in this submarket — average credit score on applications, eviction rate, late-payment / NSF rate, and stable-employment percentage? A property-management company in the area should have these aggregated.
- How much new for-sale + rental construction is in the pipeline within 1–3 miles? Heavy new supply typically softens prices + rents 12–24 months out; constrained supply supports both.
Investment metrics
- 1% rule
- 1.96% ✓
- Cap rate
- 17.82%
- Cash-on-cash
- 41.17%
- DSCR
- 2.83
- GRM
- 4.3
CMA / ARV
- ARV (on-the-fly)
- $95,040
- Comps found
- 12
Show comp detail 12 sales within ~0.75 mi
| Address | Dist | Beds/Ba | Sqft | Sold | Price | $/sf | Match |
|---|---|---|---|---|---|---|---|
| 2706 W Ashlan Ave #86 | 0.09mi | 2/2.0 | 1,440 (0%) | 4mo | $50,000 | $35 | 93 |
| 2706 W Ashlan Ave #11 | 0.06mi | 2/2.0 | 1,440 (0%) | 7mo | $98,000 | $68 | 92 |
| 2706 W Ashlan Ave #144 | 0.17mi | 2/2.0 | 1,440 (0%) | 0mo | $136,000 | $94 | 92 |
| 2706 W Ashlan Ave #46 | 0.17mi | 2/2.0 | 1,440 (0%) | 1mo | $89,000 | $62 | 91 |
| 2706 W Ashlan Ave #156 | 0.09mi | 3/2.0 (+1) | 1,440 (0%) | 0mo | $127,500 | $89 | 91 |
| 2706 W Ashlan Ave #266 | 0.17mi | 2/2.0 | 1,440 (0%) | 2mo | $124,900 | $87 | 90 |
| 2706 W Ashlan Ave #175 | 0.17mi | 2/2.0 | 1,436 (-0%) | 3mo | $94,900 | $66 | 89 |
| 2706 W Ashlan Ave #200 | 0.00mi | 3/2.0 (+1) | 1,440 (0%) | 7mo | $53,500 | $37 | 89 |
| 2706 W Ashlan Ave #158 | 0.09mi | 2/2.0 | 1,488 (+3%) | 6mo | $80,000 | $54 | 85 |
| 2706 W Ashlan Ave #281 | 0.17mi | 2/2.0 | 1,344 (-7%) | 1mo | $89,000 | $66 | 80 |
| 2706 W Ashlan Ave #299 | 0.22mi | 2/2.0 | 1,310 (-9%) | 1mo | $165,000 | $126 | 74 |
| 3138 W Dakota Ave #210 | 0.53mi | 3/2.0 (+1) | 1,344 (-7%) | 4mo | $42,500 | $32 | 55 |
Match score weights: distance 35% · size 25% · config 20% · recency 20%. Top-matched comps best support the ARV.
Projected returns pro-forma
-3.0% appreciation · 5.19% rent growth · sell at horizon
- IRR
- 40.0%
- Equity multiple
- 2.76×
- Total profit
- $43,922
- Equity at exit
- $13,270
- IRR
- 47.3%
- Equity multiple
- 6.02×
- Total profit
- $125,072
- Equity at exit
- $7,695
Cash invested: $24,920 (down + closing). Projections, not guarantees.
Landlord ↔ Tenant lean methodology
- Overall (STATE)
- 18 Strongly Tenant-Friendly
- State California
- 18 Strongly Tenant-Friendly · D+13
- County
- — inherits STATE
- City
- — inherits STATE
ZIP-level market 93705
- Rents YoY
- 5.2%
- Active inventory
- 99
- Price-to-rent
- 4.3×
Monthly cashflow live
- Estimated rent
- $1,742 high interval (Pro) →
- Mortgage (P&I)
- −$467
- Tax from tax record
- −$18 /mo · $213/yr
- Insurance
- −$37
- HOA
- −$0
- Vacancy / Maint / Mgmt
- −$366
- Net cashflow
- $855
Break-even live
Sensitivity live
| Price | -10% $905 | -5% $880 | +0% $855 | +5% $830 | +10% $805 |
|---|---|---|---|---|---|
| Rent | -10% $717 | -5% $786 | +0% $855 | +5% $924 | +10% $993 |
| Rate | -1.0pp $900 | -0.5pp $878 | base $855 | +0.5pp $832 | +1.0pp $808 |
UW: 25.0% down · 7.5% · 30yr · 1.5% tax · 5.0% vac · 8.0% maint · 8.0% mgmt
Financing live
Cash to close
- Down payment
- $22,250
- Closing costs
- $2,670
- Reserves months
- —
- Total cash needed
- —
Loan-product check · same deal, 3 products live
Conventional
25% down · 7.5% · 30yr
- Down + closing
- —
- Monthly P&I
- —
- Monthly cashflow
- —
- DSCR
- —
- Eligible?
- —
Personal DTI + credit; lowest rate.
DSCR
20% down · 8.5% · 30yr
- Down + closing
- —
- Monthly P&I
- —
- Monthly cashflow
- —
- DSCR
- —
- Eligible?
- —
No personal income docs; deal must DSCR.
Hard money
10% down · 12.0% · 12mo
- Down + closing
- —
- Monthly P&I
- —
- Monthly cashflow
- —
- DSCR
- —
- Eligible?
- —
Short-term bridge; refi at stabilization.
Rent comps 24 comps
| Address | Beds | Baths | Sqft | Rent | $/sqft | DOM | Units | Dist |
|---|---|---|---|---|---|---|---|---|
| 4184 N Briarwood Ave Fresno, CA | 3.0 | 2.0 | 1628 | $2,195 | $1.35 | 45d | 1 | 0.16mi |
| 3274 W Ashlan Ave Fresno, CA | 2.0 | 1.0 | 975 | $1,535 | $1.57 | 3d | 5 | 0.44mi |
| 4144 N Valentine Ave Unit 60-147 Fresno, CA | 2.0 | 1.0 | 960 | $1,695 | $1.77 | 21d | 1 | 0.62mi |
| 4144 N Valentine Ave Unit 84-118 Fresno, CA | 2.0 | 1.0 | 960 | $1,695 | $1.77 | 45d | 1 | 0.62mi |
| 4144 N Valentine Ave Unit 60-158 Fresno, CA | 2.0 | 1.0 | 960 | $1,695 | $1.77 | 24d | 1 | 0.62mi |
| 4144 N Valentine Ave Fresno, CA | 2.0 | 1.0 | 960 | $1,450 | $1.51 | 17d | 1 | 0.62mi |
| 3058 W San Gabriel Ave Fresno, CA | 3.0 | 2.0 | 1284 | $2,450 | $1.91 | 45d | 1 | 0.64mi |
| 4264 N Bengston Ave Unit 101 Fresno, CA | 2.0 | 1.0 | 950 | $1,450 | $1.53 | 45d | 1 | 0.66mi |
| 1668 W Ashlan Ave Fresno, CA | 2.0 | 1.0 | 877 | $1,185 | $1.35 | 24d | 1 | 0.66mi |
| 4597 N Emerson Ave Apt 103 Fresno, CA | 2.0 | 2.0 | 1100 | $1,700 | $1.55 | 24d | 1 | 0.80mi |
| 4942 N Holt Ave #103 Fresno, CA | 2.0 | 1.0 | 1000 | $1,395 | $1.40 | 24d | 1 | 0.85mi |
| 4467 N Van Dyke Ave Fresno, CA | 3.0 | 2.0 | 1292 | $2,195 | $1.70 | 4d | 1 | 0.95mi |
| 1493 W Fairmont Ave Unit A Fresno, CA | 2.0 | 2.0 | 1050 | $1,595 | $1.52 | 24d | 1 | 1.09mi |
| 3207 W Shields Ave Fresno, CA | 1.0–3.0 | 1.0–2.0 | 959 | $1,468 | $1.53 | 2d | 3 | 1.21mi |
| 941 W Dakota Ave Fresno, CA | 3.0 | 2.0 | 960 | $1,895 | $1.97 | 11d | 2 | 1.23mi |
| 3326 N West Ave Fresno, CA | 2.0 | 1.0 | 950 | $1,225 | $1.29 | 22d | 1 | 1.32mi |
| 3515 W San Jose Ave Unit 8106 Fresno, CA | 3.0 | 2.5 | 1215 | $1,925 | $1.58 | 24d | 1 | 1.33mi |
| 3515 W San Jose Ave Unit 15-202 Fresno, CA | 2.0 | 2.0 | 915 | $1,550 | $1.69 | 17d | 1 | 1.33mi |
| 3515 W San Jose Ave Unit 9105 Fresno, CA | 2.0 | 2.5 | 1115 | $1,725 | $1.55 | 45d | 1 | 1.33mi |
| 1212 W Andrews Ave Fresno, CA | 2.0 | 1.0 | 950 | $1,300 | $1.37 | 17d | 1 | 1.36mi |
| 1696 W Shaw Ave Unit AVE-104 Fresno, CA | 3.0 | 2.0 | 1100 | $1,700 | $1.55 | 4d | 1 | 1.38mi |
| 5066-5098 N Marty Ave Fresno, CA | 2.0 | 1.0–2.0 | 961 | $1,750 | $1.82 | 21d | 1 | 1.38mi |
| 5355 N Valentine Ave Fresno, CA | 2.0–3.0 | 1.5–2.5 | 1318 | $2,021 | $1.53 | 17d | 1 | 1.47mi |
| 3681 N Fruit Ave Unit C Fresno, CA | 2.0 | 2.0 | 1224 | $1,500 | $1.23 | 24d | 1 | 1.50mi |
Listing history 10 events
-
2026-06-18status $89,000 Pending 12 DOM
-
2026-06-17days on market $89,000 Active 12 DOM
-
2026-06-16days on market $89,000 Active 11 DOM
-
2026-06-15days on market $89,000 Active 10 DOM
-
2026-06-13days on market $89,000 Active 8 DOM
-
2026-06-10days on market $89,000 Active 5 DOM
-
2026-06-09days on market $89,000 Active 4 DOM
-
2026-06-08days on market $89,000 Active 3 DOM
-
2026-06-07remarks 617-char remark
-
2026-06-07$89,000 Active 2 DOM
ⓘ Source: listings_history table (triggers on properties + properties_extension) + one-shot
backfill from property_details.listing_events for pre-trigger history.
Tax reassessment forecast CA · Resets to sale price
- Current annual tax
- $213 · $18/mo
- Projected year-2 tax
- $676 · $56/mo
- Expected delta
- +$463/yr (+$39/mo · 217.6%)
ⓘ Screening estimate from a state-policy table — verify with the county assessor before closing.
Climate risk First Street
- Flood 1/10 Low FEMA zone X (unshaded) · 0% chance over 30 yrs
- Wildfire 1/10 Low
- Heat 8/10 Severe 7 d/yr ≥105°F today · 16 d/yr by 30 yrs out
- Wind 1/10 Low
- Air quality 10/10 Extreme 48 unhealthy d/yr today · 50 by 30 yrs out
Nearby sold comps map
Loading sold comps map…
Walkable amenities ~0.75 mi
Loading nearby amenities…
Taxation est. · year 1
- Rental income
- $20,909
- − Mortgage interest
- −$4,985
- − Property taxes
- −$213
- − Insurance
- −$445
- − Repairs & maintenance
- −$1,673
- − Management
- −$1,673
- − Depreciation
- −$2,589
- Taxable income
- $9,331
- Est. tax owed @ 24.0%
- −$2,239
- After-tax cash flow
- $8,020/yr
For passive investors: Depreciation is non-cash, so a rental often shows a tax loss while cash-flowing — sheltering income. Rental losses are passive: they offset passive income freely, and up to $25,000/yr can offset ordinary (W-2) income if you actively participate and your MAGI is under $100k (phasing out to $0 by $150k); unused losses carry forward. On sale, claimed depreciation is recaptured at up to 25%, and gains may owe capital-gains tax (a 1031 exchange can defer both). Figures are a year-1 estimate at your 24.0% rate — not tax advice; consult a CPA.
Schools (NCES district)
- District
- Fresno Unified
- NCES district ID
- 0614550
- Math proficiency
- 18% ▼ -12.00%
- Reading proficiency
- 47% ▲ 9.00%
- Median HH income
- $36,095
- Composite
- 26.83/100
- National rank
- #7111
- State rank
- #327 of 517 in CA
Livability — Fresno
- Score
- 62/100
- State rank
- #469
- US rank
- #15907
Category grades
Schools grade is shown separately in the Schools card above.
Census & demographics
- Census place
- Fresno, CA
- County
- Fresno County · 834,801 people
- City population
- 593,114
- Metro
- Fresno, CA
- Population (ZIP)
- 38,888
- Household income
- $57,003
- Rent vs Own
- Severe rent burden
- 2217.0
Population outlook (Fresno County) Hauer SSP2
- Today (2025)
- 1,042,971 people
- By 2030
- 1,072,198 · +2.8%
- By 2040
- 1,122,408 · +7.6%
- By 2050
- 1,157,251 · +11.0%
- By 2075
- 1,182,575 · +13.4%
- By 2100
- 1,105,899 · +6.0%
Race, ethnicity, and origin ACS 2023
- Neighborhood character
- Diverse neighborhood (Simpson 0.56)
- Race & ethnicity
- Hispanic / Latino 62% Two or more races 34% White 22% Black 6% Asian 6% Native American 2%
- Hispanic origin (detail)
- Mexican 60%
- Common ancestry
- Lithuanian 1% Iranian 1% Russian 1%
- Foreign-born
- 13% · Canada, China
- Languages at home
- 61% English-only · Spanish 34% Other Asian/Pacific 2% Other Indo-European 1%
Political lean MEDSL · Fresno
- 2024 margin
- Toss-up / Even · D 46.5% · R 50.9% · Other 2.6%
- 2008→2024 swing
- -6.5pp toward R · 2008: 2.1pp · 2024: -4.4pp
- All cycles
- 2024: R+4.4 2020: D+7.8 2016: D+3.9 2012: R+2.9 2008: D+2.1
Not yet ingested
- Civics
- —
Market trends
- HPI YoY
- ▼ -331.23%
- Current HPI
- 399.0061
- Rent YoY
- ▲ 5.19%
- Metro
- Fresno, CA
- State GDP YoY
- ▲ 3.21%
- F500 in state
- 116
Industry mix (Fortune 500 HQ in CA)
| Industry | F500 HQs | Revenue |
|---|---|---|
| Technology | 27 | $1,492B |
|
||
| Financial Services | 3 | $174B |
|
||
| Retail | 3 | $44B |
|
||
| Insurance | 3 | $26B |
|
||
| Media / Entertainment | 2 | $115B |
|
||
| Pharmaceuticals / Biotech | 2 | $62B |
|
||
Price history
+493.3% since first listed7 events — show timeline
- 2026-06-04 Listed $89,000 FRESNOMLS
- 2012-07-06 Delisted — FRESNOMLS
- 2012-03-15 Listed $22,000 FRESNOMLS
- 2011-04-22 Sold (MLS) $15,000 FRESNOMLS
- 2011-03-31 Delisted — FRESNOMLS
- 2011-03-31 Price Changed $19,900 FRESNOMLS
- 2010-12-20 Listed $15,000 FRESNOMLS
Cash-flow waterfall
monthlySold comps — $/sqft
last 12 mo · ≤1 miLoading sold comps…