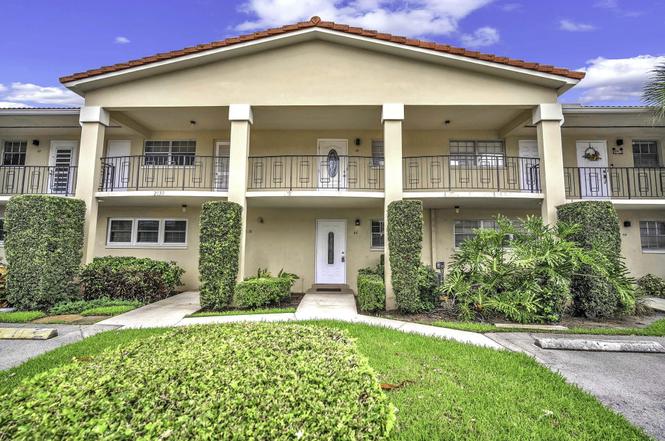
2130 NE 36th St #63 · Lighthouse Point, FL
Flood risk 5/10 · Moderate
- FEMA flood zone
- X (shaded)
- Chance of flooding over 30 yrs
- 0.36%
- Est. flood insurance / yr
- $507 – $1,088
Fire risk 1/10 · Minimal
- Est. fire insurance / yr
- $947 – $1,759
Heat risk 10/10 · Severe
- Hot days now (above 106°F)
- 7 days/yr
- Hot days in 30 yrs
- 26 days/yr
Wind risk 10/10 · Severe
- Chance of severe wind over 30 yrs
- 99.0%
Air-quality risk 2/10 · Minimal
- Unhealthy air days now
- 1 days/yr
- Unhealthy air days in 30 yrs
- 3 days/yr
Risk factors via First Street. Map © Google.
Why this score? — see what drove the B- grade
The composite is a weighted blend of 9 inputs, each scored 0–100. Each bar is that input's sub-score; the figure is the points it added to the 100-point composite (weight × sub-score).
- Cash flow +27.6/30.0
- 1% rule +10.0/10.0
- DSCR +9.7/10.0
- ARV discount +7.5/15.0
- Schools +4.1/10.0
- Livability +3.6/5.0
- Rent growth +2.9/5.0
- Condition / age +2.5/5.0
- Appreciation +0.0/10.0
$114,900
🖨 Deal sheet (PDF) 📄 Offer letter ✓ Due diligence
Listing remarks
Lovely ground-floor 1-bedroom, 1.5-bath condo in desirable Lighthouse Point! This unit features updated flooring and a newly installed hurricane-impact sliding door leading to a private screened patio—perfect for enjoying South Florida's year-round lifestyle. Enjoy the convenience of assigned parking just steps from your front door. The community offers a beautifully maintained pool and on-site laundry facilities. Ideally located near shopping, dining, parks, and the library, with easy access to the beach, marinas, and all that Lighthouse Point has to offer. A perfect full-time residence or seasonal getaway in one of Broward County's most sought-after coastal communities.
Key facts
- Assigned parking
- $384 HOA
- Community pool
Tags
Property features AI
Finance
- HOA & community: Monthly HOA fee; HOA amenities include pool and laundry; HOA fee covers insurance, water, sewer, trash and common areas
Exterior
- Parking: Assigned parking
- Utilities: Association provides water, sewer and trash (included in HOA); No additional utilities listed
- Home design: Condominium; Two-story building; Unit faces north; Resale condition
- Construction: CBS construction
- Exterior features: Not waterfront
Interior
- Kitchen: Electric range; Microwave; Refrigerator
- Bedrooms: One main-level bedroom
- Flooring: Carpet; Ceramic tile
- Bathrooms: One full bathroom; One half bathroom
- Heating & cooling: Central heating; Central air conditioning
- Interior features: No notable built-in interior features; Unfurnished
- Laundry & utility: On-site laundry in the association
Neighborhood map
What this means for you Summary
Snapshot
- This is a 1-bed/2.0-bath condo listed at $115k.
Deal economics
- At list price, monthly cash flow is $345 ($4k/yr) — positive.
- The deal already cash-flows at list — no discount required.
- Meets the 1% rule at list price ($2k rent vs $115k).
- Recommended offer: $101k (12.0% below list) — sets the bar for market timing.
- Cap rate 9.9% vs local median 2.4% in Lighthouse Point — top-decile yield for the area; either an underpriced asset or a hidden risk that comps aren't pricing in. Stress-test before assuming the spread holds.
Location & tenants
- Location reads 71/100 on livability (#384 in FL) — a middle-class / working-renter tenant base. Strengths: crime A+, employment A+, health & safety A+; Watch: amenities F, commute F, cost of living F.
- Broward (suburban): math 42% / reading 53% proficiency, ranked #46 of 73 in FL (top 63%) — families likely to look elsewhere, expect single-tenant / working-renter base with shorter leases.
- Zoned schools: Nova Blanche Forman Elementary (math 35% / reading 55%, grade D-, #1,271 of 2,144 statewide, top 60%, 769 students, 72% FRL); Nova Middle School (math 44% / reading 53%, grade C-, #274 of 571 statewide, top 50%, 1,284 students, 68% FRL); Deerfield Beach High School (math 12% / reading 37%, grade F, #505 of 667 statewide, top 79%, 2,251 students, 69% FRL) — zoned schools average 69% FRL vs 51% district-wide (18 pts higher); higher-poverty schools than district average — tighter screening recommended.
- Market conditions: Rents rising (+1.8%/yr); 595 active listings in the ZIP; 40 comparable units currently listed for rent nearby; rentals at typical pace (median 26d on market — plan ~3-4 weeks tenant-placement turnaround); 2,111 units permitted in Broward County in 2024 (1,265 in 5+ unit buildings).
- This rent runs 34% of the median local income ($71k/yr) — at the standard rent-burdened threshold; future hikes will face affordability resistance.
Forward outlook
- Local home prices are declining (-3.0%/yr); year-one equity from $794 of loan paydown is wiped out by about $3k of value loss. Plan a longer hold.
- Broward County population projected at +34% by 2050 — long-run rental-demand tailwind backs the buy-and-hold thesis.
Negotiation context
- It's been on market 339 days — a 12% lower offer ($101k) is reasonable based on typical stale-listing flexibility.
Risks & watch-outs
- Climate carrying-cost: moderate flood risk; severe wind risk, 99% chance of damaging wind over 30y; extreme-heat days projected 7→26/yr by 2055 (HVAC capex compounding) — expect insurance premiums to compound above CPI over the hold.
Questions for the listing agent
- It's been on market 339 days. Have you received any prior offers? Is the seller open to a 12% concession, seller financing, or rate buy-down credit?
- Built in 1965 — when were the roof, HVAC, electrical panel, plumbing, and water heater last replaced?
- What does the HOA fee cover, when was the last increase, and are there any pending special assessments or reserve-fund shortfalls?
- Any open or pending special assessments — roof, HVAC, plumbing, elevator, façade? What's the per-unit balance and payoff schedule, and is the seller paying it off at close or rolling it to the buyer?
- Why hasn't it sold? Are there any deal-killer items the seller is aware of (foundation, flood, title, zoning, code violations)?
- Is there a deadline driving the sale (1031 exchange, divorce, estate, relocation)? That informs how much negotiation room exists.
- What's the average days-on-market for RENTAL listings here right now (not sales)? A rising rental-DOM trend means longer vacancies and softer asking-rent achievability than the comps imply.
- What's the recent tenant-quality profile in this submarket — average credit score on applications, eviction rate, late-payment / NSF rate, and stable-employment percentage? A property-management company in the area should have these aggregated.
- How much new apartment / multifamily construction is in the pipeline within 1–3 miles? Heavy new supply (>2% of stock underway) typically softens rents 12–24 months out; light construction supports rent growth.
Investment metrics
- 1% rule
- 1.78% ✓
- Cap rate
- 9.90%
- Cash-on-cash
- 12.87%
- DSCR
- 1.57
- GRM
- 4.7
CMA / ARV
No comps found within radius.
Projected returns pro-forma
-3.0% appreciation · 1.75% rent growth · sell at horizon
- IRR
- 0.9%
- Equity multiple
- 1.04×
- Total profit
- $1,134
- Equity at exit
- $17,132
- IRR
- 8.9%
- Equity multiple
- 1.64×
- Total profit
- $20,432
- Equity at exit
- $9,934
Cash invested: $32,172 (down + closing). Projections, not guarantees.
Landlord ↔ Tenant lean methodology
- Overall (STATE)
- 87 Strongly Landlord-Friendly
- State Florida
- 87 Strongly Landlord-Friendly · R+3
- County
- — inherits STATE
- City
- — inherits STATE
ZIP-level market 33064
- Home prices YoY
- -18.7%
- Rents YoY
- 1.8%
- Active inventory
- 595
- Price-to-rent
- 4.7×
Monthly cashflow live
- Estimated rent
- $2,043 high interval (Pro) →
- Mortgage (P&I)
- −$603
- Tax from tax record
- −$234 /mo · $2,812/yr
- Insurance
- −$48
- HOA
- −$384
- Vacancy / Maint / Mgmt
- −$429
- Net cashflow
- $345
Break-even live
Sensitivity live
| Price | -10% $410 | -5% $377 | +0% $345 | +5% $312 | +10% $280 |
|---|---|---|---|---|---|
| Rent | -10% $184 | -5% $264 | +0% $345 | +5% $426 | +10% $506 |
| Rate | -1.0pp $403 | -0.5pp $374 | base $345 | +0.5pp $315 | +1.0pp $285 |
UW: 25.0% down · 7.5% · 30yr · 1.5% tax · 5.0% vac · 8.0% maint · 8.0% mgmt
Financing live
Cash to close
- Down payment
- $28,725
- Closing costs
- $3,447
- Reserves months
- —
- Total cash needed
- —
Loan-product check · same deal, 3 products live
Conventional
25% down · 7.5% · 30yr
- Down + closing
- —
- Monthly P&I
- —
- Monthly cashflow
- —
- DSCR
- —
- Eligible?
- —
Personal DTI + credit; lowest rate.
DSCR
20% down · 8.5% · 30yr
- Down + closing
- —
- Monthly P&I
- —
- Monthly cashflow
- —
- DSCR
- —
- Eligible?
- —
No personal income docs; deal must DSCR.
Hard money
10% down · 12.0% · 12mo
- Down + closing
- —
- Monthly P&I
- —
- Monthly cashflow
- —
- DSCR
- —
- Eligible?
- —
Short-term bridge; refi at stabilization.
Rent comps 40 comps
| Address | Beds | Baths | Sqft | Rent | $/sqft | DOM | Units | Dist |
|---|---|---|---|---|---|---|---|---|
| 2121 NE 36th Ct Lighthouse Point, FL | 1.0 | 1.0 | 800 | $1,975 | $2.47 | 13d | 1 | 0.09mi |
| 2121 NE 36th Ct Lighthouse Point, FL | 1.0 | 1.0 | 800 | $1,975 | $2.47 | 25d | 1 | 0.09mi |
| 3700 NE 22nd Ave Unit 3720-11 Lighthouse Point, FL | 1.0 | 1.0 | 650 | $1,825 | $2.81 | 25d | 1 | 0.11mi |
| 3850 NE 21st Way #53 Lighthouse Point, FL | 2.0 | 2.0 | 780 | $1,900 | $2.44 | 25d | 1 | 0.25mi |
| 1671 NE 33rd St Unit 3 Pompano Beach, FL | 2.0 | 2.0 | 750 | $2,200 | $2.93 | 25d | 1 | 0.42mi |
| 1671 NE 33rd St Apt 1 Pompano Beach, FL | 1.0 | 1.0 | 750 | $1,650 | $2.20 | 25d | 1 | 0.42mi |
| 2120 NE 41st St Unit C Lighthouse Point, FL | 1.0 | 1.0 | 650 | $1,675 | $2.58 | 25d | 1 | 0.44mi |
| 3837 NE 17th Ave Pompano Beach, FL | 1.0 | 1.0 | 800 | $2,100 | $2.62 | 12d | 1 | 0.45mi |
| 1751 NE 31st St Pompano Beach, FL | 1.0 | 1.0 | 642 | $1,595 | $2.48 | 16d | 1 | 0.50mi |
| 1530 NE 33rd St Unit 1530 Pompano Beach, FL | 2.0 | 1.0 | 893 | $2,100 | $2.35 | 25d | 1 | 0.55mi |
| 1901 NE 29th St #2 Lighthouse Point, FL | 1.0 | 1.0 | 700 | $1,600 | $2.29 | 25d | 1 | 0.56mi |
| 1510 NE 32nd Pl Pompano Beach, FL | 2.0 | 1.0 | 893 | $2,650 | $2.97 | 25d | 1 | 0.59mi |
| 2900 NE 17th Ave Pompano Beach, FL | 1.0 | 1.0 | 650 | $1,745 | $2.68 | 13d | 1 | 0.59mi |
| 1480 E Sample Rd #207 Pompano Beach, FL | 1.0 | 1.0 | 640 | $1,600 | $2.50 | 25d | 1 | 0.60mi |
| 1480 E Sample Rd Pompano Beach, FL | 1.0 | 1.0 | 640 | $1,550 | $2.42 | 16d | 2 | 0.60mi |
| 2121 NE 42nd Ct Unit 103C Lighthouse Point, FL | 2.0 | 2.0 | 960 | $1,795 | $1.87 | 25d | 1 | 0.63mi |
| 2115 NE 42nd Ct Unit 206N Lighthouse Point, FL | 1.0 | 1.0 | 560 | $1,600 | $2.86 | 25d | 1 | 0.66mi |
| 1911 NE 27th Ct Unit 3 Lighthouse Point, FL | 2.0 | 1.0 | 900 | $2,000 | $2.22 | 25d | 1 | 0.69mi |
| 2731 NE 28th Ct Unit 3 Lighthouse Point, FL | 2.0 | 2.0 | 1000 | $3,200 | $3.20 | 25d | 1 | 0.70mi |
| 4411 N Federal Hwy Pompano Beach, FL | 1.0–3.0 | 1.0–2.0 | 1039 | $1,926 | $1.85 | 0d | 20 | 0.75mi |
| 4350 NE 18th Ave Pompano Beach, FL | 2.0 | 1.0 | 920 | $2,500 | $2.72 | 18d | 1 | 0.80mi |
| 4500 N Federal Hwy Unit 316B Lighthouse Point, FL | 2.0 | 2.0 | 984 | $1,950 | $1.98 | 25d | 1 | 0.81mi |
| 4502 N Federal Hwy Unit 167H Lighthouse Point, FL | 2.0 | 2.0 | 984 | $2,800 | $2.85 | 12d | 1 | 0.83mi |
| 4502 N Federal Hwy Unit 336D Lighthouse Point, FL | 2.0 | 2.0 | 984 | $2,830 | $2.88 | 25d | 1 | 0.83mi |
| 1512 NE 28th St Pompano Beach, FL | 2.0 | 1.0 | 624 | $2,500 | $4.01 | 25d | 1 | 0.83mi |
| 2755 NE 28th Ave Unit C1 Lighthouse Point, FL | 2.0 | 2.0 | 890 | $2,690 | $3.02 | 6d | 1 | 0.84mi |
| 1150 E Sample Rd #202 Pompano Beach, FL | 1.0 | 1.0 | 640 | $1,650 | $2.58 | 25d | 1 | 0.85mi |
| 1035 Hillsboro Mile #31 Hillsboro Beach, FL | 2.0 | 2.0 | 850 | $6,500 | $7.65 | 25d | 1 | 0.88mi |
| 2748 NE 28th Ave #2 Lighthouse Point, FL | 2.0 | 2.0 | 850 | $2,550 | $3.00 | 25d | 1 | 0.88mi |
| 1433 NE 27th St Pompano Beach, FL | 2.0 | 1.0 | 816 | $2,900 | $3.55 | 25d | 1 | 0.90mi |
| 2757 NE 29th Ave #4 Lighthouse Point, FL | 2.0 | 2.0 | 1100 | $2,800 | $2.55 | 14d | 1 | 0.90mi |
| 2933 NE 12th Ter Pompano Beach, FL | 2.0 | 1.0 | 824 | $2,700 | $3.28 | 25d | 1 | 0.92mi |
| 4611 N Federal Hwy Pompano Beach, FL | 1.0–3.0 | 1.0–2.0 | 969 | $2,260 | $2.33 | 0d | 8 | 0.93mi |
| 3300 NE 10th Ter Pompano Beach, FL | 1.0 | 1.0 | 674 | $1,525 | $2.26 | 16d | 1 | 0.94mi |
| 3180 NE 10th Ter Pompano Beach, FL | 2.0 | 1.0 | 991 | $2,700 | $2.72 | 25d | 1 | 0.94mi |
| 1051 Hillsboro Mile Unit 407E Hillsboro Beach, FL | 2.0 | 2.0 | 1000 | $4,950 | $4.95 | 16d | 1 | 0.97mi |
| 1051 Hillsboro Mile Unit 507E Hillsboro Beach, FL | 2.0 | 2.0 | 1000 | $2,900 | $2.90 | 25d | 1 | 0.97mi |
| 2797 NE 12th Ave Pompano Beach, FL | 2.0 | 1.0 | 817 | $2,740 | $3.35 | 9d | 1 | 1.01mi |
| 1960 NE 48th St Unit 9 Pompano Beach, FL | 1.0 | 1.0 | 700 | $1,500 | $2.14 | 23d | 1 | 1.04mi |
| 1069 Hillsboro Mile #507 Hillsboro Beach, FL | 2.0 | 2.0 | 1026 | $3,100 | $3.02 | 25d | 1 | 1.04mi |
HOA detail condo
- Monthly dues
- $384 · $4,608/yr
- Likely covers
- poolparking
- Assessments
- None detected in remarks — confirm with the listing agent.
Listing history 17 events
-
2026-06-21days on market $114,900 Active 339 DOM
-
2026-06-18days on market $114,900 Active 336 DOM
-
2026-06-17days on market $114,900 Active 335 DOM
-
2026-06-16days on market $114,900 Active 334 DOM
-
2026-06-15days on market $114,900 Active 333 DOM
-
2026-06-13days on market $114,900 Active 331 DOM
-
2026-06-09days on market $114,900 Active 327 DOM
-
2026-06-07remarks 680-char remark
-
2026-06-07pricedays on market $114,900 Active 325 DOM
-
2026-06-04days on market $119,900 Active 322 DOM
-
2026-06-03days on market $119,900 Active 321 DOM
-
2026-06-02days on market $119,900 Active 320 DOM
-
2026-06-01days on market $119,900 Active 319 DOM
-
2026-05-31days on market $119,900 Active 318 DOM
-
2026-04-01price $119,900
-
2025-10-23price $129,999
-
2025-07-17$135,000 Active
ⓘ Source: listings_history table (triggers on properties + properties_extension) + one-shot
backfill from property_details.listing_events for pre-trigger history.
Tax reassessment forecast FL · Resets to sale price
- Current annual tax
- $2,812 · $234/mo
- Projected year-2 tax
- $2,812 · $234/mo
- Expected delta
- $0/yr ($0/mo · 0.0%)
ⓘ Screening estimate from a state-policy table — verify with the county assessor before closing.
Climate risk First Street
- Flood 5/10 Major FEMA zone X (shaded) · 36% chance over 30 yrs
- Wildfire 1/10 Low
- Heat 10/10 Extreme 7 d/yr ≥106°F today · 26 d/yr by 30 yrs out
- Wind 10/10 Extreme 99% chance of damaging wind over 30 yrs
- Air quality 2/10 Low 1 unhealthy d/yr today · 3 by 30 yrs out
Nearby sold comps map
Loading sold comps map…
Walkable amenities ~0.75 mi
Loading nearby amenities…
Taxation est. · year 1
- Rental income
- $24,512
- − Mortgage interest
- −$6,436
- − Property taxes
- −$2,812
- − Insurance
- −$574
- − Repairs & maintenance
- −$1,961
- − Management
- −$1,961
- − HOA
- −$4,608
- − Depreciation
- −$3,343
- Taxable income
- $2,816
- Est. tax owed @ 24.0%
- −$676
- After-tax cash flow
- $3,463/yr
For passive investors: Depreciation is non-cash, so a rental often shows a tax loss while cash-flowing — sheltering income. Rental losses are passive: they offset passive income freely, and up to $25,000/yr can offset ordinary (W-2) income if you actively participate and your MAGI is under $100k (phasing out to $0 by $150k); unused losses carry forward. On sale, claimed depreciation is recaptured at up to 25%, and gains may owe capital-gains tax (a 1031 exchange can defer both). Figures are a year-1 estimate at your 24.0% rate — not tax advice; consult a CPA.
Schools (NCES district)
- District
- Broward
- NCES district ID
- 1200180
- Math proficiency
- 42% ▼ -18.00%
- Reading proficiency
- 53% ▼ -5.00%
- Median HH income
- $52,139
- Composite
- 40.88/100
- National rank
- #3621
- State rank
- #46 of 73 in FL
Livability — Lighthouse Point
- Score
- 71/100
- State rank
- #384
- US rank
- #6803
Category grades
Schools grade is shown separately in the Schools card above.
Census & demographics
- Census place
- Lighthouse Point, FL
- County
- Broward County · 1,963,430 people
- Metro
- Miami-Fort Lauderdale-Pompano Beach, FL
- Population (ZIP)
- 64,563
- Household income
- $71,301
- Rent vs Own
- Severe rent burden
- 2907.0
Population outlook (Broward County) Hauer SSP2
- Today (2025)
- 2,207,033 people
- By 2030
- 2,360,704 · +7.0%
- By 2040
- 2,661,208 · +20.6%
- By 2050
- 2,946,698 · +33.5%
- By 2075
- 3,602,273 · +63.2%
- By 2100
- 3,970,984 · +79.9%
Race, ethnicity, and origin ACS 2023
- Neighborhood character
- Highly diverse neighborhood (Simpson 0.75)
- Race & ethnicity
- White 34% Hispanic / Latino 27% Black 25% Two or more races 24% Asian 2%
- Hispanic origin (detail)
- Mexican 4% Puerto Rican 4% Cuban 4% Dominican 2%
- Common ancestry
- Hispanic 13% Estonian 10% Romanian 1%
- Foreign-born
- 43% · Canada, Jamaica, Dominican Republic
- Languages at home
- 45% English-only · Spanish 23% French/Haitian/Cajun 16% Other Indo-European 13%
Political lean MEDSL · Broward
- 2024 margin
- D (+17.0) · D 58.0% · R 41.0%
- 2008→2024 swing
- -17.8pp toward R · 2008: 34.7pp · 2024: 17.0pp
- All cycles
- 2024: D+17.0 2020: D+29.8 2016: D+35.0 2012: D+34.9 2008: D+34.7
Not yet ingested
- Civics
- —
Market trends
- HPI YoY
- ▼ -109.09%
- Current HPI
- 474.7007
- Rent YoY
- ▲ 1.75%
- Metro
- Miami-Fort Lauderdale-Pompano Beach, FL
- State GDP YoY
- ▲ 3.28%
- F500 in state
- 36
Industry mix (Fortune 500 HQ in FL)
| Industry | F500 HQs | Revenue |
|---|---|---|
| Industrial Technology | 2 | $29B |
|
||
| Insurance | 2 | $17B |
|
||
| Retail | 1 | $60B |
|
||
| Technology Distribution | 1 | $58B |
|
||
| Homebuilding | 1 | $35B |
|
||
| Technology Manufacturing | 1 | $35B |
|
||
Price history
-11.2% since first listed3 events — show timeline
- 2026-04-01 Price Changed $119,900 Beaches MLS
- 2025-10-23 Price Changed $129,999 Beaches MLS
- 2025-07-17 Listed $135,000 Beaches MLS
Property tax history
+9.9%/yrLatest (2025): $2,812 · +35.8% YoY. Source: county tax records.
Cash-flow waterfall
monthlySold comps — $/sqft
last 12 mo · ≤1 miLoading sold comps…