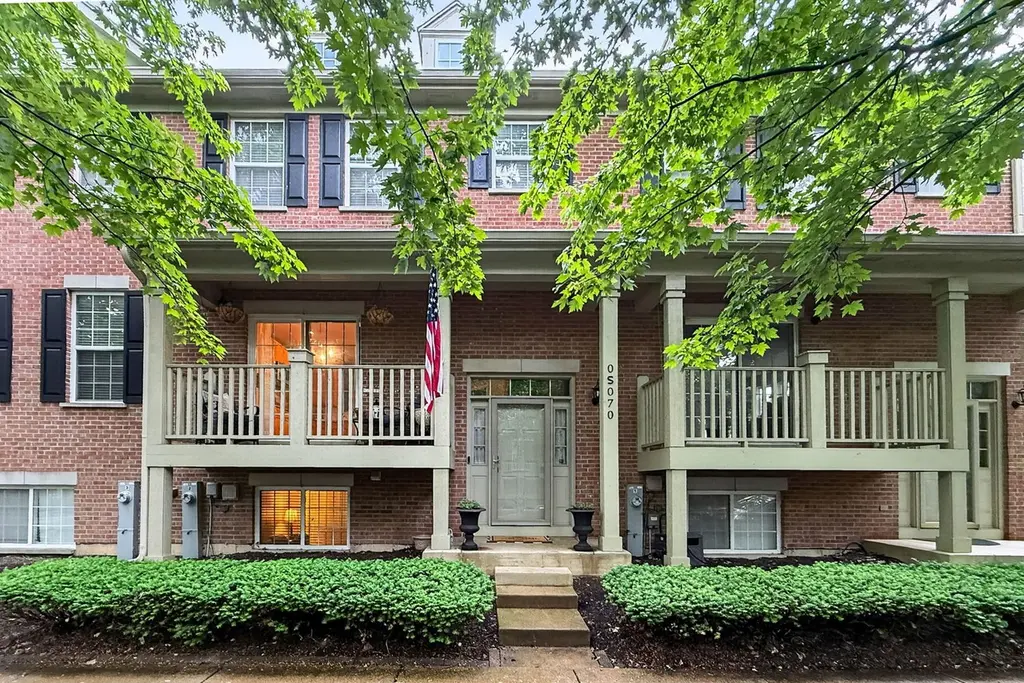
0S070 Lee Ct · Winfield, IL
Flood risk 1/10 · Minimal
- FEMA flood zone
- X (unshaded)
- Chance of flooding over 30 yrs
- 0.0%
- Est. flood insurance / yr
- $473 – $860
Fire risk 3/10 · Minor
- Est. fire insurance / yr
- $804 – $1,492
Heat risk 3/10 · Minor
- Hot days now (above 102°F)
- 7 days/yr
- Hot days in 30 yrs
- 14 days/yr
Wind risk 2/10 · Minimal
- Chance of severe wind over 30 yrs
- —
Air-quality risk 3/10 · Minor
- Unhealthy air days now
- 3 days/yr
- Unhealthy air days in 30 yrs
- 4 days/yr
Risk factors via First Street. Map © Google.
Why this score? — see what drove the D- grade
The composite is a weighted blend of 9 inputs, each scored 0–100. Each bar is that input's sub-score; the figure is the points it added to the 100-point composite (weight × sub-score).
- Cash flow +12.6/30.0
- ARV discount +5.6/15.0
- 1% rule +4.9/10.0
- Livability +4.0/5.0
- Condition / age +4.0/5.0
- DSCR +3.8/10.0
- Rent growth +2.5/5.0
- Schools +2.0/10.0
- Appreciation +0.0/10.0
$380,000
🖨 Deal sheet 📄 Offer letter ✓ Due diligence
Listing remarks MLS
Beautiful 2 bedroom and 2.1 bath townhome in Winfield Illinois. This fresh and bright home has 3 levels of living space. Walk into the welcoming foyer which leads to the huge open kitchen that has beautiful vinyl plank flooring, plenty of room for a table and chairs and a portable island. The kitchen features granite countertops, stainless steel appliances and a tile backsplash. There is also a separate dining room, with a beautiful chandelier, this room is great for entertaining. The spacious Living Room has a cozy gas fireplace. Upstairs are 2 spacious bedrooms each with their own full bath. There is also a bonus room off the Master that can be used as an office or nursery. The Master bedroom also has an amazing walk in closet. The English basement is finished with a family room or could be used as a recreation room or exercise space. There is an attached 2 car garage that is extra deep. Enjoy having your morning coffee on one of the 2 balconies! Tons of updates. The Home owners association takes care of all the landscaping maintenance, the snow removal and exterior of the building. This home is within walking distance to Central Dupage Hospital, the Winfield Metra Station, shops and Restaurants.
Key facts
- $382 HOA
- 2 garage spots
- Built 2003
Neighborhood map
What this means for you Summary
Snapshot
- This is a 2-bed/2.5-bath townhouse listed at $380k. Condition is rated good.
Deal economics
- At list price, monthly cash flow is $-46 ($-547/yr) — negative.
- To cash-flow at today's rent, offer at most $373k (1.7% below list).
- To meet the 1% rule (rent ≥ 1% of price), the offer needs to be $375k (1.3% below list).
- Recommended offer: $373k (1.7% below list) — sets the bar for cash-flow.
- Cap rate 6.1% vs local median 3.2% in Winfield — top-decile yield for the area; either an underpriced asset or a hidden risk that comps aren't pricing in. Stress-test before assuming the spread holds.
Location & tenants
- Location reads 81/100 on livability (#88 in IL, #1,455 nationally) — a professional / high-income tenant draw. Strengths: crime A+, employment A+, housing A+; Watch: amenities F, cost of living F.
- Chsd 94 (suburban): math 20% / reading 21% proficiency, ranked #378 of 620 in IL (top 61%) — low school quality limits family demand, transient renter base, plan for 1-2y turnover.
- Market conditions: 23 active listings in the ZIP; 1 comparable units currently listed for rent nearby; 1,378 units permitted in DuPage County in 2024 (594 in 5+ unit buildings).
Forward outlook
- Local home prices are declining (-3.0%/yr); year-one equity from $3k of loan paydown is wiped out by about $11k of value loss. Plan a longer hold.
Negotiation context
- Only 9 days on market — expect competitive offers; lowballing is unlikely to land.
Questions for the listing agent
- What do current leases actually rent for vs. the listed asking? Can we see a recent rent roll and the last 12 months of T-12 income?
- What does the HOA fee cover, when was the last increase, and are there any pending special assessments or reserve-fund shortfalls?
- Is there a deadline driving the sale (1031 exchange, divorce, estate, relocation)? That informs how much negotiation room exists.
- Schools are B-rated — typically a magnet for longer-tenancy family renters. What's the average tenant stay here, and is there a school-zone premium baked into asking?
- The area grade is low — what's the realistic commute time and amenity access for the typical tenant pool here? Any planned neighborhood developments (good or bad) we should know about?
- What's the average days-on-market for RENTAL listings here right now (not sales)? A rising rental-DOM trend means longer vacancies and softer asking-rent achievability than the comps imply.
- What's the recent tenant-quality profile in this submarket — average credit score on applications, eviction rate, late-payment / NSF rate, and stable-employment percentage? A property-management company in the area should have these aggregated.
- How much new for-sale + rental construction is in the pipeline within 1–3 miles? Heavy new supply typically softens prices + rents 12–24 months out; constrained supply supports both.
Investment metrics
- 1% rule
- 0.99% ✗
- Cap rate
- 6.15%
- Cash-on-cash
- -0.51%
- DSCR
- 0.98
- GRM
- 8.4
CMA / ARV
- ARV (on-the-fly)
- $364,320
- Comps found
- 12
Show comp detail 12 sales within ~0.75 mi
| Address | Dist | Beds/Ba | Sqft | Sold | Price | $/sf | Match |
|---|---|---|---|---|---|---|---|
| 77 Lee Ct | 0.02mi | 2/2.5 | 1,760 (0%) | 1mo | $344,950 | $196 | 98 |
| 0S044 Lee Ct | 0.02mi | 2/2.5 | 1,760 (0%) | 5mo | $347,000 | $197 | 94 |
| 0S053 Lee Ct | 0.03mi | 2/2.5 | 1,936 (+10%) | 2mo | $390,000 | $201 | 80 |
| 0s089 Kerry Ct | 0.06mi | 2/2.5 | 1,530 (-13%) | 0mo | $375,000 | $245 | 75 |
| 28W063 Woodland Dr | 0.65mi | 2/2.5 | 1,816 (+3%) | 2mo | $376,000 | $207 | 63 |
| 0N068 Forsythe Ct | 0.67mi | 2/2.5 | 1,620 (-8%) | 4mo | $356,500 | $220 | 52 |
| 28W078 Shelburne Farms Dr | 0.70mi | 2/2.5 | 1,910 (+8%) | 1mo | $420,000 | $220 | 52 |
| 0N081 Forsythe Ct | 0.69mi | 2/2.5 | 1,910 (+8%) | 6mo | $370,500 | $194 | 49 |
| 0N082 Forsythe Ct | 0.65mi | 3/2.5 (+1) | 1,918 (+9%) | 3mo | $435,000 | $227 | 47 |
| 0N079 Vermont Ct | 0.74mi | 2/2.5 | 1,984 (+13%) | 1mo | $397,000 | $200 | 43 |
| 0N094 Vermont Ct | 0.74mi | 2/2.5 | 1,556 (-12%) | 7mo | $365,000 | $235 | 40 |
| 0N062 Forsythe Ct | 0.69mi | 3/2.5 (+1) | 1,984 (+13%) | 6mo | $407,000 | $205 | 36 |
Match score weights: distance 35% · size 25% · config 20% · recency 20%. Top-matched comps best support the ARV.
Projected returns pro-forma
-3.0% appreciation · 3.0% rent growth · sell at horizon
- IRR
- -17.0%
- Equity multiple
- 0.40×
- Total profit
- $-64,189
- Equity at exit
- $56,659
- IRR
- -8.8%
- Equity multiple
- 0.45×
- Total profit
- $-58,450
- Equity at exit
- $32,855
Cash invested: $106,400 (down + closing). Projections, not guarantees.
Landlord ↔ Tenant lean methodology
- Overall (STATE)
- 43 Moderately Tenant-Leaning
- State Illinois
- 43 Moderately Tenant-Leaning · D+7
- County
- — inherits STATE
- City
- — inherits STATE
ZIP-level market 60190
- Home prices YoY
- -32.2%
- Active inventory
- 23
- Price-to-rent
- 8.4×
Monthly cashflow live
- Estimated rent
- $3,750 medium interval (Pro) →
- Mortgage (P&I)
- −$1,993
- Tax est. 1.5%
- −$475 /mo · $5,700/yr
- Insurance
- −$158
- HOA
- −$382
- Vacancy / Maint / Mgmt
- −$788
- Net cashflow
- $-46
Break-even live
UW: 25.0% down · 7.5% · 30yr · 1.5% tax · 5.0% vac · 8.0% maint · 8.0% mgmt
Financing live
Cash to close
- Down payment
- $95,000
- Closing costs
- $11,400
- Reserves months
- —
- Total cash needed
- —
Loan-product check · same deal, 3 products live
Conventional
25% down · 7.5% · 30yr
- Down + closing
- —
- Monthly P&I
- —
- Monthly cashflow
- —
- DSCR
- —
- Eligible?
- —
Personal DTI + credit; lowest rate.
DSCR
20% down · 8.5% · 30yr
- Down + closing
- —
- Monthly P&I
- —
- Monthly cashflow
- —
- DSCR
- —
- Eligible?
- —
No personal income docs; deal must DSCR.
Hard money
10% down · 12.0% · 12mo
- Down + closing
- —
- Monthly P&I
- —
- Monthly cashflow
- —
- DSCR
- —
- Eligible?
- —
Short-term bridge; refi at stabilization.
Rent comps 1 comps
| Address | Beds | Baths | Sqft | Rent | $/sqft | DOM | Units | Dist |
|---|---|---|---|---|---|---|---|---|
| 2067 Childs Ct Wheaton, IL | 3.0 | 2.5 | 1412 | $3,750 | $2.66 | 24d | 1 | 1.06mi |
HOA detail
- Monthly dues
- $382 · $4,584/yr
- Likely covers
- gaslandscapingsnow removal
Listing history 9 events
-
2026-06-18days on market $380,000 Active 9 DOM
-
2026-06-17days on market $380,000 Active 8 DOM
-
2026-06-16days on market $380,000 Active 7 DOM
-
2026-06-15days on market $380,000 Active 6 DOM
-
2026-06-13days on market $380,000 Active 4 DOM
-
2026-06-10statusdays on market $380,000 Active 1 DOM
-
2026-06-09days on market $380,000 Active (Private) 2 DOM
-
2026-06-08remarks 699-char remark
-
2026-06-08$380,000 Active (Private) 1 DOM
ⓘ Source: listings_history table (triggers on properties + properties_extension) + one-shot
backfill from property_details.listing_events for pre-trigger history.
Climate risk First Street
- Flood 1/10 Low FEMA zone X (unshaded) · 0% chance over 30 yrs
- Wildfire 3/10 Moderate
- Heat 3/10 Moderate 7 d/yr ≥102°F today · 14 d/yr by 30 yrs out
- Wind 2/10 Low
- Air quality 3/10 Moderate 3 unhealthy d/yr today · 4 by 30 yrs out
Nearby sold comps map
Loading sold comps map…
Walkable amenities ~0.75 mi
Loading nearby amenities…
Taxation est. · year 1
- Rental income
- $45,000
- − Mortgage interest
- −$21,286
- − Property taxes
- −$5,700
- − Insurance
- −$1,900
- − Repairs & maintenance
- −$3,600
- − Management
- −$3,600
- − HOA
- −$4,584
- − Depreciation
- −$11,055
- Taxable loss
- −$6,724
- Est. tax savings @ 24.0%
- +$1,614
- After-tax cash flow
- $1,067/yr
For passive investors: Depreciation is non-cash, so a rental often shows a tax loss while cash-flowing — sheltering income. Rental losses are passive: they offset passive income freely, and up to $25,000/yr can offset ordinary (W-2) income if you actively participate and your MAGI is under $100k (phasing out to $0 by $150k); unused losses carry forward. On sale, claimed depreciation is recaptured at up to 25%, and gains may owe capital-gains tax (a 1031 exchange can defer both). Figures are a year-1 estimate at your 24.0% rate — not tax advice; consult a CPA.
Condition & rehab AI · 12 photos
This well-maintained townhouse in Winfield, IL offers a good condition with a good condition score of 80. It is ready for a potential buyer or renter with minor cosmetic updates that could further enhance its value.
Value-add opportunities
- Both landscaping — enhances curb appeal and adds value
- Both painting — refreshes the interior and exterior
- Resale upgrading appliances — attracts more buyers with modern features
Renovation cost estimate screening
Value-add ROI direction
- Both landscaping — enhances curb appeal and adds value ↑
- Both painting — refreshes the interior and exterior ↑
- Resale upgrading appliances — attracts more buyers with modern features ↑
ⓘ Cost ranges are severity-bucket heuristics (US national rule-of-thumb). Get contractor quotes + a written scope before underwriting a rehab budget.
Schools (NCES district)
- District
- Chsd 94
- NCES district ID
- 1740440
- Math proficiency
- 20% ▼ -8.00%
- Reading proficiency
- 21% ▼ -7.00%
- Median HH income
- $64,377
- Composite
- 19.71/100
- National rank
- #8719
- State rank
- #378 of 620 in IL
Livability — Winfield
- Score
- 81/100
- State rank
- #88
- US rank
- #1455
Category grades
Schools grade is shown separately in the Schools card above.
Census & demographics
- Census place
- Winfield, IL
- City population
- 11,931
- Population (ZIP)
- 11,931
Population outlook (DuPage County) Hauer SSP2
- Today (2025)
- 960,187 people
- By 2030
- 965,850 · +0.6%
- By 2040
- 965,812 · +0.6%
- By 2050
- 954,890 · -0.6%
- By 2075
- 910,185 · -5.2%
- By 2100
- 816,255 · -15.0%
Race, ethnicity, and origin ACS 2023
- Neighborhood character
- Predominantly White (78%)
- Race & ethnicity
- White 78% Hispanic / Latino 13% Two or more races 8% Asian 5% Black 2%
- Hispanic origin (detail)
- Mexican 10%
- Common ancestry
- Romanian 11% Slovak 3% Italian 3%
- Foreign-born
- 8% · Canada, Vietnam
- Languages at home
- 85% English-only · Spanish 9% Other Indo-European 2% Arabic 1%
Political lean MEDSL · DuPage
- 2024 margin
- D (+13.3) · D 55.9% · R 42.5% · Other 1.6%
- 2008→2024 swing
- +2.5pp toward D · 2008: 10.8pp · 2024: 13.3pp
- All cycles
- 2024: D+13.3 2020: D+18.1 2016: D+14.1 2012: D+1.0 2008: D+10.8
Not yet ingested
- Civics
- —
Market trends
- HPI YoY
- ▼ -95.50%
- Current HPI
- 201.3501
- Rent YoY
- —
- Metro
- —
- State GDP YoY
- ▲ 1.59%
- F500 in state
- 60
Industry mix (Fortune 500 HQ in IL)
| Industry | F500 HQs | Revenue |
|---|---|---|
| Insurance | 4 | $201B |
|
||
| Consumer Goods | 4 | $87B |
|
||
| Industrial Machinery | 3 | $64B |
|
||
| Healthcare | 2 | $55B |
|
||
| Retail / Pharmacy | 1 | $148B |
|
||
| Agriculture / Food | 1 | $86B |
|
||
Price history
+5.6% since first listed5 events — show timeline
- 2026-06-07 Coming Soon $380,000 MRED as Distributed by MLS Grid
- 2025-08-07 Sold (MLS) $359,900 MRED as Distributed by MLS Grid
- 2025-07-01 Pending — MRED as Distributed by MLS Grid
- 2025-06-21 Contingent — MRED as Distributed by MLS Grid
- 2025-06-12 Listed $359,900 MRED as Distributed by MLS Grid
Cash-flow waterfall
monthlySold comps — $/sqft
last 12 mo · ≤1 miLoading sold comps…