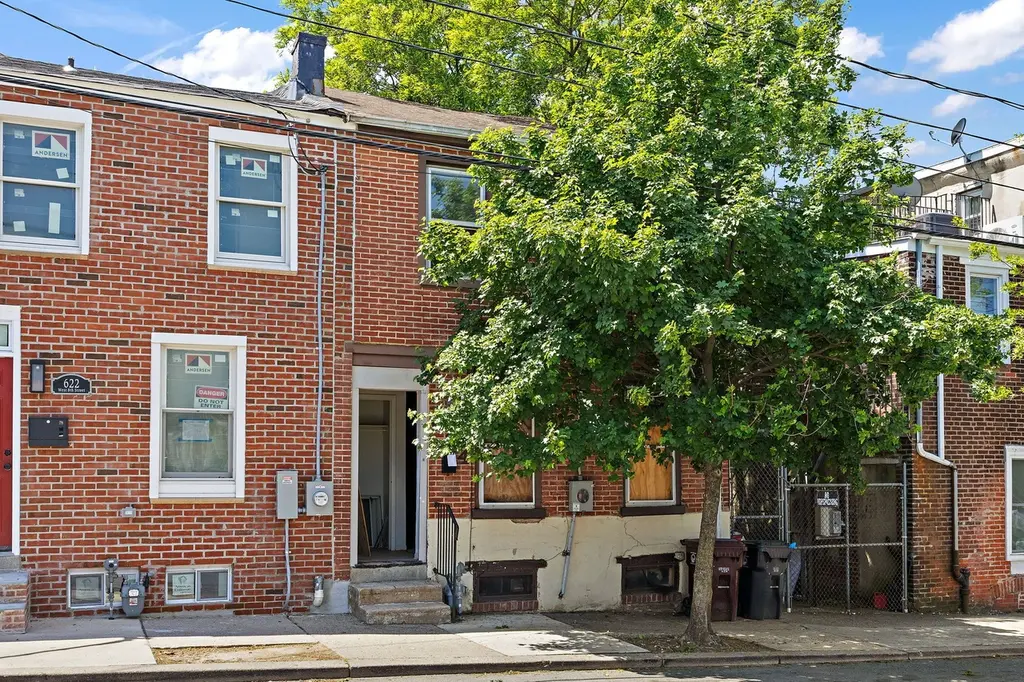
624 W 8th St · Wilmington, DE
Flood risk 1/10 · Minimal
- FEMA flood zone
- X (unshaded)
- Chance of flooding over 30 yrs
- 0.0%
- Est. flood insurance / yr
- $473 – $860
Fire risk 1/10 · Minimal
- Est. fire insurance / yr
- $476 – $884
Heat risk 8/10 · Major
- Hot days now (above 103°F)
- 7 days/yr
- Hot days in 30 yrs
- 16 days/yr
Wind risk 6/10 · Moderate
- Chance of severe wind over 30 yrs
- 27.0%
Air-quality risk 3/10 · Minor
- Unhealthy air days now
- 3 days/yr
- Unhealthy air days in 30 yrs
- 4 days/yr
Risk factors via First Street. Map © Google.
Why this score? — see what drove the B+ grade
The composite is a weighted blend of 9 inputs, each scored 0–100. Each bar is that input's sub-score; the figure is the points it added to the 100-point composite (weight × sub-score).
- Cash flow +30.0/30.0
- ARV discount +15.0/15.0
- DSCR +10.0/10.0
- 1% rule +9.5/10.0
- Livability +3.2/5.0
- Rent growth +2.9/5.0
- Schools +2.5/10.0
- Condition / age +2.5/5.0
- Appreciation +0.0/10.0
$130,000
🖨 Deal sheet (PDF) 📄 Offer letter ✓ Due diligence
Listing remarks
Opportunity awaits with this 3-bedroom, 1-bath brick row home in the City of Wilmington. Featuring replacement windows, updated electric service, and solid brick construction, this property is ready for its next chapter. The interior has been partially renovated and offers a blank canvas for investors, flippers, or buyers looking to customize a home to their own taste. Conveniently located near downtown Wilmington, major roadways, shopping, dining, and public transportation. Whether you're looking to add to your rental portfolio or complete a value-add renovation project, this property offers strong potential at an affordable price point. Buyer to perform their own due diligence regarding s
Key facts
- Major roadways
- Shopping
- Replacement windows
Tags
Property features AI
Exterior
- Parking: On-street parking
- Utilities: Public water; Public sewer; Municipal trash service
- Home design: End of row townhouse; Flat roof; Fee simple ownership; Property in average condition; Above-grade finished area (per assessor) 1,175
- Construction: Brick construction; Stone foundation
- Exterior features: Lot dimensions approximately 17 x 81; Blacktop road access; City/county road responsibility; Located in city limits
Interior
- Basement: Full basement
- Bedrooms: Three bedrooms on the first upper level
- Flooring: Luxury vinyl plank flooring; Rough-in (utility/finished area)
- Bathrooms: One full bathroom (all upper levels)
- Heating & cooling: Forced air heating (natural gas); Window air conditioning units (electric); Natural gas hot water
- Interior features: Plaster walls; 2+ access exits
Neighborhood map
What this means for you Summary
Snapshot
- This is a 3-bed/1.0-bath townhouse listed at $130k.
Deal economics
- At list price, monthly cash flow is $697 ($8k/yr) — positive.
- The deal already cash-flows at list — no discount required.
- Meets the 1% rule at list price ($2k rent vs $130k).
- Recommended offer: $128k (1.5% below list) — sets the bar for market timing.
- Cap rate 12.7% vs local median 5.7% in Wilmington — top-decile yield for the area; either an underpriced asset or a hidden risk that comps aren't pricing in. Stress-test before assuming the spread holds.
Location & tenants
- Location reads 64/100 on livability (#52 in DE) — a middle-class / working-renter tenant base. Strengths: cost of living A+, housing A; Watch: employment D+, commute D, crime F.
- Christina School District (suburban): math 22% / reading 33% proficiency, ranked #18 of 26 in DE (top 69%) — low school quality limits family demand, transient renter base, plan for 1-2y turnover.
- Zoned schools: Stubbs Early Education Center (190 students, 0% FRL); The Bayard School (math 3% / reading 10%, grade F, #102 of 105 statewide, top 97%, 508 students, 0% FRL); Christiana High School (math 49% / reading 66%, grade C, #3 of 40 statewide, top 5%, 1,256 students, 0% FRL) — zoned schools average 0% FRL vs 50% district-wide (50 pts lower); this property's tenant base skews higher-income than the district average.
- Market conditions: Rents rising (+1.6%/yr); 75 active listings in the ZIP; 40 comparable units currently listed for rent nearby; rentals at typical pace (median 21d on market — plan ~3-4 weeks tenant-placement turnaround); 1,367 units permitted in New Castle County in 2024 (201 in 5+ unit buildings).
- This rent runs 43% of the median local income ($53k/yr) — at the standard rent-burdened threshold; future hikes will face affordability resistance.
Forward outlook
- Local home prices are declining (-3.0%/yr); year-one equity from $899 of loan paydown is wiped out by about $4k of value loss. Plan a longer hold.
- New Castle County population projected at +9% by 2050 — modest demand growth; plan on rents tracking national, not racing it.
- At projected returns (-3.0% appreciation + 1.6% rent growth), your $36k cash investment doubles in ~6 years — after that, you're playing with house money.
Negotiation context
- It's been on market 17 days — a 2% lower offer ($128k) is reasonable based on typical stale-listing flexibility.
- 2 sale attempts with the ask held roughly flat each time — persistent listings suggest the price (not the market) is what's stuck; bring a comps-based counter.
Risks & watch-outs
- Watch-outs: built in 1900 — expect roof / HVAC / electrical / plumbing capex.
- Climate carrying-cost: major wind risk, 27% chance of damaging wind over 30y; extreme-heat days projected 7→16/yr by 2055 (HVAC capex compounding) — expect insurance premiums to compound above CPI over the hold.
Questions for the listing agent
- Built in 1900 — when were the roof, HVAC, electrical panel, plumbing, and water heater last replaced?
- Is there a deadline driving the sale (1031 exchange, divorce, estate, relocation)? That informs how much negotiation room exists.
- Schools are D-rated, which usually means shorter tenancies and higher turnover. Who's the typical renter profile here, and what's been the actual vacancy rate?
- Crime grade is F in this area — have there been break-ins, vandalism, or insurance claims at this property in the last 3 years? What carrier currently insures it and at what premium?
- What's the average days-on-market for RENTAL listings here right now (not sales)? A rising rental-DOM trend means longer vacancies and softer asking-rent achievability than the comps imply.
- What's the recent tenant-quality profile in this submarket — average credit score on applications, eviction rate, late-payment / NSF rate, and stable-employment percentage? A property-management company in the area should have these aggregated.
- How much new for-sale + rental construction is in the pipeline within 1–3 miles? Heavy new supply typically softens prices + rents 12–24 months out; constrained supply supports both.
Investment metrics
- 1% rule
- 1.45% ✓
- Cap rate
- 12.72%
- Cash-on-cash
- 22.97%
- DSCR
- 2.02
- GRM
- 5.7
CMA / ARV
- ARV (on-the-fly)
- $182,125
- Comps found
- 12
Show comp detail 12 sales within ~0.75 mi
| Address | Dist | Beds/Ba | Sqft | Sold | Price | $/sf | Match |
|---|---|---|---|---|---|---|---|
| 519 Lafayette Blvd | 0.32mi | 2/1.5 (-1) | 1,250 (+6%) | 1mo | $235,000 | $188 | 67 |
| 1212 N Tatnall St | 0.41mi | 3/1.0 | 1,275 (+8%) | 0mo | $165,000 | $129 | 66 |
| 1213 W 3rd St | 0.46mi | 3/1.5 | 1,250 (+6%) | 1mo | $215,000 | $172 | 65 |
| 302 S Franklin St | 0.68mi | 3/1.0 | 1,150 (-2%) | 1mo | $117,000 | $102 | 64 |
| 519 S Jackson St | 0.71mi | 3/1.0 | 1,200 (+2%) | 1mo | $186,000 | $155 | 62 |
| 1301 Lancaster Ave | 0.58mi | 4/2.0 (+1) | 1,200 (+2%) | 1mo | $250,000 | $208 | 60 |
| 834 N Pine St | 0.74mi | 3/1.5 | 1,150 (-2%) | 1mo | $150,000 | $130 | 59 |
| 524 Taylor St | 0.72mi | 2/1.0 (-1) | 1,125 (-4%) | 1mo | $110,000 | $98 | 54 |
| 105-UNIT Christina Landing Dr #406 | 0.73mi | 2/2.0 (-1) | 1,125 (-4%) | 1mo | $325,000 | $289 | 49 |
| 1210 Elm St | 0.65mi | 3/2.0 | 1,300 (+11%) | 1mo | $200,000 | $154 | 47 |
| 1313 N Walnut St | 0.65mi | 2/1.0 (-1) | 1,350 (+15%) | 1mo | $155,000 | $115 | 39 |
| 501 E 5th St | 0.71mi | 4/2.5 (+1) | 1,325 (+13%) | 0mo | $236,000 | $178 | 34 |
Match score weights: distance 35% · size 25% · config 20% · recency 20%. Top-matched comps best support the ARV.
Projected returns pro-forma
-3.0% appreciation · 1.59% rent growth · sell at horizon
- IRR
- 14.4%
- Equity multiple
- 1.57×
- Total profit
- $20,623
- Equity at exit
- $19,383
- IRR
- 22.1%
- Equity multiple
- 2.77×
- Total profit
- $64,398
- Equity at exit
- $11,240
Cash invested: $36,400 (down + closing). Projections, not guarantees.
Landlord ↔ Tenant lean methodology
- Overall (STATE)
- 70 Landlord-Friendly
- State Delaware
- 70 Landlord-Friendly · D+7
- County
- — inherits STATE
- City
- — inherits STATE
ZIP-level market 19801
- Rents YoY
- 1.6%
- Active inventory
- 75
- Price-to-rent
- 5.7×
Monthly cashflow live
- Estimated rent
- $1,891 high interval (Pro) →
- Mortgage (P&I)
- −$682
- Tax from tax record
- −$62 /mo · $741/yr
- Insurance
- −$54
- HOA
- −$0
- Vacancy / Maint / Mgmt
- −$397
- Net cashflow
- $697
Break-even live
Sensitivity live
| Price | -10% $770 | -5% $733 | +0% $697 | +5% $660 | +10% $623 |
|---|---|---|---|---|---|
| Rent | -10% $547 | -5% $622 | +0% $697 | +5% $771 | +10% $846 |
| Rate | -1.0pp $762 | -0.5pp $730 | base $697 | +0.5pp $663 | +1.0pp $629 |
UW: 25.0% down · 7.5% · 30yr · 1.5% tax · 5.0% vac · 8.0% maint · 8.0% mgmt
Financing live
Cash to close
- Down payment
- $32,500
- Closing costs
- $3,900
- Reserves months
- —
- Total cash needed
- —
Loan-product check · same deal, 3 products live
Conventional
25% down · 7.5% · 30yr
- Down + closing
- —
- Monthly P&I
- —
- Monthly cashflow
- —
- DSCR
- —
- Eligible?
- —
Personal DTI + credit; lowest rate.
DSCR
20% down · 8.5% · 30yr
- Down + closing
- —
- Monthly P&I
- —
- Monthly cashflow
- —
- DSCR
- —
- Eligible?
- —
No personal income docs; deal must DSCR.
Hard money
10% down · 12.0% · 12mo
- Down + closing
- —
- Monthly P&I
- —
- Monthly cashflow
- —
- DSCR
- —
- Eligible?
- —
Short-term bridge; refi at stabilization.
Rent comps 40 comps
| Address | Beds | Baths | Sqft | Rent | $/sqft | DOM | Units | Dist |
|---|---|---|---|---|---|---|---|---|
| 711 Windsor St Wilmington, DE | 2.0 | 1.0 | 980 | $1,460 | $1.49 | 45d | 1 | 0.04mi |
| 709 Windsor St Unit 3 Wilmington, DE | 2.0 | 1.0 | 980 | $1,500 | $1.53 | 45d | 1 | 0.05mi |
| 617 W 6th St Unit 617 B Wilmington, DE | 3.0 | 1.0 | 1000 | $1,600 | $1.60 | 7d | 1 | 0.12mi |
| 820 W 7th St Wilmington, DE | 3.0 | 1.0 | 1000 | $1,650 | $1.65 | 45d | 1 | 0.15mi |
| 613 W 10th St Wilmington, DE | 2.0 | 1.0 | 1100 | $1,745 | $1.59 | 45d | 1 | 0.16mi |
| 1010 Trenton Pl Wilmington, DE | 3.0 | 1.5 | 1475 | $2,350 | $1.59 | 18d | 1 | 0.21mi |
| 839 N Tatnall St Unit 101 Wilmington, DE | 2.0 | 2.0 | 1211 | $1,750 | $1.45 | 7d | 1 | 0.21mi |
| 1000 W 8th St Unit 3 Wilmington, DE | 2.0 | 1.0 | 1050 | $1,695 | $1.61 | 26d | 1 | 0.23mi |
| 15 W Girard St Unit 105 Wilmington, DE | 2.0 | 1.0 | 740 | $1,645 | $2.22 | 7d | 1 | 0.23mi |
| 228 W 9th St Unit 201 Wilmington, DE | 2.0 | 2.0 | 1031 | $1,695 | $1.64 | 46d | 1 | 0.24mi |
| 507 W 4th St Wilmington, DE | 3.0 | 1.5 | 1075 | $1,800 | $1.67 | 14d | 1 | 0.24mi |
| 801 N Orange St Wilmington, DE | 3.0 | 1.0–3.0 | 1118 | $3,991 | $3.57 | 0d | 115 | 0.26mi |
| 703 Orange St Wilmington, DE | 1.0–2.0 | 1.0 | 800 | $1,475 | $1.84 | 45d | 1 | 0.28mi |
| 116 W 9th St Wilmington, DE | 1.0–2.0 | 1.0–2.0 | 813 | $2,270 | $2.79 | 0d | 17 | 0.30mi |
| 225 W 4th St Unit 2 Wilmington, DE | 2.0 | 1.0 | 1000 | $1,599 | $1.60 | 45d | 1 | 0.32mi |
| 1001 N Orange St Wilmington, DE | 1.0–2.0 | 1.0–2.0 | 833 | $2,135 | $2.56 | 0d | 61 | 0.33mi |
| 801 N Market St Unit 207 Wilmington, DE | 2.0 | 2.0 | 1239 | $1,895 | $1.53 | 7d | 1 | 0.34mi |
| 517 N Shipley St Wilmington, DE | 2.0 | 1.0–2.0 | 822 | $2,670 | $3.25 | 0d | 15 | 0.34mi |
| 913 N Market St Wilmington, DE | 1.0–2.0 | 1.0–2.0 | 974 | $1,985 | $2.04 | 45d | 5 | 0.36mi |
| 107 W 13th St Wilmington, DE | 3.0 | 1.5 | 1325 | $1,895 | $1.43 | 45d | 1 | 0.45mi |
| 521 N Franklin St Wilmington, DE | 3.0 | 2.0 | 1500 | $1,795 | $1.20 | 0d | 1 | 0.46mi |
| 1029 Lancaster Ave Wilmington, DE | 4.0 | 1.5 | 1375 | $1,900 | $1.38 | 26d | 1 | 0.50mi |
| 802 N Broom St Apt 2 Wilmington, DE | 2.0 | 21.0 | 800 | $1,695 | $2.12 | 23d | 1 | 0.51mi |
| 1217 N King St Wilmington, DE | 3.0 | 1.5 | 1300 | $2,145 | $1.65 | 20d | 1 | 0.51mi |
| 232 N Franklin St Wilmington, DE | 3.0 | 2.0 | 1150 | $1,795 | $1.56 | 45d | 1 | 0.52mi |
| 1114 Lancaster Ave Wilmington, DE | 2.0 | 1.0 | 775 | $1,400 | $1.81 | 26d | 1 | 0.54mi |
| 1210 Delaware Ave Unit 3 Wilmington, DE | 2.0 | 1.0 | 1200 | $2,395 | $2.00 | 45d | 1 | 0.55mi |
| 1207 Delaware Ave Wilmington, DE | 2.0 | 1.0 | 1200 | $1,700 | $1.42 | 13d | 1 | 0.56mi |
| 1301 N Harrison St Wilmington, DE | 1.0–2.0 | 1.0 | 1050 | $1,850 | $1.76 | 7d | 1 | 0.56mi |
| 1212 Delaware Ave Wilmington, DE | 2.0 | 1.0–2.0 | 700 | $2,495 | $3.56 | 45d | 4 | 0.56mi |
| 1212 Delaware Ave Wilmington, DE | 2.0 | 1.0–2.0 | 925 | $2,695 | $2.91 | 14d | 4 | 0.56mi |
| 1110 Read St Wilmington, DE | 2.0 | 1.0 | 1100 | $1,250 | $1.14 | 22d | 1 | 0.57mi |
| 205 Porter St Wilmington, DE | 2.0 | 1.5 | 1200 | $1,700 | $1.42 | 17d | 1 | 0.59mi |
| 1301 Lancaster Ave Wilmington, DE | 4.0 | 2.0 | 1200 | $1,800 | $1.50 | 13d | 1 | 0.60mi |
| 1522 W 7th St Unit 1 Wilmington, DE | 2.0 | 1.0 | 900 | $1,800 | $2.00 | 6d | 1 | 0.64mi |
| 1124 Clifford Brown Walk Wilmington, DE | 2.0 | 1.0 | 1240 | $1,625 | $1.31 | 45d | 1 | 0.65mi |
| 307 N Rodney St Wilmington, DE | 3.0 | 1.5 | 1425 | $2,000 | $1.40 | 45d | 1 | 0.66mi |
| 1607 Howland St Wilmington, DE | 3.0 | 1.0 | 1075 | $1,900 | $1.77 | 5d | 1 | 0.70mi |
| 1227 Linden St Wilmington, DE | 3.0 | 2.0 | 950 | $1,850 | $1.95 | 5d | 1 | 0.71mi |
| 1501 N Broom St Unit 2/3 Wilmington, DE | 2.0 | 2.5 | 1250 | $2,500 | $2.00 | 7d | 1 | 0.72mi |
Listing history 16 events
-
2026-06-21days on market $130,000 Active 17 DOM
-
2026-06-18days on market $130,000 Active 14 DOM
-
2026-06-17days on market $130,000 Active 13 DOM
-
2026-06-16days on market $130,000 Active 12 DOM
-
2026-06-15days on market $130,000 Active 11 DOM
-
2026-06-13days on market $130,000 Active 9 DOM
-
2026-06-13days on market $130,000 Active 8 DOM
-
2026-06-09days on market $130,000 Active 5 DOM
-
2026-06-08days on market $130,000 Active 4 DOM
-
2026-06-07remarks 699-char remark
-
2026-06-07statusdays on market $130,000 Active 3 DOM
-
2026-06-04days on market $130,000 Coming Soon 17 DOM
-
2026-06-03days on market $130,000 Coming Soon 16 DOM
-
2026-06-02days on market $130,000 Coming Soon 15 DOM
-
2026-06-01days on market $130,000 Coming Soon 14 DOM
-
2026-05-31days on market $130,000 Coming Soon 13 DOM
ⓘ Source: listings_history table (triggers on properties + properties_extension) + one-shot
backfill from property_details.listing_events for pre-trigger history.
Tax reassessment forecast DE · Partial reset (capped growth)
- Current annual tax
- $741 · $62/mo
- Projected year-2 tax
- $747 · $62/mo
- Expected delta
- +$7/yr (+$1/mo · 0.9%)
ⓘ Screening estimate from a state-policy table — verify with the county assessor before closing.
Climate risk First Street
- Flood 1/10 Low FEMA zone X (unshaded) · 0% chance over 30 yrs
- Wildfire 1/10 Low
- Heat 8/10 Severe 7 d/yr ≥103°F today · 16 d/yr by 30 yrs out
- Wind 6/10 Major 27% chance of damaging wind over 30 yrs
- Air quality 3/10 Moderate 3 unhealthy d/yr today · 4 by 30 yrs out
Nearby sold comps map
Loading sold comps map…
Walkable amenities ~0.75 mi
Loading nearby amenities…
Taxation est. · year 1
- Rental income
- $22,698
- − Mortgage interest
- −$7,282
- − Property taxes
- −$741
- − Insurance
- −$650
- − Repairs & maintenance
- −$1,816
- − Management
- −$1,816
- − Depreciation
- −$3,782
- Taxable income
- $6,611
- Est. tax owed @ 24.0%
- −$1,587
- After-tax cash flow
- $6,773/yr
For passive investors: Depreciation is non-cash, so a rental often shows a tax loss while cash-flowing — sheltering income. Rental losses are passive: they offset passive income freely, and up to $25,000/yr can offset ordinary (W-2) income if you actively participate and your MAGI is under $100k (phasing out to $0 by $150k); unused losses carry forward. On sale, claimed depreciation is recaptured at up to 25%, and gains may owe capital-gains tax (a 1031 exchange can defer both). Figures are a year-1 estimate at your 24.0% rate — not tax advice; consult a CPA.
Schools (NCES district)
- District
- Christina School District
- NCES district ID
- 1000200
- Math proficiency
- 22% ▼ -12.00%
- Reading proficiency
- 33% ▼ -5.00%
- Median HH income
- $58,838
- Composite
- 24.93/100
- National rank
- #7567
- State rank
- #18 of 26 in DE
Livability — Wilmington
- Score
- 64/100
- State rank
- #52
- US rank
- #14251
Category grades
Schools grade is shown separately in the Schools card above.
Census & demographics
- Census place
- Wilmington, DE
- County
- New Castle County · 483,412 people
- City population
- 173,480
- Metro
- Philadelphia-Camden-Wilmington, PA-NJ-DE-MD
- Population (ZIP)
- 16,327
- Household income
- $52,810
- Rent vs Own
- Severe rent burden
- 919.0
Population outlook (New Castle County) Hauer SSP2
- Today (2025)
- 594,686 people
- By 2030
- 609,164 · +2.4%
- By 2040
- 632,154 · +6.3%
- By 2050
- 649,068 · +9.1%
- By 2075
- 687,771 · +15.7%
- By 2100
- 694,961 · +16.9%
Race, ethnicity, and origin ACS 2023
- Neighborhood character
- Predominantly Black (67%)
- Race & ethnicity
- Black 67% White 15% Hispanic / Latino 9% Two or more races 7% Asian 4%
- Hispanic origin (detail)
- Mexican 3% Puerto Rican 4%
- Common ancestry
- Romanian 1% Slovak 1% Italian 1%
- Foreign-born
- 9% · Canada, China, Vietnam
- Languages at home
- 87% English-only · Spanish 7% Other Indo-European 2% Chinese 1%
Political lean MEDSL · New Castle
- 2024 margin
- Solid D (+32.6) · D 65.5% · R 32.9% · Other 1.6%
- 2008→2024 swing
- -8.1pp toward R · 2008: 40.6pp · 2024: 32.6pp
- All cycles
- 2024: D+32.6 2020: D+37.1 2016: D+29.6 2012: D+34.1 2008: D+40.6
Not yet ingested
- Civics
- —
Market trends
- HPI YoY
- ▼ -112.65%
- Current HPI
- 151.1288
- Rent YoY
- ▲ 1.59%
- Metro
- Philadelphia-Camden-Wilmington, PA-NJ-DE-MD
- State GDP YoY
- —
- F500 in state
- 0
Price history
-17.7% since first listed8 events — show timeline
- 2026-06-04 Listed $130,000 BRIGHT MLS
- 2026-03-26 Listing Removed — BRIGHT MLS
- 2026-02-24 Price Changed $129,900 BRIGHT MLS
- 2026-01-23 Listed $139,900 BRIGHT MLS
- 2026-01-16 Coming Soon — BRIGHT MLS
- 2010-11-24 Sold (Public Records) $158,000 Public Records
- 2010-11-23 Sold (Public Records) $158,000 Public Records
- 2010-11-23 Sold (Public Records) $158,000 Public Records
Property tax history
+3.9%/yrLatest (2024): $741 · +2.6% YoY. Source: county tax records.
Cash-flow waterfall
monthlySold comps — $/sqft
last 12 mo · ≤1 miLoading sold comps…