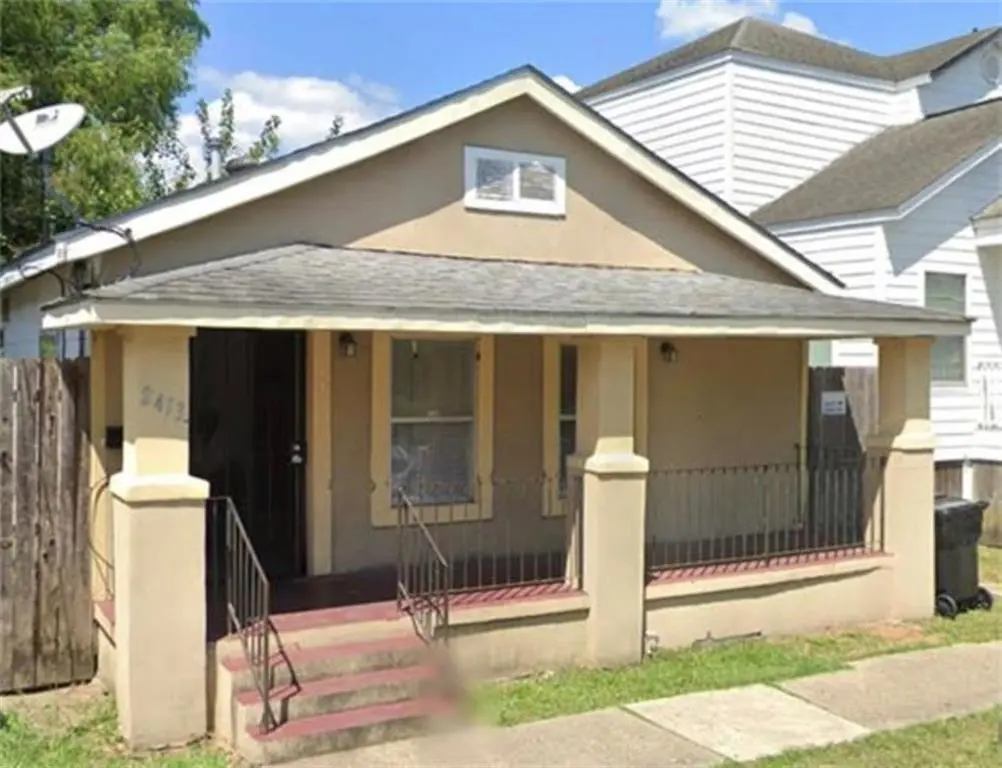
2413 S Derbigny St · New Orleans, LA
Flood risk 8/10 · Major
- FEMA flood zone
- AE
- Chance of flooding over 30 yrs
- 0.78%
- Est. flood insurance / yr
- $1,737 – $8,500
Fire risk 1/10 · Minimal
- Est. fire insurance / yr
- $1,269 – $2,357
Heat risk 10/10 · Severe
- Hot days now (above 108°F)
- 7 days/yr
- Hot days in 30 yrs
- 20 days/yr
Wind risk 10/10 · Severe
- Chance of severe wind over 30 yrs
- 99.0%
Air-quality risk 3/10 · Minor
- Unhealthy air days now
- 3 days/yr
- Unhealthy air days in 30 yrs
- 4 days/yr
Risk factors via First Street. Map © Google.
Why this score? — see what drove the B+ grade
The composite is a weighted blend of 9 inputs, each scored 0–100. Each bar is that input's sub-score; the figure is the points it added to the 100-point composite (weight × sub-score).
- Cash flow +30.0/30.0
- ARV discount +15.0/15.0
- 1% rule +10.0/10.0
- DSCR +10.0/10.0
- Livability +4.0/5.0
- Rent growth +2.7/5.0
- Condition / age +2.5/5.0
- Schools +1.6/10.0
- Appreciation +0.0/10.0
$99,000
🖨 Deal sheet (PDF) 📄 Offer letter ✓ Due diligence
Listing remarks MLS
FORMER DOUBLE CONVERTED TO A SINGLE. HAS BEEN VACANT FOR OVER 6 MONTHS, NEEDS WORK.
Key facts
- 1,981 sq ft lot
- Built 1946
- Listed 182 days
Neighborhood map
What this means for you Summary
Snapshot
- This is a 4-bed/2.0-bath single-family listed at $99k.
Deal economics
- At list price, monthly cash flow is $460 ($6k/yr) — positive.
- The deal already cash-flows at list — no discount required.
- Meets the 1% rule at list price ($2k rent vs $99k).
- Recommended offer: $87k (12.0% below list) — sets the bar for market timing.
- Cap rate 17.0% vs local median 4.4% in New Orleans — top-decile yield for the area; either an underpriced asset or a hidden risk that comps aren't pricing in. Stress-test before assuming the spread holds.
Location & tenants
- Location reads 81/100 on livability (#3 in LA, #1,383 nationally) — a professional / high-income tenant draw. Strengths: amenities A+, commute A+, health & safety A+; Watch: crime C-, employment D.
- Orleans Parish (urban): math 11% / reading 27% proficiency, ranked #69 of 98 in LA (top 70%) — low school quality limits family demand, transient renter base, plan for 1-2y turnover; 68% free/reduced lunch — lower-income household profile, screen leases tightly.
- Market conditions: Rents flat; 219 active listings in the ZIP; 40 comparable units currently listed for rent nearby; rentals at typical pace (median 25d on market — plan ~3-4 weeks tenant-placement turnaround); 710 units permitted in Orleans Parish in 2024 (244 in 5+ unit buildings).
- This rent runs 39% of the median local income ($61k/yr) — at the standard rent-burdened threshold; future hikes will face affordability resistance.
Forward outlook
- Local home prices are declining (-3.0%/yr); year-one equity from $684 of loan paydown is wiped out by about $3k of value loss. Plan a longer hold.
- Orleans County population projected at +61% by 2050 — long-run rental-demand tailwind backs the buy-and-hold thesis.
- At projected returns (-3.0% appreciation + 0.7% rent growth), your $28k cash investment doubles in ~8 years — after that, you're playing with house money.
Negotiation context
- It's been on market 182 days — a 12% lower offer ($87k) is reasonable based on typical stale-listing flexibility.
- 18 sale attempts since 22y ago with the ask held roughly flat each time — persistent listings suggest the price (not the market) is what's stuck; bring a comps-based counter.
Risks & watch-outs
- Watch-outs: flood insurance adds $427/mo; built in 1946 — expect roof / HVAC / electrical / plumbing capex.
- Climate carrying-cost: in FEMA flood zone AE (mandatory federal flood insurance); severe wind risk, 99% chance of damaging wind over 30y; extreme-heat days projected 7→20/yr by 2055 (HVAC capex compounding) — expect insurance premiums to compound above CPI over the hold.
Questions for the listing agent
- It's been on market 182 days. Have you received any prior offers? Is the seller open to a 12% concession, seller financing, or rate buy-down credit?
- Built in 1946 — when were the roof, HVAC, electrical panel, plumbing, and water heater last replaced?
- What's the actual annual flood-insurance premium (NFIP or private), and is the property in a SFHA with mandatory coverage?
- Why hasn't it sold? Are there any deal-killer items the seller is aware of (foundation, flood, title, zoning, code violations)?
- Is there a deadline driving the sale (1031 exchange, divorce, estate, relocation)? That informs how much negotiation room exists.
- What's the average days-on-market for RENTAL listings here right now (not sales)? A rising rental-DOM trend means longer vacancies and softer asking-rent achievability than the comps imply.
- What's the recent tenant-quality profile in this submarket — average credit score on applications, eviction rate, late-payment / NSF rate, and stable-employment percentage? A property-management company in the area should have these aggregated.
- How much new for-sale + rental construction is in the pipeline within 1–3 miles? Heavy new supply typically softens prices + rents 12–24 months out; constrained supply supports both.
Investment metrics
- 1% rule
- 2.00% ✓
- Cap rate
- 17.04%
- Cash-on-cash
- 38.38%
- DSCR
- 2.71
- GRM
- 4.2
CMA / ARV
- ARV (median comp)
- $180,673
- List price
- $99,000
- Delta
- -45.21%
- Verdict
- UNDERPRICED
- Comps
- 20 within 1.0 mi
Show comp detail 7 sales within ~0.75 mi
| Address | Dist | Beds/Ba | Sqft | Sold | Price | $/sf | Match |
|---|---|---|---|---|---|---|---|
| 2604 S Dorgenois St | 0.49mi | 3/2.0 (-1) | 1,104 (-2%) | 7mo | $80,000 | $72 | 63 |
| 3025 Toledano St | 0.28mi | 3/2.0 (-1) | 1,239 (+10%) | 14mo | $105,000 | $85 | 54 |
| 2308 Magnolia St | 0.30mi | 3/2.0 (-1) | 1,023 (-9%) | 15mo | $199,000 | $195 | 53 |
| 2516 Delachaise St | 0.67mi | 3/2.0 (-1) | 1,183 (+5%) | 11mo | $104,000 | $88 | 47 |
| 2130 1st St | 0.65mi | 3/2.0 (-1) | 1,080 (-4%) | 15mo | $170,000 | $157 | 45 |
| 3702 Toledano St | 0.50mi | 3/2.0 (-1) | 1,285 (+14%) | 12mo | $240,000 | $187 | 39 |
| 2824 Milan St | 0.68mi | 3/2.0 (-1) | 1,200 (+6%) | 21mo | $275,525 | $230 | 35 |
Match score weights: distance 35% · size 25% · config 20% · recency 20%. Top-matched comps best support the ARV.
Projected returns pro-forma
-3.0% appreciation · 0.73% rent growth · sell at horizon
- IRR
- 8.7%
- Equity multiple
- 1.33×
- Total profit
- $9,124
- Equity at exit
- $14,761
- IRR
- 15.2%
- Equity multiple
- 2.06×
- Total profit
- $29,492
- Equity at exit
- $8,560
Cash invested: $27,720 (down + closing). Projections, not guarantees.
Landlord ↔ Tenant lean methodology
- Overall (STATE)
- 90 Strongly Landlord-Friendly
- State Louisiana
- 90 Strongly Landlord-Friendly · R+12
- County
- — inherits STATE
- City
- — inherits STATE
ZIP-level market 70125
- Home prices YoY
- -16.3%
- Rents YoY
- 0.7%
- Active inventory
- 219
- Price-to-rent
- 4.2×
Monthly cashflow live
- Estimated rent
- $1,983 high interval (Pro) →
- Mortgage (P&I)
- −$519
- Tax from tax record
- −$120 /mo · $1,435/yr
- Insurance
- −$41
- Flood insurance flood zone
- −$427 /mo · $5,118/yr
- HOA
- −$0
- Vacancy / Maint / Mgmt
- −$416
- Net cashflow
- $460
Break-even live
Sensitivity live
| Price | -10% $516 | -5% $488 | +0% $460 | +5% $432 | +10% $404 |
|---|---|---|---|---|---|
| Rent | -10% $303 | -5% $382 | +0% $460 | +5% $538 | +10% $617 |
| Rate | -1.0pp $510 | -0.5pp $485 | base $460 | +0.5pp $434 | +1.0pp $408 |
UW: 25.0% down · 7.5% · 30yr · 1.5% tax · 5.0% vac · 8.0% maint · 8.0% mgmt
Financing live
Cash to close
- Down payment
- $24,750
- Closing costs
- $2,970
- Reserves months
- —
- Total cash needed
- —
Loan-product check · same deal, 3 products live
Conventional
25% down · 7.5% · 30yr
- Down + closing
- —
- Monthly P&I
- —
- Monthly cashflow
- —
- DSCR
- —
- Eligible?
- —
Personal DTI + credit; lowest rate.
DSCR
20% down · 8.5% · 30yr
- Down + closing
- —
- Monthly P&I
- —
- Monthly cashflow
- —
- DSCR
- —
- Eligible?
- —
No personal income docs; deal must DSCR.
Hard money
10% down · 12.0% · 12mo
- Down + closing
- —
- Monthly P&I
- —
- Monthly cashflow
- —
- DSCR
- —
- Eligible?
- —
Short-term bridge; refi at stabilization.
Rent comps 40 comps
| Address | Beds | Baths | Sqft | Rent | $/sqft | DOM | Units | Dist |
|---|---|---|---|---|---|---|---|---|
| 3108 Second St New Orleans, LA | 3.0 | 3.0 | 1216 | $2,100 | $1.73 | 4d | 1 | 0.07mi |
| 3122 2nd St New Orleans, LA | 3.0 | 3.0 | 1206 | $2,075 | $1.72 | 24d | 1 | 0.08mi |
| 3120 Second St New Orleans, LA | 3.0 | 3.0 | 1256 | $2,050 | $1.63 | 24d | 1 | 0.08mi |
| 2341 S Roman St Unit U New Orleans, LA | 3.0 | 2.0 | 1000 | $1,850 | $1.85 | 24d | 1 | 0.09mi |
| 3204 2nd St New Orleans, LA | 3.0 | 2.0 | 850 | $1,295 | $1.52 | 24d | 1 | 0.11mi |
| 2628 S Derbigny St New Orleans, LA | 3.0 | 1.0 | 900 | $1,500 | $1.67 | 4d | 1 | 0.15mi |
| 3218 Jackson Ave New Orleans, LA | 3.0 | 2.0 | 1267 | $1,750 | $1.38 | 24d | 1 | 0.19mi |
| 3322 Third St New Orleans, LA | 3.0 | 2.0 | 950 | $1,450 | $1.53 | 24d | 1 | 0.21mi |
| 2620 S Galvez St Apt 2B New Orleans, LA | 3.0 | 1.0 | 1000 | $1,100 | $1.10 | 18d | 1 | 0.28mi |
| 2833 S Derbigny St New Orleans, LA | 3.0 | 2.0 | 1500 | $1,795 | $1.20 | 24d | 1 | 0.28mi |
| 2722 Martin L King Bl New Orleans, LA | 3.0 | 2.5 | 1350 | $1,800 | $1.33 | 24d | 1 | 0.32mi |
| 2606 S Miro St New Orleans, LA | 3.0 | 2.0 | 1450 | $2,016 | $1.39 | 24d | 1 | 0.34mi |
| 3230 Toledano St New Orleans, LA | 3.0 | 2.0 | 950 | $1,750 | $1.84 | 24d | 1 | 0.37mi |
| 3632 First St Unit A New Orleans, LA | 3.0 | 2.0 | 950 | $1,850 | $1.95 | 13d | 1 | 0.37mi |
| 3632 First St Unit B New Orleans, LA | 3.0 | 2.0 | 950 | $1,750 | $1.84 | 13d | 1 | 0.37mi |
| 3617 Fourth St Unit A New Orleans, LA | 3.0 | 2.0 | 1225 | $1,995 | $1.63 | 18d | 1 | 0.39mi |
| 2526 Martin Luther King Junior Blvd New Orleans, LA | 3.0 | 2.0 | 1200 | $2,200 | $1.83 | 4d | 1 | 0.42mi |
| 3208 Louisiana Avenue Pkwy New Orleans, LA | 3.0 | 2.0 | 1391 | $1,900 | $1.37 | 18d | 1 | 0.42mi |
| 1614 Rev John Raphael Jr Way New Orleans, LA | 3.0 | 2.0 | 1000 | $1,500 | $1.50 | 24d | 1 | 0.50mi |
| 2123 S Liberty St Unit 2125 New Orleans, LA | 3.0 | 2.0 | 1500 | $2,100 | $1.40 | 4d | 1 | 0.51mi |
| 3514 S Miro St New Orleans, LA | 3.0 | 2.0 | 1230 | $1,950 | $1.59 | 18d | 1 | 0.53mi |
| 3511 S Miro St New Orleans, LA | 3.0 | 1.0 | 802 | $1,000 | $1.25 | 24d | 1 | 0.53mi |
| 2318 Martin Luther King Junior Blvd New Orleans, LA | 3.0 | 2.0 | 1400 | $1,700 | $1.21 | 24d | 1 | 0.55mi |
| 2225 2nd St New Orleans, LA | 3.0 | 2.0 | 1100 | $1,800 | $1.64 | 24d | 1 | 0.56mi |
| 3435 Magnolia St New Orleans, LA | 3.0 | 1.0 | 1050 | $1,500 | $1.43 | 24d | 1 | 0.58mi |
| 2717 Loyola Ave New Orleans, LA | 3.0 | 2.0 | 1232 | $2,300 | $1.87 | 24d | 1 | 0.62mi |
| 2717 Loyola Ave New Orleans, LA | 3.0 | 2.0 | 1250 | $2,300 | $1.84 | 3d | 1 | 0.62mi |
| 4206 S Derbigny St New Orleans, LA | 3.0 | 1.0 | 1300 | $1,600 | $1.23 | 24d | 1 | 0.63mi |
| 3829 General Taylor St New Orleans, LA | 3.0 | 1.0 | 1000 | $1,300 | $1.30 | 24d | 1 | 0.63mi |
| 2119 Josephine St New Orleans, LA | 3.0 | 1.0 | 1017 | $950 | $0.93 | 22d | 1 | 0.64mi |
| 2539 Amelia St New Orleans, LA | 3.0 | 2.0 | 1296 | $2,200 | $1.70 | 24d | 1 | 0.65mi |
| 4305 S Johnson St Unit 4305 New Orleans, LA | 3.0 | 1.0 | 1175 | $1,595 | $1.36 | 13d | 1 | 0.66mi |
| 2102 Josephine St New Orleans, LA | 4.0 | 2.0 | 1286 | $2,100 | $1.63 | 24d | 1 | 0.66mi |
| 2107 Fourth St New Orleans, LA | 3.0 | 1.0 | 1292 | $1,775 | $1.37 | 18d | 1 | 0.67mi |
| 2032 Saint Andrew St New Orleans, LA | 3.0 | 2.0 | 1035 | $1,830 | $1.77 | 18d | 1 | 0.69mi |
| 2535 Marengo St New Orleans, LA | 3.0 | 1.0 | 1300 | $1,200 | $0.92 | 15d | 1 | 0.74mi |
| 1915 Philip St New Orleans, LA | 3.0 | 1.5 | 1300 | $2,450 | $1.88 | 24d | 1 | 0.75mi |
| 2733 Danneel St New Orleans, LA | 4.0 | 2.0 | 1350 | $1,775 | $1.31 | 24d | 1 | 0.76mi |
| 2232 Amelia St New Orleans, LA | 3.0 | 2.0 | 900 | $1,800 | $2.00 | 18d | 1 | 0.83mi |
| 4611 S Claiborne Ave Unit 4609 New Orleans, LA | 3.0 | 2.0 | 1200 | $1,995 | $1.66 | 24d | 1 | 0.91mi |
Listing history 30 events
-
2026-06-05days on market $99,000 Active 182 DOM
-
2026-06-03days on market $99,000 Active 181 DOM
-
2026-06-02days on market $99,000 Active 180 DOM
-
2026-06-01days on market $99,000 Active 179 DOM
-
2026-05-31days on market $99,000 Active 178 DOM
-
2025-12-04$99,000 Active 83-char remark
Show marketing remark (83 chars)
FORMER DOUBLE CONVERTED TO A SINGLE. HAS BEEN VACANT FOR OVER 6 MONTHS, NEEDS WORK.
-
2025-12-04$99,000 Active 83-char remark
Show marketing remark (83 chars)
FORMER DOUBLE CONVERTED TO A SINGLE. HAS BEEN VACANT FOR OVER 6 MONTHS, NEEDS WORK.
-
2021-03-01soldstatus $102,129 Closed
-
2021-02-22status Pending
-
2021-02-01status Active
-
2021-01-28status Pending
-
2021-01-11$99,000
-
2021-01-11$99,000 Active
-
2018-09-08historical
-
2018-08-03status Active
-
2018-07-26status Under Contract
-
2018-06-27$79,900 Active
-
2018-06-27$79,900
-
2011-11-11$69,000
-
2011-11-11$84,500
-
2011-11-11$69,000
-
2011-11-11$84,500
-
2011-05-11$89,000
-
2011-05-11$99,900
-
2011-05-11$89,000
-
2011-05-11$99,900
-
2007-05-10soldstatus $128,000
-
2005-02-23soldstatus $30,000
-
2004-11-30$34,900
-
2004-11-30$34,900
ⓘ Source: listings_history table (triggers on properties + properties_extension) + one-shot
backfill from property_details.listing_events for pre-trigger history.
Tax reassessment forecast LA · Resets to sale price
- Current annual tax
- $1,435 · $120/mo
- Projected year-2 tax
- $1,435 · $120/mo
- Expected delta
- $0/yr ($0/mo · 0.0%)
ⓘ Screening estimate from a state-policy table — verify with the county assessor before closing.
Climate risk First Street
- Flood 8/10 Severe FEMA zone AE · 78% chance over 30 yrs
- Wildfire 1/10 Low
- Heat 10/10 Extreme 7 d/yr ≥108°F today · 20 d/yr by 30 yrs out
- Wind 10/10 Extreme 99% chance of damaging wind over 30 yrs
- Air quality 3/10 Moderate 3 unhealthy d/yr today · 4 by 30 yrs out
Nearby sold comps map
Loading sold comps map…
Walkable amenities ~0.75 mi
Loading nearby amenities…
Taxation est. · year 1
- Rental income
- $23,798
- − Mortgage interest
- −$5,546
- − Property taxes
- −$1,435
- − Insurance
- −$5,614
- − Repairs & maintenance
- −$1,904
- − Management
- −$1,904
- − Depreciation
- −$2,880
- Taxable income
- $4,516
- Est. tax owed @ 24.0%
- −$1,084
- After-tax cash flow
- $4,438/yr
For passive investors: Depreciation is non-cash, so a rental often shows a tax loss while cash-flowing — sheltering income. Rental losses are passive: they offset passive income freely, and up to $25,000/yr can offset ordinary (W-2) income if you actively participate and your MAGI is under $100k (phasing out to $0 by $150k); unused losses carry forward. On sale, claimed depreciation is recaptured at up to 25%, and gains may owe capital-gains tax (a 1031 exchange can defer both). Figures are a year-1 estimate at your 24.0% rate — not tax advice; consult a CPA.
Schools (NCES district)
- District
- Orleans Parish
- NCES district ID
- 2201170
- Math proficiency
- 11% ▼ -52.00%
- Reading proficiency
- 27% ▼ -46.00%
- Median HH income
- $37,011
- Composite
- 15.78/100
- National rank
- #9271
- State rank
- #69 of 98 in LA
Livability — New Orleans
- Score
- 81/100
- State rank
- #3
- US rank
- #1383
Category grades
Schools grade is shown separately in the Schools card above.
Census & demographics
- Census place
- New Orleans, LA
- County
- Orleans Parish · 338,817 people
- City population
- 338,817
- Metro
- New Orleans-Metairie, LA
- Population (ZIP)
- 17,821
- Household income
- $61,174
- Rent vs Own
- Severe rent burden
- 1270.0
Population outlook (Orleans County) Hauer SSP2
- Today (2025)
- 513,025 people
- By 2030
- 575,781 · +12.2%
- By 2040
- 700,174 · +36.5%
- By 2050
- 826,541 · +61.1%
- By 2075
- 1,123,374 · +119.0%
- By 2100
- 1,355,609 · +164.2%
Race, ethnicity, and origin ACS 2023
- Neighborhood character
- Diverse neighborhood (Simpson 0.63)
- Race & ethnicity
- Black 51% White 32% Hispanic / Latino 9% Two or more races 9% Asian 2% Native American 1%
- Hispanic origin (detail)
- Mexican 2%
- Common ancestry
- Lithuanian 8% Romanian 1% Slovak 1%
- Foreign-born
- 7% · Canada, China
- Languages at home
- 90% English-only · Spanish 6% French/Haitian/Cajun 1% Chinese 1%
Political lean MEDSL · Orleans
- 2024 margin
- Solid D (+67.0) · D 82.2% · R 15.2% · Other 2.7%
- 2008→2024 swing
- +6.7pp toward D · 2008: 60.3pp · 2024: 67.0pp
- All cycles
- 2024: D+67.0 2020: D+68.2 2016: D+66.2 2012: D+62.5 2008: D+60.3
Not yet ingested
- Civics
- —
Market trends
- HPI YoY
- ▼ -49.68%
- Current HPI
- 255.5998
- Rent YoY
- ▲ 0.73%
- Metro
- New Orleans-Metairie, LA
- State GDP YoY
- ▲ 3.29%
- F500 in state
- 10
Industry mix (Fortune 500 HQ in LA)
| Industry | F500 HQs | Revenue |
|---|---|---|
| Telecommunications | 2 | $23B |
|
||
| Utilities | 1 | $12B |
|
||
| Wholesale / Distribution | 1 | $5B |
|
||
| Advertising | 1 | $2B |
|
||
Price history
+183.7% since first listed25 events — show timeline
- 2025-12-04 Listed $99,000 AcadianaMLS
- 2025-12-04 Listed $99,000 GSREIN
- 2021-03-01 Sold (MLS) $102,129 GSREIN
- 2021-02-22 Pending — GSREIN
- 2021-02-01 Relisted — GSREIN
- 2021-01-28 Pending — GSREIN
- 2021-01-11 Listed $99,000 GSREIN
- 2021-01-11 Listed $99,000 AcadianaMLS
- 2018-09-08 Listing Removed — GSREIN
- 2018-08-03 Relisted — GSREIN
- 2018-07-26 Pending — GSREIN
- 2018-06-27 Listed $79,900 AcadianaMLS
- 2018-06-27 Listed $79,900 GSREIN
- 2011-11-11 Listed $84,500 GSREIN
- 2011-11-11 Listed $69,000 GSREIN
- 2011-11-11 Listed $84,500 AcadianaMLS
- 2011-11-11 Listed $69,000 AcadianaMLS
- 2011-05-11 Listed $99,900 GSREIN
- 2011-05-11 Listed $89,000 GSREIN
- 2011-05-11 Listed $99,900 AcadianaMLS
- 2011-05-11 Listed $89,000 AcadianaMLS
- 2007-05-10 Sold (Public Records) $128,000 Public Records
- 2005-02-23 Sold (MLS) $30,000 GSREIN
- 2004-11-30 Listed $34,900 AcadianaMLS
- 2004-11-30 Listed $34,900 GSREIN
Property tax history
+1.8%/yrLatest (2026): $1,435 · +1.1% YoY. Source: county tax records.
Cash-flow waterfall
monthlySold comps — $/sqft
last 12 mo · ≤1 miLoading sold comps…