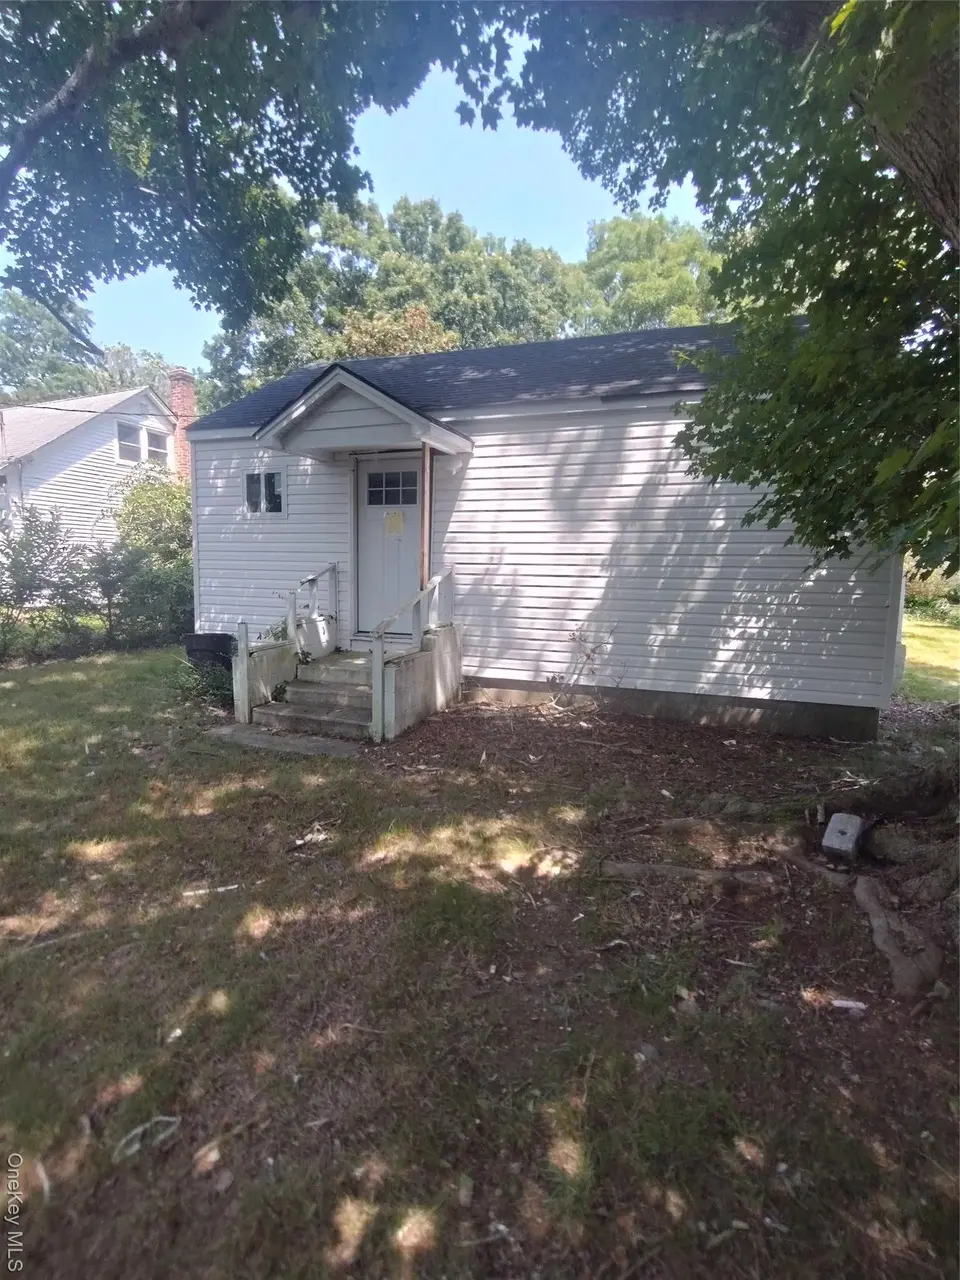
121 Woodland Dr · Mastic Beach, NY
Flood risk 1/10 · Minimal
- FEMA flood zone
- X (unshaded)
- Chance of flooding over 30 yrs
- 0.0%
- Est. flood insurance / yr
- $473 – $860
Fire risk 2/10 · Minimal
- Est. fire insurance / yr
- $691 – $1,283
Heat risk 4/10 · Minor
- Hot days now (above 91°F)
- 7 days/yr
- Hot days in 30 yrs
- 19 days/yr
Wind risk 8/10 · Major
- Chance of severe wind over 30 yrs
- 80.0%
Air-quality risk 4/10 · Minor
- Unhealthy air days now
- 3 days/yr
- Unhealthy air days in 30 yrs
- 5 days/yr
Risk factors via First Street. Map © Google.
Why this score? — see what drove the D+ grade
The composite is a weighted blend of 9 inputs, each scored 0–100. Each bar is that input's sub-score; the figure is the points it added to the 100-point composite (weight × sub-score).
- ARV discount +15.0/15.0
- Appreciation +10.0/10.0
- Cash flow +6.9/30.0
- Schools +4.7/10.0
- Livability +3.1/5.0
- Rent growth +2.5/5.0
- Condition / age +2.5/5.0
- 1% rule +1.2/10.0
- DSCR +1.1/10.0
$300,000
🖨 Deal sheet 📄 Offer letter ✓ Due diligence
Listing remarks MLS
Sold AS IS seller makes no representations, buyers to do due diligence!! Renovated and 85% complete maintenance free exterior cozy Ranch with 2 large bedrooms New ceramic tiled full bath , updated everything! Plus a huge lot! Goes from one street to the next! Possibly room for expansion! Possible to apply to connect to newly constructed sewers in area, verify if zone is complete. LOW taxes w/ STAR approx $4809.29! There is a violation from town/ buyer assuming with any open permits or violations. Seller requests Cash sale or HM only. A little more work and this can be a great investment or fairly inexpensive living! VERIFY ALL INFO SUPPLIED
Key facts
- Room for expansion
- Huge lot
- 3,920 sq ft lot
Tags
Neighborhood map
What this means for you Summary
Snapshot
- This is a 2-bed/1.0-bath single-family listed at $300k.
Deal economics
- At list price, monthly cash flow is $-458 ($-6k/yr) — negative.
- To cash-flow at today's rent, offer at most $219k (27.0% below list).
- To meet the 1% rule (rent ≥ 1% of price), the offer needs to be $185k (38.5% below list).
- Recommended offer: $185k (38.5% below list) — sets the bar for 1% rule.
Location & tenants
- Location reads 61/100 on livability (#936 in NY) — a middle-class / working-renter tenant base. Strengths: employment A+, housing A+; Watch: schools D, crime D, amenities F.
- William Floyd Union Free School District (suburban): math 48% / reading 57% proficiency, ranked #309 of 590 in NY (top 52%) — acceptable for families but not a draw, mixed tenant base, ~2y average lease.
- Market conditions: 133 active listings in the ZIP; 1,366 units permitted in Suffolk County in 2024 (216 in 5+ unit buildings).
Forward outlook
- In year one you build about $32k of equity ($2k loan paydown + $30k appreciation (10.0% local appreciation)).
- Suffolk County population projected to shrink 5% by 2050 — rents likely to lag national; underwrite the cash flow, not the appreciation.
- By year 2, paydown + projected appreciation supports a ~$52k cash-out refi (75% LTV) — recoverable capital for the next deal without selling this one.
Negotiation context
- It's been on market 295 days — a 12% lower offer ($264k) is reasonable based on typical stale-listing flexibility.
- 4 sale attempts since 11y ago with the ask held roughly flat each time — persistent listings suggest the price (not the market) is what's stuck; bring a comps-based counter.
- Current owner paid $50k; list at $300k implies a 500% gain — meaningful room to come down on a strong offer.
Risks & watch-outs
- Watch-outs: built in 1940 — expect roof / HVAC / electrical / plumbing capex.
- Climate carrying-cost: severe wind risk, 80% chance of damaging wind over 30y — expect insurance premiums to compound above CPI over the hold.
Questions for the listing agent
- What do current leases actually rent for vs. the listed asking? Can we see a recent rent roll and the last 12 months of T-12 income?
- It's been on market 295 days. Have you received any prior offers? Is the seller open to a 38% concession, seller financing, or rate buy-down credit?
- Built in 1940 — when were the roof, HVAC, electrical panel, plumbing, and water heater last replaced?
- Why hasn't it sold? Are there any deal-killer items the seller is aware of (foundation, flood, title, zoning, code violations)?
- Is there a deadline driving the sale (1031 exchange, divorce, estate, relocation)? That informs how much negotiation room exists.
- Schools are D-rated, which usually means shorter tenancies and higher turnover. Who's the typical renter profile here, and what's been the actual vacancy rate?
- Crime grade is D in this area — have there been break-ins, vandalism, or insurance claims at this property in the last 3 years? What carrier currently insures it and at what premium?
- The area grade is low — what's the realistic commute time and amenity access for the typical tenant pool here? Any planned neighborhood developments (good or bad) we should know about?
- What's the average days-on-market for RENTAL listings here right now (not sales)? A rising rental-DOM trend means longer vacancies and softer asking-rent achievability than the comps imply.
- What's the recent tenant-quality profile in this submarket — average credit score on applications, eviction rate, late-payment / NSF rate, and stable-employment percentage? A property-management company in the area should have these aggregated.
- How much new for-sale + rental construction is in the pipeline within 1–3 miles? Heavy new supply typically softens prices + rents 12–24 months out; constrained supply supports both.
Investment metrics
- 1% rule
- 0.62% ✗
- Cap rate
- 4.46%
- Cash-on-cash
- -6.55%
- DSCR
- 0.71
- GRM
- 13.5
CMA / ARV
- ARV (median comp)
- $436,540
- List price
- $300,000
- Delta
- -31.28%
- Verdict
- UNDERPRICED
- Comps
- 20 within 1.0 mi
Projected returns pro-forma
10.0% appreciation · 3.0% rent growth · sell at horizon
- IRR
- 19.6%
- Equity multiple
- 2.60×
- Total profit
- $134,122
- Equity at exit
- $270,264
- IRR
- 18.0%
- Equity multiple
- 5.97×
- Total profit
- $417,791
- Equity at exit
- $582,834
Cash invested: $84,000 (down + closing). Projections, not guarantees.
Landlord ↔ Tenant lean methodology
- Overall (STATE)
- 15 Strongly Tenant-Friendly
- State New York
- 15 Strongly Tenant-Friendly · D+10
- County
- — inherits STATE
- City
- — inherits STATE
ZIP-level market 11951
- Home prices YoY
- 4.3%
- Active inventory
- 133
- Price-to-rent
- 13.5×
Monthly cashflow live
- Estimated rent
- $1,845 medium interval (Pro) →
- Mortgage (P&I)
- −$1,573
- Tax from tax record
- −$218 /mo · $2,616/yr
- Insurance
- −$125
- HOA
- −$0
- Vacancy / Maint / Mgmt
- −$388
- Net cashflow
- $-458
Break-even live
UW: 25.0% down · 7.5% · 30yr · 1.5% tax · 5.0% vac · 8.0% maint · 8.0% mgmt
Financing live
Cash to close
- Down payment
- $75,000
- Closing costs
- $9,000
- Reserves months
- —
- Total cash needed
- —
Loan-product check · same deal, 3 products live
Conventional
25% down · 7.5% · 30yr
- Down + closing
- —
- Monthly P&I
- —
- Monthly cashflow
- —
- DSCR
- —
- Eligible?
- —
Personal DTI + credit; lowest rate.
DSCR
20% down · 8.5% · 30yr
- Down + closing
- —
- Monthly P&I
- —
- Monthly cashflow
- —
- DSCR
- —
- Eligible?
- —
No personal income docs; deal must DSCR.
Hard money
10% down · 12.0% · 12mo
- Down + closing
- —
- Monthly P&I
- —
- Monthly cashflow
- —
- DSCR
- —
- Eligible?
- —
Short-term bridge; refi at stabilization.
Listing history 23 events
-
2026-06-18days on market $300,000 Active 295 DOM
-
2026-06-17days on market $300,000 Active 294 DOM
-
2026-06-16days on market $300,000 Active 293 DOM
-
2026-06-15days on market $300,000 Active 292 DOM
-
2026-06-13days on market $300,000 Active 290 DOM
-
2026-06-13days on market $300,000 Active 289 DOM
-
2026-06-09days on market $300,000 Active 286 DOM
-
2026-06-08days on market $300,000 Active 285 DOM
-
2026-06-07days on market $300,000 Active 284 DOM
-
2026-06-04days on market $300,000 Active 281 DOM
-
2026-06-03days on market $300,000 Active 280 DOM
-
2026-06-02days on market $300,000 Active 279 DOM
-
2026-06-01days on market $300,000 Active 278 DOM
-
2026-05-31days on market $300,000 Active 277 DOM
-
2026-02-21status Active 648-char remark
Show marketing remark (648 chars)
Sold AS IS seller makes no representations, buyers to do due diligence!! Renovated and 85% complete maintenance free exterior cozy Ranch with 2 large bedrooms New ceramic tiled full bath , updated everything! Plus a huge lot! Goes from one street to the next! Possibly room for expansion! Possible to apply to connect to newly constructed sewers in area, verify if zone is complete. LOW taxes w/ STAR approx $4809.29! There is a violation from town/ buyer assuming with any open permits or violations. Seller requests Cash sale or HM only. A little more work and this can be a great investment or fairly inexpensive living! VERIFY ALL INFO SUPPLIED
-
2026-02-09status Pending 648-char remark
Show marketing remark (648 chars)
Sold AS IS seller makes no representations, buyers to do due diligence!! Renovated and 85% complete maintenance free exterior cozy Ranch with 2 large bedrooms New ceramic tiled full bath , updated everything! Plus a huge lot! Goes from one street to the next! Possibly room for expansion! Possible to apply to connect to newly constructed sewers in area, verify if zone is complete. LOW taxes w/ STAR approx $4809.29! There is a violation from town/ buyer assuming with any open permits or violations. Seller requests Cash sale or HM only. A little more work and this can be a great investment or fairly inexpensive living! VERIFY ALL INFO SUPPLIED
-
2025-08-15$300,000 Active 648-char remark
Show marketing remark (648 chars)
Sold AS IS seller makes no representations, buyers to do due diligence!! Renovated and 85% complete maintenance free exterior cozy Ranch with 2 large bedrooms New ceramic tiled full bath , updated everything! Plus a huge lot! Goes from one street to the next! Possibly room for expansion! Possible to apply to connect to newly constructed sewers in area, verify if zone is complete. LOW taxes w/ STAR approx $4809.29! There is a violation from town/ buyer assuming with any open permits or violations. Seller requests Cash sale or HM only. A little more work and this can be a great investment or fairly inexpensive living! VERIFY ALL INFO SUPPLIED
-
2018-03-08soldstatus $50,000
-
2018-02-06soldstatus $50,000 Closed 120-char remark
Show marketing remark (120 chars)
Small Cottage W/ 1 Bedroom Consist Of 2 Lots Total To 100X98 ( 40X98 And 60X99), Additional information: Appearance:Poor
-
2017-10-27status Under Contract 120-char remark
Show marketing remark (120 chars)
Small Cottage W/ 1 Bedroom Consist Of 2 Lots Total To 100X98 ( 40X98 And 60X99), Additional information: Appearance:Poor
-
2017-08-24$80,000 New 120-char remark
Show marketing remark (120 chars)
Small Cottage W/ 1 Bedroom Consist Of 2 Lots Total To 100X98 ( 40X98 And 60X99), Additional information: Appearance:Poor
-
2015-11-15historical
-
2015-05-29$79,000
ⓘ Source: listings_history table (triggers on properties + properties_extension) + one-shot
backfill from property_details.listing_events for pre-trigger history.
Tax reassessment forecast NY · Partial reset (capped growth)
- Current annual tax
- $2,616 · $218/mo
- Projected year-2 tax
- $3,843 · $320/mo
- Expected delta
- +$1,227/yr (+$102/mo · 46.9%)
ⓘ Screening estimate from a state-policy table — verify with the county assessor before closing.
Climate risk First Street
- Flood 1/10 Low FEMA zone X (unshaded) · 0% chance over 30 yrs
- Wildfire 2/10 Low
- Heat 4/10 Moderate 7 d/yr ≥91°F today · 19 d/yr by 30 yrs out
- Wind 8/10 Severe 80% chance of damaging wind over 30 yrs
- Air quality 4/10 Moderate 3 unhealthy d/yr today · 5 by 30 yrs out
Nearby sold comps map
Loading sold comps map…
Walkable amenities ~0.75 mi
Loading nearby amenities…
Taxation est. · year 1
- Rental income
- $22,144
- − Mortgage interest
- −$16,805
- − Property taxes
- −$2,616
- − Insurance
- −$1,500
- − Repairs & maintenance
- −$1,772
- − Management
- −$1,772
- − Depreciation
- −$8,727
- Taxable loss
- −$11,047
- Est. tax savings @ 24.0%
- +$2,651
- After-tax cash flow
- $-2,850/yr
For passive investors: Depreciation is non-cash, so a rental often shows a tax loss while cash-flowing — sheltering income. Rental losses are passive: they offset passive income freely, and up to $25,000/yr can offset ordinary (W-2) income if you actively participate and your MAGI is under $100k (phasing out to $0 by $150k); unused losses carry forward. On sale, claimed depreciation is recaptured at up to 25%, and gains may owe capital-gains tax (a 1031 exchange can defer both). Figures are a year-1 estimate at your 24.0% rate — not tax advice; consult a CPA.
Schools (NCES district)
- District
- William Floyd Union Free School District
- NCES district ID
- 3618690
- Math proficiency
- 48% ▲ 3.00%
- Reading proficiency
- 57% ▲ 11.00%
- Median HH income
- $70,564
- Composite
- 46.79/100
- National rank
- #2383
- State rank
- #309 of 590 in NY
Livability — Mastic Beach
- Score
- 61/100
- State rank
- #936
- US rank
- #18216
Category grades
Schools grade is shown separately in the Schools card above.
Census & demographics
- Census place
- Mastic Beach, NY
- City population
- 15,830
- Population (ZIP)
- 15,830
Population outlook (Suffolk County) Hauer SSP2
- Today (2025)
- 1,505,262 people
- By 2030
- 1,498,318 · -0.5%
- By 2040
- 1,471,101 · -2.3%
- By 2050
- 1,424,848 · -5.3%
- By 2075
- 1,337,157 · -11.2%
- By 2100
- 1,217,720 · -19.1%
Race, ethnicity, and origin ACS 2023
- Neighborhood character
- Predominantly White (68%)
- Race & ethnicity
- White 68% Hispanic / Latino 17% Two or more races 9% Black 6% Asian 2%
- Hispanic origin (detail)
- Mexican 1% Puerto Rican 6% Cuban 2%
- Common ancestry
- Lithuanian 3% Romanian 2% Italian 2%
- Foreign-born
- 7% · Canada, Vietnam
- Languages at home
- 84% English-only · Spanish 10% Other Indo-European 3% Chinese 1%
Political lean MEDSL · Suffolk
- 2024 margin
- Lean R (+10.0) · D 45.0% · R 55.0%
- 2008→2024 swing
- -16.0pp toward R · 2008: 6.0pp · 2024: -10.0pp
- All cycles
- 2024: R+10.0 2020: R+0.0 2016: R+8.2 2012: D+2.9 2008: D+6.0
Not yet ingested
- Civics
- —
Market trends
- HPI YoY
- ▲ 34.46%
- Current HPI
- 829.86
- Rent YoY
- —
- Metro
- —
- State GDP YoY
- ▲ 2.60%
- F500 in state
- 92
Industry mix (Fortune 500 HQ in NY)
| Industry | F500 HQs | Revenue |
|---|---|---|
| Financial Services | 10 | $950B |
|
||
| Consumer Goods | 9 | $162B |
|
||
| Insurance | 4 | $225B |
|
||
| Telecommunications | 2 | $144B |
|
||
| Pharmaceuticals | 2 | $112B |
|
||
| Media / Entertainment | 2 | $69B |
|
||
Price history
+279.7% since first listed9 events — show timeline
- 2026-02-21 Relisted — OneKey® MLS as Distributed by MLS Grid
- 2026-02-09 Pending — OneKey® MLS as Distributed by MLS Grid
- 2025-08-15 Listed $300,000 OneKey® MLS as Distributed by MLS Grid
- 2018-03-08 Sold (Public Records) $50,000 Public Records
- 2018-02-06 Sold (MLS) $50,000 OneKey® MLS as Distributed by MLS Grid
- 2017-10-27 Pending — OneKey® MLS as Distributed by MLS Grid
- 2017-08-24 Listed $80,000 OneKey® MLS as Distributed by MLS Grid
- 2015-11-15 Listing Removed — OneKey® MLS as Distributed by MLS Grid
- 2015-05-29 Listed $79,000 OneKey® MLS as Distributed by MLS Grid
Property tax history
+2.0%/yrLatest (2025): $2,616 · +0.0% YoY. Source: county tax records.
Cash-flow waterfall
monthlySold comps — $/sqft
last 12 mo · ≤1 miLoading sold comps…