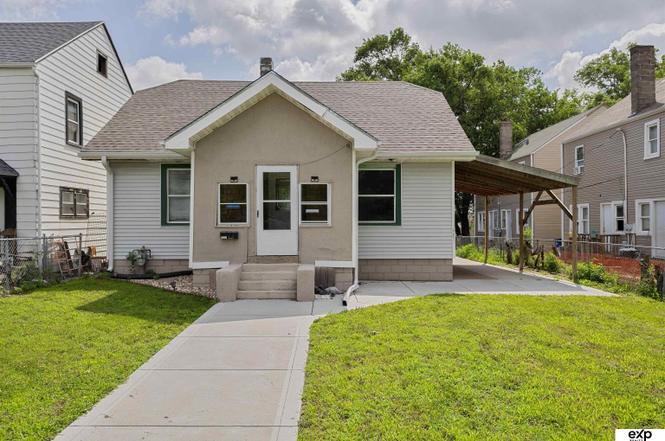
1007 S 28th St · Omaha, NE
Flood risk 1/10 · Minimal
- FEMA flood zone
- X (unshaded)
- Chance of flooding over 30 yrs
- 0.0%
- Est. flood insurance / yr
- $473 – $860
Fire risk 1/10 · Minimal
- Est. fire insurance / yr
- $1,161 – $2,155
Heat risk 3/10 · Minor
- Hot days now (above 103°F)
- 7 days/yr
- Hot days in 30 yrs
- 15 days/yr
Wind risk 2/10 · Minimal
- Chance of severe wind over 30 yrs
- —
Air-quality risk 2/10 · Minimal
- Unhealthy air days now
- 0 days/yr
- Unhealthy air days in 30 yrs
- 1 days/yr
Risk factors via First Street. Map © Google.
Why this score? — see what drove the C grade
The composite is a weighted blend of 9 inputs, each scored 0–100. Each bar is that input's sub-score; the figure is the points it added to the 100-point composite (weight × sub-score).
- Cash flow +25.1/30.0
- DSCR +8.2/10.0
- ARV discount +7.5/15.0
- 1% rule +6.2/10.0
- Livability +4.2/5.0
- Rent growth +3.4/5.0
- Condition / age +2.5/5.0
- Schools +2.1/10.0
- Appreciation +0.0/10.0
$180,000
🖨 Deal sheet 📄 Offer letter ✓ Due diligence
Listing remarks
Conveniently located just minutes from downtown Omaha, the world-renowned Henry Doorly Zoo and Aquarium, restaurants, shopping, and entertainment, this 3-bedroom, 1 3/4 bath home offers a fantastic opportunity for homeowners and investors alike. Featuring a functional 1.5 story layout, this property is full of character and potential. Enjoy easy access to major employers, schools, parks, and all that Omaha has to offer. The home is being sold as-is with all appliances included, with the seller making no repairs or improvements. Whether you're looking for a starter home, rental property, or renovation project, this centrally located home is worth a look!
Key facts
- Entertainment
- Downtown omaha
- Henry doorly zoo
Tags
Property features AI
Exterior
- Parking: Detached covered garage (1 car); Total parking for 1 vehicle
- Utilities: Public water; Public sewer
- Home design: Single-family residence; One and one-half stories; Built in 1921; Living area above grade approx. 1,198 (total living area approx. 1,598); below-grade finished area approx. 400
- Construction: Block foundation; Year built: 1921
- Exterior features: Enclosed porch; Chain link fencing; Lot up to 1/4 acre (approximately 0.14 acres, dimensions ~140 x 44)
Interior
- Kitchen: Kitchen located on the main floor
- Bedrooms: Primary bedroom on the main floor; Additional bedrooms on main and second floors
- Bathrooms: Two bathrooms total — one full bath and one three-quarter bath; Main level has a full bathroom; basement includes an additional bathroom
- Heating & cooling: Natural gas forced-air heating; Central air conditioning
- Interior features: Partially finished basement (approx. 400 finished below-grade square feet); No fireplaces listed
Neighborhood map
What this means for you Summary
Snapshot
- This is a 4-bed/1.0-bath other listed at $180k.
Deal economics
- At list price, monthly cash flow is $399 ($5k/yr) — positive.
- The deal already cash-flows at list — no discount required.
- Meets the 1% rule at list price ($2k rent vs $180k).
- Cap rate 9.0% vs local median 3.6% in Omaha — top-decile yield for the area; either an underpriced asset or a hidden risk that comps aren't pricing in. Stress-test before assuming the spread holds.
Location & tenants
- Location reads 84/100 on livability (#7 in NE, #663 nationally) — a professional / high-income tenant draw. Strengths: amenities A+, commute A+, cost of living A+; Watch: crime F.
- Omaha Public Schools (urban): math 20% / reading 28% proficiency, ranked #110 of 111 in NE (top 99%) — low school quality limits family demand, transient renter base, plan for 1-2y turnover; 62% free/reduced lunch — lower-income household profile, screen leases tightly.
- Zoned schools: Field Club Elementary School (math 12% / reading 25%, grade F, #467 of 502 statewide, top 93%, 581 students, 0% FRL); Norris Middle School (math 11% / reading 16%, grade F, #126 of 128 statewide, top 98%, 1,187 students, 0% FRL); Central High School (math 29% / reading 40%, grade F, #208 of 261 statewide, top 86%, 2,738 students, 0% FRL) — zoned schools average 0% FRL vs 62% district-wide (62 pts lower); this property's tenant base skews higher-income than the district average.
- Market conditions: Rents rising (+3.7%/yr); 124 active listings in the ZIP; 17 comparable units currently listed for rent nearby; rentals at typical pace (median 15d on market — plan ~3-4 weeks tenant-placement turnaround); 4,539 units permitted in Douglas County in 2024 (2,583 in 5+ unit buildings).
- This rent runs 42% of the median local income ($58k/yr) — at the standard rent-burdened threshold; future hikes will face affordability resistance.
Forward outlook
- Local home prices are declining (-3.0%/yr); year-one equity from $1k of loan paydown is wiped out by about $5k of value loss. Plan a longer hold.
- Douglas County population projected at +28% by 2050 — long-run rental-demand tailwind backs the buy-and-hold thesis.
Negotiation context
- Only 6 days on market — expect competitive offers; lowballing is unlikely to land.
Risks & watch-outs
- Watch-outs: built in 1921 — expect roof / HVAC / electrical / plumbing capex.
Questions for the listing agent
- Built in 1921 — when were the roof, HVAC, electrical panel, plumbing, and water heater last replaced?
- Is there a deadline driving the sale (1031 exchange, divorce, estate, relocation)? That informs how much negotiation room exists.
- Crime grade is F in this area — have there been break-ins, vandalism, or insurance claims at this property in the last 3 years? What carrier currently insures it and at what premium?
- What's the average days-on-market for RENTAL listings here right now (not sales)? A rising rental-DOM trend means longer vacancies and softer asking-rent achievability than the comps imply.
- What's the recent tenant-quality profile in this submarket — average credit score on applications, eviction rate, late-payment / NSF rate, and stable-employment percentage? A property-management company in the area should have these aggregated.
- How much new for-sale + rental construction is in the pipeline within 1–3 miles? Heavy new supply typically softens prices + rents 12–24 months out; constrained supply supports both.
Investment metrics
- 1% rule
- 1.12% ✓
- Cap rate
- 8.95%
- Cash-on-cash
- 9.50%
- DSCR
- 1.42
- GRM
- 7.5
CMA / ARV
No comps found within radius.
Projected returns pro-forma
-3.0% appreciation · 3.66% rent growth · sell at horizon
- IRR
- -1.3%
- Equity multiple
- 0.95×
- Total profit
- $-2,410
- Equity at exit
- $26,839
- IRR
- 9.1%
- Equity multiple
- 1.72×
- Total profit
- $36,207
- Equity at exit
- $15,563
Cash invested: $50,400 (down + closing). Projections, not guarantees.
Landlord ↔ Tenant lean methodology
- Overall (STATE)
- 83 Strongly Landlord-Friendly
- State Nebraska
- 83 Strongly Landlord-Friendly · R+13
- County
- — inherits STATE
- City
- — inherits STATE
ZIP-level market 68105
- Rents YoY
- 3.7%
- Active inventory
- 124
- Price-to-rent
- 7.5×
Monthly cashflow live
- Estimated rent
- $2,011 high interval (Pro) →
- Mortgage (P&I)
- −$944
- Tax from tax record
- −$170 /mo · $2,045/yr
- Insurance
- −$75
- HOA
- −$0
- Vacancy / Maint / Mgmt
- −$422
- Net cashflow
- $399
Break-even live
UW: 25.0% down · 7.5% · 30yr · 1.5% tax · 5.0% vac · 8.0% maint · 8.0% mgmt
Financing live
Cash to close
- Down payment
- $45,000
- Closing costs
- $5,400
- Reserves months
- —
- Total cash needed
- —
Loan-product check · same deal, 3 products live
Conventional
25% down · 7.5% · 30yr
- Down + closing
- —
- Monthly P&I
- —
- Monthly cashflow
- —
- DSCR
- —
- Eligible?
- —
Personal DTI + credit; lowest rate.
DSCR
20% down · 8.5% · 30yr
- Down + closing
- —
- Monthly P&I
- —
- Monthly cashflow
- —
- DSCR
- —
- Eligible?
- —
No personal income docs; deal must DSCR.
Hard money
10% down · 12.0% · 12mo
- Down + closing
- —
- Monthly P&I
- —
- Monthly cashflow
- —
- DSCR
- —
- Eligible?
- —
Short-term bridge; refi at stabilization.
Rent comps 17 comps
| Address | Beds | Baths | Sqft | Rent | $/sqft | DOM | Units | Dist |
|---|---|---|---|---|---|---|---|---|
| 806 Park Ave Omaha, NE | 3.0 | 3.0 | 1650 | $2,395 | $1.45 | 23d | 2 | 0.18mi |
| 554 S 26th Ave Omaha, NE | 3.0 | 1.0 | 1484 | $1,400 | $0.94 | 3d | 1 | 0.24mi |
| 542 S 29th St Omaha, NE | 3.0 | 1.5 | 1442 | $1,750 | $1.21 | 14d | 1 | 0.27mi |
| 528 S 26th Ave Ste B Omaha, NE | 4.0 | 1.0 | 1748 | $1,650 | $0.94 | 3d | 1 | 0.30mi |
| 3001 Harney St Omaha, NE | 3.0 | 3.0 | 1764 | $2,395 | $1.36 | 43d | 1 | 0.42mi |
| 106 S 36th St Omaha, NE | 3.0 | 3.0 | 1750 | $2,275 | $1.30 | 3d | 1 | 0.92mi |
| 132 N 35th Ave Omaha, NE | 5.0 | 2.0 | 1959 | $2,550 | $1.30 | 43d | 1 | 0.95mi |
| 411 S 38th Ave Omaha, NE | 3.0 | 3.0 | 1872 | $1,995 | $1.07 | 43d | 1 | 0.98mi |
| 2929 California St Omaha, NE | 1.0–4.0 | 1.0–3.0 | 1280 | $3,340 | $2.61 | 3d | 118 | 0.98mi |
| 110 N 38th St Unit 110 Omaha, NE | 3.0 | 2.0 | 1600 | $1,750 | $1.09 | 23d | 1 | 1.05mi |
| 612 N 33rd St Omaha, NE | 3.0 | 2.0 | 2370 | $1,650 | $0.70 | 14d | 1 | 1.08mi |
| 303 N 38th St Omaha, NE | 4.0 | 1.5 | 1472 | $1,995 | $1.36 | 23d | 1 | 1.11mi |
| 3919 Farnam St Unit 3915 Farnam Omaha, NE | 4.0 | 2.0 | 1700 | $2,350 | $1.38 | 43d | 1 | 1.13mi |
| 3403 Arbor St Omaha, NE | 5.0 | 2.0 | 1556 | $2,500 | $1.61 | 3d | 1 | 1.19mi |
| 4228 Mayberry St Omaha, NE | 4.0 | 1.0 | 1664 | $1,700 | $1.02 | 14d | 1 | 1.25mi |
| 140 N 41st St Omaha, NE | 3.0 | 2.5 | 1640 | $2,495 | $1.52 | 43d | 1 | 1.31mi |
| 4182 Wakeley St Omaha, NE | 4.0 | 3.5 | 2472 | $2,775 | $1.12 | 11d | 1 | 1.46mi |
Listing history 6 events
-
2026-06-18days on market $180,000 Active 6 DOM
-
2026-06-17statusdays on market $180,000 Active 5 DOM
-
2026-06-16days on market $180,000 New 4 DOM
-
2026-06-15days on market $180,000 New 3 DOM
-
2026-06-13remarks 661-char remark
-
2026-06-13$180,000 New 1 DOM
ⓘ Source: listings_history table (triggers on properties + properties_extension) + one-shot
backfill from property_details.listing_events for pre-trigger history.
Tax reassessment forecast NE · Resets to sale price
- Current annual tax
- $2,045 · $170/mo
- Projected year-2 tax
- $3,114 · $260/mo
- Expected delta
- +$1,069/yr (+$89/mo · 52.3%)
ⓘ Screening estimate from a state-policy table — verify with the county assessor before closing.
Climate risk First Street
- Flood 1/10 Low FEMA zone X (unshaded) · 0% chance over 30 yrs
- Wildfire 1/10 Low
- Heat 3/10 Moderate 7 d/yr ≥103°F today · 15 d/yr by 30 yrs out
- Wind 2/10 Low
- Air quality 2/10 Low 0 unhealthy d/yr today · 1 by 30 yrs out
Nearby sold comps map
Loading sold comps map…
Walkable amenities ~0.75 mi
Loading nearby amenities…
Taxation est. · year 1
- Rental income
- $24,128
- − Mortgage interest
- −$10,083
- − Property taxes
- −$2,045
- − Insurance
- −$900
- − Repairs & maintenance
- −$1,930
- − Management
- −$1,930
- − Depreciation
- −$5,236
- Taxable income
- $2,003
- Est. tax owed @ 24.0%
- −$481
- After-tax cash flow
- $4,308/yr
For passive investors: Depreciation is non-cash, so a rental often shows a tax loss while cash-flowing — sheltering income. Rental losses are passive: they offset passive income freely, and up to $25,000/yr can offset ordinary (W-2) income if you actively participate and your MAGI is under $100k (phasing out to $0 by $150k); unused losses carry forward. On sale, claimed depreciation is recaptured at up to 25%, and gains may owe capital-gains tax (a 1031 exchange can defer both). Figures are a year-1 estimate at your 24.0% rate — not tax advice; consult a CPA.
Schools (NCES district)
- District
- Omaha Public Schools
- NCES district ID
- 3174820
- Math proficiency
- 20% ▼ -10.00%
- Reading proficiency
- 28% ▼ -5.00%
- Median HH income
- $46,039
- Composite
- 20.83/100
- National rank
- #8502
- State rank
- #110 of 111 in NE
Livability — Omaha
- Score
- 84/100
- State rank
- #7
- US rank
- #663
Category grades
Schools grade is shown separately in the Schools card above.
Census & demographics
- Census place
- Omaha, NE
- County
- Douglas County · 538,646 people
- City population
- 552,986
- Metro
- Omaha-Council Bluffs, NE-IA
- Population (ZIP)
- 22,807
- Household income
- $57,533
- Rent vs Own
- Severe rent burden
- 1096.0
Population outlook (Douglas County) Hauer SSP2
- Today (2025)
- 625,245 people
- By 2030
- 661,613 · +5.8%
- By 2040
- 732,395 · +17.1%
- By 2050
- 801,988 · +28.3%
- By 2075
- 968,637 · +54.9%
- By 2100
- 1,101,871 · +76.2%
Race, ethnicity, and origin ACS 2023
- Neighborhood character
- Diverse neighborhood (Simpson 0.55)
- Race & ethnicity
- White 60% Hispanic / Latino 29% Two or more races 11% Black 5% Native American 2% Asian 2%
- Hispanic origin (detail)
- Mexican 23%
- Common ancestry
- Romanian 5% Lithuanian 3% Portuguese 2%
- Foreign-born
- 13% · Canada, China
- Languages at home
- 73% English-only · Spanish 22% Arabic 1% Other Indo-European 1%
Political lean MEDSL · Douglas
- 2024 margin
- D (+10.2) · D 54.4% · R 44.2% · Other 1.4%
- 2008→2024 swing
- +5.5pp toward D · 2008: 4.6pp · 2024: 10.2pp
- All cycles
- 2024: D+10.2 2020: D+11.3 2016: D+1.4 2012: R+4.3 2008: D+4.6
Not yet ingested
- Civics
- —
Market trends
- HPI YoY
- ▼ -234.93%
- Current HPI
- 314.1884
- Rent YoY
- ▲ 3.66%
- Metro
- Omaha-Council Bluffs, NE-IA
- State GDP YoY
- ▲ 0.68%
- F500 in state
- 2
Industry mix (Fortune 500 HQ in NE)
| Industry | F500 HQs | Revenue |
|---|---|---|
| Conglomerate | 1 | $371B |
|
||
Price history
1 event — show timeline
- 2026-06-12 Listed $180,000 GPRMLS
Property tax history
+4.1%/yrLatest (2025): $2,045 · -0.2% YoY. Source: county tax records.
Cash-flow waterfall
monthlySold comps — $/sqft
last 12 mo · ≤1 miLoading sold comps…