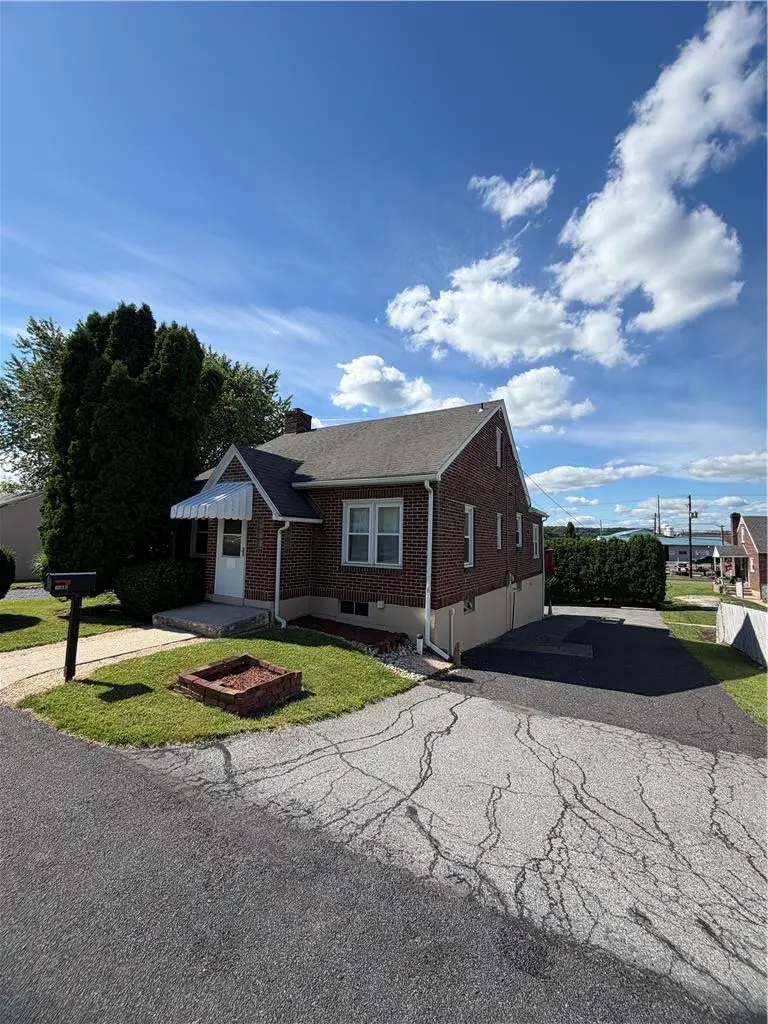
6519 1st Ave · Upper Macungie, PA
Flood risk 1/10 · Minimal
- FEMA flood zone
- X (unshaded)
- Chance of flooding over 30 yrs
- 0.0%
- Est. flood insurance / yr
- $473 – $860
Fire risk 1/10 · Minimal
- Est. fire insurance / yr
- $511 – $949
Heat risk 5/10 · Moderate
- Hot days now (above 99°F)
- 7 days/yr
- Hot days in 30 yrs
- 15 days/yr
Wind risk 4/10 · Minor
- Chance of severe wind over 30 yrs
- 14.0%
Air-quality risk 2/10 · Minimal
- Unhealthy air days now
- 1 days/yr
- Unhealthy air days in 30 yrs
- 3 days/yr
Risk factors via First Street. Map © Google.
Why this score? — see what drove the D+ grade
The composite is a weighted blend of 9 inputs, each scored 0–100. Each bar is that input's sub-score; the figure is the points it added to the 100-point composite (weight × sub-score).
- Cash flow +13.6/30.0
- ARV discount +11.2/15.0
- Schools +5.7/10.0
- DSCR +4.1/10.0
- 1% rule +3.2/10.0
- Rent growth +2.5/5.0
- Livability +2.5/5.0
- Condition / age +2.5/5.0
- Appreciation +0.0/10.0
$339,900
🖨 Deal sheet (PDF) 📄 Offer letter ✓ Due diligence
Listing remarks
Discover an exceptional opportunity to own a meticulously updated Cape Cod residence, perfectly poised for a new chapter. This charming two-bedroom home offers a seamless blend of classic appeal and modern functionality. This home boasts an updated kitchen and bathroom, new lighting enhancing the fresh and welcoming ambiance. Significant upgrades include updated electrical systems for both the interior and exterior, modern plumbing, and a state-of-the-art HVAC and Central AC system, complemented by a water softener, guaranteeing comfort and efficiency year-round. Beyond the interior, this property features a generously sized two-car garage, offering ample storage and parking solutions. An e
Key facts
- Water softener
- Modern plumbing
- Updated kitchen
Tags
Property features AI
Exterior
- Parking: Attached 2-car garage
- Utilities: Public water; Public sewer; Electric service available
- Home design: Brick construction; Above-grade finished area reported
- Construction: Brick exterior; Year built: unknown; Full basement
- Exterior features: Deck; Lot approximately 0.103 acres
Interior
- Kitchen: Electric cooktop; Electric oven; Refrigerator
- Bedrooms: Total of 5 rooms (includes bedrooms and living spaces); Basement with walk-out access
- Bathrooms: 1 full bathroom
- Heating & cooling: Forced air heating (oil); Central air conditioning; Electric water heater
- Interior features: Dining area; Separate/formal dining room; Storm windows and screens
- Laundry & utility: Washer hookup; Dryer hookup (electric)
Neighborhood map
What this means for you Summary
Snapshot
- This is a 2-bed/1.0-bath single-family listed at $340k.
Deal economics
- At list price, monthly cash flow is $18 ($221/yr) — positive.
- The deal already cash-flows at list — no discount required.
- To meet the 1% rule (rent ≥ 1% of price), the offer needs to be $279k (17.8% below list).
- Recommended offer: $279k (17.8% below list) — sets the bar for 1% rule.
Location & tenants
- Location reads: area grade D — affects rentability + tenant quality, not the cash-flow math above.
- Parkland SD (suburban): math 59% / reading 70% proficiency, ranked #40 of 539 in PA (top 7%) — acceptable for families but not a draw, mixed tenant base, ~2y average lease; only 15% free/reduced lunch — higher-income household profile.
- Zoned schools: Parkway Manor Sch (math 62% / reading 73%, grade B+, #192 of 1,518 statewide, top 13%, 530 students, 28% FRL); Springhouse Ms (math 50% / reading 71%, grade B+, #39 of 512 statewide, top 8%, 1,344 students, 29% FRL); Parkland Hs (math 81% / reading 24%, grade C-, #107 of 437 statewide, top 25%, 3,220 students, 25% FRL).
- Market conditions: 35 active listings in the ZIP; 9 comparable units currently listed for rent nearby; rentals at typical pace (median 17d on market — plan ~3-4 weeks tenant-placement turnaround); 765 units permitted in Lehigh County in 2024 (286 in 5+ unit buildings).
Forward outlook
- Local home prices are declining (-3.0%/yr); year-one equity from $2k of loan paydown is wiped out by about $10k of value loss. Plan a longer hold.
- Lehigh County population projected at +21% by 2050 — long-run rental-demand tailwind backs the buy-and-hold thesis.
Negotiation context
- Only 6 days on market — expect competitive offers; lowballing is unlikely to land.
- Current owner paid $46k; list at $340k implies a 647% gain — meaningful room to come down on a strong offer.
Risks & watch-outs
- Watch-outs: built in 1950 — expect roof / HVAC / electrical / plumbing capex.
- Climate carrying-cost: extreme-heat days projected 7→15/yr by 2055 (HVAC capex compounding) — expect insurance premiums to compound above CPI over the hold.
Questions for the listing agent
- Built in 1950 — when were the roof, HVAC, electrical panel, plumbing, and water heater last replaced?
- Is there a deadline driving the sale (1031 exchange, divorce, estate, relocation)? That informs how much negotiation room exists.
- The area grade is low — what's the realistic commute time and amenity access for the typical tenant pool here? Any planned neighborhood developments (good or bad) we should know about?
- What's the average days-on-market for RENTAL listings here right now (not sales)? A rising rental-DOM trend means longer vacancies and softer asking-rent achievability than the comps imply.
- What's the recent tenant-quality profile in this submarket — average credit score on applications, eviction rate, late-payment / NSF rate, and stable-employment percentage? A property-management company in the area should have these aggregated.
- How much new for-sale + rental construction is in the pipeline within 1–3 miles? Heavy new supply typically softens prices + rents 12–24 months out; constrained supply supports both.
Investment metrics
- 1% rule
- 0.82% ✗
- Cap rate
- 6.36%
- Cash-on-cash
- 0.23%
- DSCR
- 1.01
- GRM
- 10.1
CMA / ARV
- ARV (on-the-fly)
- $370,272
- Comps found
- 1
Show comp detail 1 sale within ~0.75 mi
| Address | Dist | Beds/Ba | Sqft | Sold | Price | $/sf | Match |
|---|---|---|---|---|---|---|---|
| 6427 Tupelo Rd | 0.53mi | 3/2.5 (+1) | 1,800 (+11%) | 2mo | $410,000 | $228 | 45 |
Match score weights: distance 35% · size 25% · config 20% · recency 20%. Top-matched comps best support the ARV.
Projected returns pro-forma
-3.0% appreciation · 3.0% rent growth · sell at horizon
- IRR
- -16.0%
- Equity multiple
- 0.43×
- Total profit
- $-53,960
- Equity at exit
- $50,680
- IRR
- -7.6%
- Equity multiple
- 0.52×
- Total profit
- $-45,703
- Equity at exit
- $29,388
Cash invested: $95,172 (down + closing). Projections, not guarantees.
Landlord ↔ Tenant lean methodology
- Overall (STATE)
- 62 Landlord-Friendly
- State Pennsylvania
- 62 Landlord-Friendly · EVEN
- County
- — inherits STATE
- City
- — inherits STATE
ZIP-level market 18106
- Home prices YoY
- -20.6%
- Active inventory
- 35
- Price-to-rent
- 10.1×
Monthly cashflow live
- Estimated rent
- $2,794 high interval (Pro) →
- Mortgage (P&I)
- −$1,782
- Tax from tax record
- −$265 /mo · $3,178/yr
- Insurance
- −$142
- HOA
- −$0
- Vacancy / Maint / Mgmt
- −$587
- Net cashflow
- $18
Break-even live
Sensitivity live
| Price | -10% $211 | -5% $115 | +0% $18 | +5% $-78 | +10% $-174 |
|---|---|---|---|---|---|
| Rent | -10% $-202 | -5% $-92 | +0% $18 | +5% $129 | +10% $239 |
| Rate | -1.0pp $190 | -0.5pp $105 | base $18 | +0.5pp $-70 | +1.0pp $-159 |
UW: 25.0% down · 7.5% · 30yr · 1.5% tax · 5.0% vac · 8.0% maint · 8.0% mgmt
Financing live
Cash to close
- Down payment
- $84,975
- Closing costs
- $10,197
- Reserves months
- —
- Total cash needed
- —
Loan-product check · same deal, 3 products live
Conventional
25% down · 7.5% · 30yr
- Down + closing
- —
- Monthly P&I
- —
- Monthly cashflow
- —
- DSCR
- —
- Eligible?
- —
Personal DTI + credit; lowest rate.
DSCR
20% down · 8.5% · 30yr
- Down + closing
- —
- Monthly P&I
- —
- Monthly cashflow
- —
- DSCR
- —
- Eligible?
- —
No personal income docs; deal must DSCR.
Hard money
10% down · 12.0% · 12mo
- Down + closing
- —
- Monthly P&I
- —
- Monthly cashflow
- —
- DSCR
- —
- Eligible?
- —
Short-term bridge; refi at stabilization.
Rent comps 9 comps
| Address | Beds | Baths | Sqft | Rent | $/sqft | DOM | Units | Dist |
|---|---|---|---|---|---|---|---|---|
| 100 Aviv St Fogelsville, PA | 1.0–2.0 | 1.0–2.0 | 990 | $2,255 | $2.28 | 4d | 7 | 1.28mi |
| 1350 Caspian St Allentown, PA | 3.0 | 2.5 | 1922 | $2,775 | $1.44 | 4d | 1 | 1.34mi |
| 5380 Jutland Rd Allentown, PA | 3.0 | 2.5 | 1971 | $2,700 | $1.37 | 23d | 1 | 1.35mi |
| 1477 Tarpan Ln Allentown, PA | 3.0 | 1.5 | 1899 | $2,700 | $1.42 | 45d | 1 | 1.37mi |
| 1127 Meadowlark Dr Unit 2 Fogelsville, PA | 3.0 | 2.5 | 2208 | $2,900 | $1.31 | 4d | 1 | 1.38mi |
| 1092 Meadowlark Dr Fogelsville, PA | 3.0 | 2.5 | 2208 | $3,000 | $1.36 | 16d | 1 | 1.40mi |
| 1132 Meadowlark Dr Fogelsville, PA | 3.0 | 2.5 | 2208 | $3,000 | $1.36 | 21d | 1 | 1.41mi |
| 5335 Jutland Rd Allentown, PA | 3.0 | 2.5 | 1899 | $2,700 | $1.42 | 45d | 1 | 1.41mi |
| 5265 Rockrose Ln Allentown, PA | 1.0–2.0 | 1.0–2.0 | 1400 | $3,080 | $2.20 | 4d | 21 | 1.45mi |
Listing history 5 events
-
2026-06-21days on market $339,900 Active 6 DOM
-
2026-06-18days on market $339,900 Active 3 DOM
-
2026-06-17days on market $339,900 Active 2 DOM
-
2026-06-16remarks 699-char remark
-
2026-06-16$339,900 Active 1 DOM
ⓘ Source: listings_history table (triggers on properties + properties_extension) + one-shot
backfill from property_details.listing_events for pre-trigger history.
Tax reassessment forecast PA · Partial reset (capped growth)
- Current annual tax
- $3,178 · $265/mo
- Projected year-2 tax
- $4,274 · $356/mo
- Expected delta
- +$1,096/yr (+$91/mo · 34.5%)
ⓘ Screening estimate from a state-policy table — verify with the county assessor before closing.
Climate risk First Street
- Flood 1/10 Low FEMA zone X (unshaded) · 0% chance over 30 yrs
- Wildfire 1/10 Low
- Heat 5/10 Major 7 d/yr ≥99°F today · 15 d/yr by 30 yrs out
- Wind 4/10 Moderate 14% chance of damaging wind over 30 yrs
- Air quality 2/10 Low 1 unhealthy d/yr today · 3 by 30 yrs out
Nearby sold comps map
Loading sold comps map…
Walkable amenities ~0.75 mi
Loading nearby amenities…
Taxation est. · year 1
- Rental income
- $33,530
- − Mortgage interest
- −$19,040
- − Property taxes
- −$3,178
- − Insurance
- −$1,700
- − Repairs & maintenance
- −$2,682
- − Management
- −$2,682
- − Depreciation
- −$9,888
- Taxable loss
- −$5,640
- Est. tax savings @ 24.0%
- +$1,354
- After-tax cash flow
- $1,575/yr
For passive investors: Depreciation is non-cash, so a rental often shows a tax loss while cash-flowing — sheltering income. Rental losses are passive: they offset passive income freely, and up to $25,000/yr can offset ordinary (W-2) income if you actively participate and your MAGI is under $100k (phasing out to $0 by $150k); unused losses carry forward. On sale, claimed depreciation is recaptured at up to 25%, and gains may owe capital-gains tax (a 1031 exchange can defer both). Figures are a year-1 estimate at your 24.0% rate — not tax advice; consult a CPA.
Schools (NCES district)
- District
- Parkland SD
- NCES district ID
- 4218510
- Math proficiency
- 59% ▼ -11.00%
- Reading proficiency
- 70% ▼ -12.00%
- Median HH income
- $77,976
- Composite
- 57.44/100
- National rank
- #1074
- State rank
- #40 of 539 in PA
Livability — Upper Macungie
No livability data for this city. (Only ~50 U.S. cities are tracked.)
Census & demographics
- Population (ZIP)
- 6,437
Population outlook (Lehigh County) Hauer SSP2
- Today (2025)
- 392,957 people
- By 2030
- 408,319 · +3.9%
- By 2040
- 440,007 · +12.0%
- By 2050
- 475,940 · +21.1%
- By 2075
- 590,448 · +50.3%
- By 2100
- 690,314 · +75.7%
Race, ethnicity, and origin ACS 2023
- Neighborhood character
- Predominantly White (74%)
- Race & ethnicity
- White 74% Hispanic / Latino 13% Asian 9% Two or more races 6% Black 2%
- Hispanic origin (detail)
- Mexican 1% Puerto Rican 7% Dominican 3%
- Common ancestry
- Romanian 5% Polish 2% Slovak 1%
- Foreign-born
- 13% · Canada, China
- Languages at home
- 77% English-only · Spanish 10% Other Indo-European 8% Chinese 2%
Political lean MEDSL · Lehigh
- 2024 margin
- Toss-up / Even · D 50.7% · R 48.0% · Other 1.2%
- 2008→2024 swing
- -12.9pp toward R · 2008: 15.6pp · 2024: 2.7pp
- All cycles
- 2024: D+2.7 2020: D+7.6 2016: D+4.4 2012: D+7.5 2008: D+15.6
Not yet ingested
- Civics
- —
Market trends
- HPI YoY
- ▼ -73.06%
- Current HPI
- 282.1496
- Rent YoY
- —
- Metro
- —
- State GDP YoY
- ▲ 1.68%
- F500 in state
- 34
Industry mix (Fortune 500 HQ in PA)
| Industry | F500 HQs | Revenue |
|---|---|---|
| Healthcare | 2 | $309B |
|
||
| Insurance | 2 | $27B |
|
||
| Telecommunications / Media | 1 | $124B |
|
||
| Industrial Distribution | 1 | $22B |
|
||
| Financial Services | 1 | $20B |
|
||
| Chemicals / Materials | 1 | $18B |
|
||
Price history
+655.3% since first listed4 events — show timeline
- 2026-06-15 Listed $339,900 GLVRMLS
- 2023-07-03 Sold (Public Records) $45,500 Public Records
- 1988-08-26 Sold (Public Records) $65,000 Public Records
- 1981-05-15 Sold (Public Records) $45,000 Public Records
Property tax history
+1.7%/yrLatest (2026): $3,178 · +3.1% YoY. Source: county tax records.
Cash-flow waterfall
monthlySold comps — $/sqft
last 12 mo · ≤1 miLoading sold comps…