 🏗️ New Construction
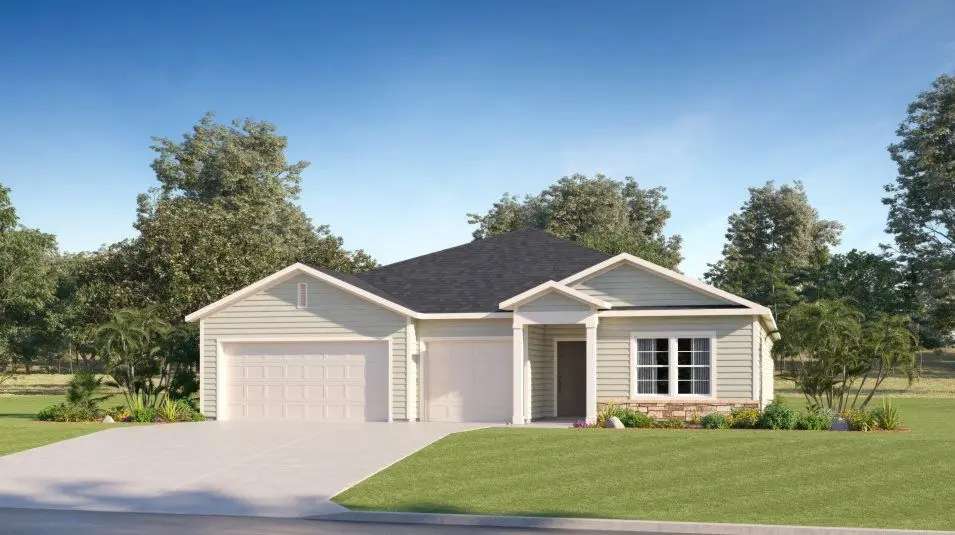
Medallion II Plan · Jacksonville, FL
Flood risk 1/10 · Minimal
- FEMA flood zone
- X (unshaded)
- Chance of flooding over 30 yrs
- 0.0%
- Est. flood insurance / yr
- $507 – $1,088
Fire risk 7/10 · Major
- Est. fire insurance / yr
- $947 – $1,759
Heat risk 9/10 · Severe
- Hot days now (above 107°F)
- 7 days/yr
- Hot days in 30 yrs
- 20 days/yr
Wind risk 9/10 · Severe
- Chance of severe wind over 30 yrs
- 99.0%
Air-quality risk 5/10 · Moderate
- Unhealthy air days now
- 8 days/yr
- Unhealthy air days in 30 yrs
- 10 days/yr
Risk factors via First Street. Map © Google.
Why this score? — see what drove the D grade
The composite is a weighted blend of 9 inputs, each scored 0–100. Each bar is that input's sub-score; the figure is the points it added to the 100-point composite (weight × sub-score).
- Appreciation +10.0/10.0
- ARV discount +7.5/15.0
- Cash flow +6.0/30.0
- Schools +6.0/10.0
- Livability +4.2/5.0
- Rent growth +3.2/5.0
- Condition / age +2.5/5.0
- 1% rule +1.3/10.0
- DSCR +0.4/10.0
$466,490
🖨 Deal sheet (PDF) 📄 Offer letter ✓ Due diligence
Key facts
- Luxe owner's suite
- Enhanced privacy
- Covered lanai
Tags
Property features AI
Finance
- Financial info: Listing price available (active listing)
Exterior
- Parking: 3-car garage / 3 total parking spaces
- Home design: Medallion II plan; Address: Yulee, FL 32097
- Exterior features: New construction home
Interior
- Bedrooms: 4 bedrooms
- Bathrooms: 3 full bathrooms
- Interior features: Open floor plan (new construction plan: Medallion II); Living area approximately 2,571
Neighborhood map
What this means for you Summary
Snapshot
- This is a 4-bed/3.0-bath single-family listed at $466k.
Deal economics
- At list price, monthly cash flow is $-885 ($-11k/yr) — negative.
- To cash-flow at today's rent, offer at most $337k (27.7% below list).
- To meet the 1% rule (rent ≥ 1% of price), the offer needs to be $295k (36.7% below list).
- Recommended offer: $295k (36.7% below list) — sets the bar for 1% rule.
Location & tenants
- Location reads 83/100 on livability (#50 in FL, #911 nationally) — a professional / high-income tenant draw. Strengths: amenities A+, commute A+, housing A+.
- Nassau (town): math 74% / reading 65% proficiency, ranked #4 of 73 in FL (top 6%) — acceptable for families but not a draw, mixed tenant base, ~2y average lease.
- Market conditions: Rents rising (+2.9%/yr); 601 active listings in the ZIP; 9 comparable units currently listed for rent nearby; rentals at typical pace (median 15d on market — plan ~3-4 weeks tenant-placement turnaround); solid renter incomes; 953 units permitted in Nassau County in 2024 (24 in 5+ unit buildings).
- This rent runs 38% of the median local income ($93k/yr) — at the standard rent-burdened threshold; future hikes will face affordability resistance.
Forward outlook
- In year one you build about $50k of equity ($3k loan paydown + $47k appreciation (10.0% local appreciation)).
- Nassau County population projected at +17% by 2050 — long-run rental-demand tailwind backs the buy-and-hold thesis.
- By year 2, paydown + projected appreciation supports a ~$80k cash-out refi (75% LTV) — recoverable capital for the next deal without selling this one.
Negotiation context
- It's been on market 492 days — a 12% lower offer ($411k) is reasonable based on typical stale-listing flexibility.
Risks & watch-outs
- Climate carrying-cost: severe wind risk, 99% chance of damaging wind over 30y; major wildfire risk; extreme-heat days projected 7→20/yr by 2055 (HVAC capex compounding) — expect insurance premiums to compound above CPI over the hold.
Questions for the listing agent
- What do current leases actually rent for vs. the listed asking? Can we see a recent rent roll and the last 12 months of T-12 income?
- It's been on market 492 days. Have you received any prior offers? Is the seller open to a 37% concession, seller financing, or rate buy-down credit?
- Why hasn't it sold? Are there any deal-killer items the seller is aware of (foundation, flood, title, zoning, code violations)?
- Is there a deadline driving the sale (1031 exchange, divorce, estate, relocation)? That informs how much negotiation room exists.
- Schools are B-rated — typically a magnet for longer-tenancy family renters. What's the average tenant stay here, and is there a school-zone premium baked into asking?
- The area grade is low — what's the realistic commute time and amenity access for the typical tenant pool here? Any planned neighborhood developments (good or bad) we should know about?
- What's the average days-on-market for RENTAL listings here right now (not sales)? A rising rental-DOM trend means longer vacancies and softer asking-rent achievability than the comps imply.
- What's the recent tenant-quality profile in this submarket — average credit score on applications, eviction rate, late-payment / NSF rate, and stable-employment percentage? A property-management company in the area should have these aggregated.
- How much new for-sale + rental construction is in the pipeline within 1–3 miles? Heavy new supply typically softens prices + rents 12–24 months out; constrained supply supports both.
Investment metrics
- 1% rule
- 0.63% ✗
- Cap rate
- 4.01%
- Cash-on-cash
- -8.15%
- DSCR
- 0.64
- GRM
- 13.1
CMA / ARV
- ARV (on-the-fly)
- $465,351
- Comps found
- 12
Show comp detail 12 sales within ~0.75 mi
| Address | Dist | Beds/Ba | Sqft | Sold | Price | $/sf | Match |
|---|---|---|---|---|---|---|---|
| 75197 Pondside Ln | 0.29mi | 4/3.0 | 2,660 (+4%) | 0mo | $485,000 | $182 | 80 |
| 75547 Cloverwood Ct | 0.09mi | 3/2.5 (-1) | 2,370 (-8%) | 3mo | $430,000 | $181 | 73 |
| 75556 Canterwood Dr | 0.38mi | 5/3.0 (+1) | 2,640 (+3%) | 1mo | $465,000 | $176 | 72 |
| 75077 Pondside Ln | 0.46mi | 4/3.0 | 2,659 (+3%) | 2mo | $480,000 | $181 | 71 |
| 75263 Weathersford Pl | 0.39mi | 4/3.0 | 2,288 (-11%) | 1mo | $440,000 | $192 | 63 |
| 75598 Banyan Way | 0.52mi | 4/3.0 | 2,390 (-7%) | 2mo | $469,290 | $196 | 62 |
| 75844 Walking Path Ln | 0.70mi | 4/3.0 | 2,656 (+3%) | 2mo | $459,000 | $173 | 60 |
| 75791 Bayley Pl | 0.67mi | 4/3.0 | 2,390 (-7%) | 2mo | $461,780 | $193 | 56 |
| 75013 Pondside Ln | 0.51mi | 4/2.5 | 2,295 (-11%) | 3mo | $378,000 | $165 | 54 |
| 75751 Bayley Pl | 0.68mi | 4/3.5 | 2,772 (+8%) | 1mo | $474,606 | $171 | 53 |
| 75639 Bayley Pl | 0.72mi | 4/3.5 | 2,772 (+8%) | 0mo | $434,140 | $157 | 51 |
| 75687 Bayley Pl | 0.71mi | 4/3.5 | 2,772 (+8%) | 1mo | $449,230 | $162 | 51 |
Match score weights: distance 35% · size 25% · config 20% · recency 20%. Top-matched comps best support the ARV.
Projected returns pro-forma
10.0% appreciation · 2.88% rent growth · sell at horizon
- IRR
- 18.5%
- Equity multiple
- 2.51×
- Total profit
- $196,782
- Equity at exit
- $419,225
- IRR
- 17.2%
- Equity multiple
- 5.78×
- Total profit
- $623,172
- Equity at exit
- $904,075
Cash invested: $130,298 (down + closing). Projections, not guarantees.
Landlord ↔ Tenant lean methodology
- Overall (STATE)
- 87 Strongly Landlord-Friendly
- State Florida
- 87 Strongly Landlord-Friendly · R+3
- County
- — inherits STATE
- City
- — inherits STATE
ZIP-level market 32097
- Home prices YoY
- 19.5%
- Rents YoY
- 2.9%
- Active inventory
- 601
- Price-to-rent
- 13.2×
Monthly cashflow live
- Estimated rent
- $2,951 high interval (Pro) →
- Mortgage (P&I)
- −$2,440
- Tax est. 1.5%
- −$582 /mo · $6,980/yr
- Insurance
- −$194
- HOA
- −$0
- Vacancy / Maint / Mgmt
- −$620
- Net cashflow
- $-885
Break-even live
Sensitivity live
| Price | -10% $-563 | -5% $-724 | +0% $-885 | +5% $-1,046 | +10% $-1,206 |
|---|---|---|---|---|---|
| Rent | -10% $-1,118 | -5% $-1,001 | +0% $-885 | +5% $-768 | +10% $-652 |
| Rate | -1.0pp $-650 | -0.5pp $-766 | base $-885 | +0.5pp $-1,005 | +1.0pp $-1,128 |
UW: 25.0% down · 7.5% · 30yr · 1.5% tax · 5.0% vac · 8.0% maint · 8.0% mgmt
Financing live
Cash to close
- Down payment
- $116,338
- Closing costs
- $13,961
- Reserves months
- —
- Total cash needed
- —
Loan-product check · same deal, 3 products live
Conventional
25% down · 7.5% · 30yr
- Down + closing
- —
- Monthly P&I
- —
- Monthly cashflow
- —
- DSCR
- —
- Eligible?
- —
Personal DTI + credit; lowest rate.
DSCR
20% down · 8.5% · 30yr
- Down + closing
- —
- Monthly P&I
- —
- Monthly cashflow
- —
- DSCR
- —
- Eligible?
- —
No personal income docs; deal must DSCR.
Hard money
10% down · 12.0% · 12mo
- Down + closing
- —
- Monthly P&I
- —
- Monthly cashflow
- —
- DSCR
- —
- Eligible?
- —
Short-term bridge; refi at stabilization.
Rent comps 9 comps
| Address | Beds | Baths | Sqft | Rent | $/sqft | DOM | Units | Dist |
|---|---|---|---|---|---|---|---|---|
| 75470 Sunberry Dr Yulee, FL | 5.0 | 4.0 | 2903 | $3,150 | $1.09 | 20d | 1 | 0.34mi |
| 75094 Fern Creek Dr Yulee, FL | 4.0 | 2.0 | 2193 | $2,495 | $1.14 | 3d | 1 | 1.04mi |
| 75094 Glenspring Way Yulee, FL | 3.0 | 2.0 | 2055 | $2,500 | $1.22 | 24d | 1 | 1.10mi |
| 75047 Brookwood Dr Yulee, FL | 5.0 | 3.0 | 3300 | $3,405 | $1.03 | 5d | 1 | 1.11mi |
| 76195 Deerwood Dr Yulee, FL | 4.0 | 2.5 | 2757 | $2,475 | $0.90 | 24d | 1 | 1.16mi |
| 65013 Lagoon Forest Dr Yulee, FL | 4.0 | 2.5 | 2245 | $2,800 | $1.25 | 11d | 1 | 1.18mi |
| 75008 Morning Glen Ct Yulee, FL | 4.0 | 2.0 | 1856 | $2,300 | $1.24 | 24d | 1 | 1.24mi |
| 75215 Fern Creek Dr Yulee, FL | 4.0 | 2.5 | 2898 | $2,900 | $1.00 | 15d | 1 | 1.27mi |
| 75075 Morning Glen Ct Yulee, FL | 4.0 | 2.0 | 1856 | $2,399 | $1.29 | 5d | 1 | 1.32mi |
Listing history 15 events
-
2026-06-21days on market $466,490 Active 492 DOM
-
2026-06-18days on market $466,490 Active 489 DOM
-
2026-06-17days on market $466,490 Active 488 DOM
-
2026-06-16days on market $466,490 Active 487 DOM
-
2026-06-15days on market $466,490 Active 486 DOM
-
2026-06-13days on market $466,490 Active 484 DOM
-
2026-06-13days on market $466,490 Active 483 DOM
-
2026-06-09days on market $466,490 Active 480 DOM
-
2026-06-08days on market $466,490 Active 479 DOM
-
2026-06-07days on market $466,490 Active 478 DOM
-
2026-06-05days on market $466,490 Active 475 DOM
-
2026-06-03days on market $466,490 Active 474 DOM
-
2026-06-02days on market $466,490 Active 473 DOM
-
2026-06-01days on market $466,490 Active 472 DOM
-
2026-05-31days on market $466,490 Active 471 DOM
ⓘ Source: listings_history table (triggers on properties + properties_extension) + one-shot
backfill from property_details.listing_events for pre-trigger history.
Climate risk First Street
- Flood 1/10 Low FEMA zone X (unshaded) · 0% chance over 30 yrs
- Wildfire 7/10 Severe
- Heat 9/10 Extreme 7 d/yr ≥107°F today · 20 d/yr by 30 yrs out
- Wind 9/10 Extreme 99% chance of damaging wind over 30 yrs
- Air quality 5/10 Major 8 unhealthy d/yr today · 10 by 30 yrs out
Nearby sold comps map
Loading sold comps map…
Walkable amenities ~0.75 mi
Loading nearby amenities…
Taxation est. · year 1
- Rental income
- $35,411
- − Mortgage interest
- −$26,067
- − Property taxes
- −$6,980
- − Insurance
- −$2,327
- − Repairs & maintenance
- −$2,833
- − Management
- −$2,833
- − Depreciation
- −$13,537
- Taxable loss
- −$19,167
- Est. tax savings @ 24.0%
- +$4,600
- After-tax cash flow
- $-6,017/yr
For passive investors: Depreciation is non-cash, so a rental often shows a tax loss while cash-flowing — sheltering income. Rental losses are passive: they offset passive income freely, and up to $25,000/yr can offset ordinary (W-2) income if you actively participate and your MAGI is under $100k (phasing out to $0 by $150k); unused losses carry forward. On sale, claimed depreciation is recaptured at up to 25%, and gains may owe capital-gains tax (a 1031 exchange can defer both). Figures are a year-1 estimate at your 24.0% rate — not tax advice; consult a CPA.
Schools (NCES district)
- District
- Nassau
- NCES district ID
- 1201350
- Math proficiency
- 74% ▼ -2.00%
- Reading proficiency
- 65% ▼ -2.00%
- Median HH income
- $58,267
- Composite
- 59.79/100
- National rank
- #899
- State rank
- #4 of 73 in FL
Livability — Jacksonville
- Score
- 83/100
- State rank
- #50
- US rank
- #911
Category grades
Schools grade is shown separately in the Schools card above.
Census & demographics
- County
- Nassau County · 67,729 people
- City population
- 979,034
- Metro
- Jacksonville, FL
- Population (ZIP)
- 26,700
- Household income
- $93,161
- Rent vs Own
- Severe rent burden
- 404.0
Population outlook (Nassau County) Hauer SSP2
- Today (2025)
- 88,419 people
- By 2030
- 92,679 · +4.8%
- By 2040
- 99,257 · +12.3%
- By 2050
- 103,378 · +16.9%
- By 2075
- 109,726 · +24.1%
- By 2100
- 107,006 · +21.0%
Race, ethnicity, and origin ACS 2023
- Neighborhood character
- Predominantly White (75%)
- Race & ethnicity
- White 75% Two or more races 9% Black 9% Hispanic / Latino 8% Asian 1% Native American 1%
- Hispanic origin (detail)
- Mexican 2% Puerto Rican 2%
- Common ancestry
- Lithuanian 4% Italian 3% Romanian 2%
- Foreign-born
- 4% · Canada, Vietnam
- Languages at home
- 93% English-only · Spanish 5% Vietnamese 1%
Political lean MEDSL · Nassau
- 2024 margin
- Solid R (+46.9) · D 26.1% · R 73.1%
- 2008→2024 swing
- -3.1pp toward R · 2008: -43.8pp · 2024: -46.9pp
- All cycles
- 2024: R+46.9 2020: R+45.9 2016: R+50.2 2012: R+48.6 2008: R+43.8
Not yet ingested
- Civics
- —
Market trends
- HPI YoY
- ▲ 49.35%
- Current HPI
- 301.9299
- Rent YoY
- ▲ 2.88%
- Metro
- Jacksonville, FL
- State GDP YoY
- ▲ 3.28%
- F500 in state
- 36
Industry mix (Fortune 500 HQ in FL)
| Industry | F500 HQs | Revenue |
|---|---|---|
| Industrial Technology | 2 | $29B |
|
||
| Insurance | 2 | $17B |
|
||
| Retail | 1 | $60B |
|
||
| Technology Distribution | 1 | $58B |
|
||
| Homebuilding | 1 | $35B |
|
||
| Technology Manufacturing | 1 | $35B |
|
||
Cash-flow waterfall
monthlySold comps — $/sqft
last 12 mo · ≤1 miLoading sold comps…