 Duplex
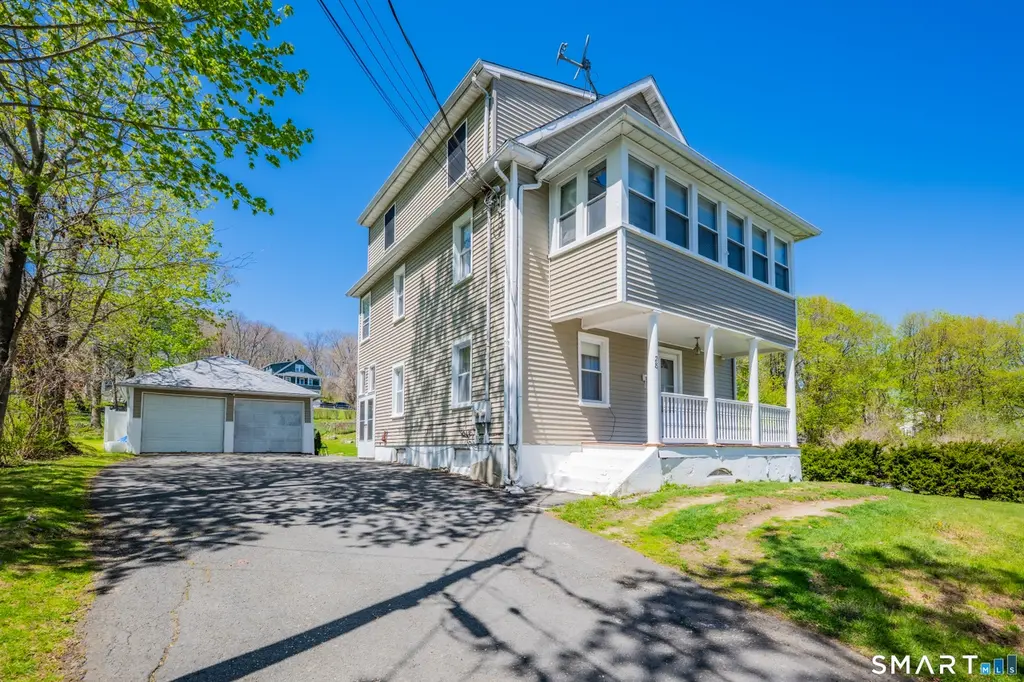
28 Maple St · Torrington, CT
Flood risk 1/10 · Minimal
- FEMA flood zone
- X
- Chance of flooding over 30 yrs
- 0.0%
- Est. flood insurance / yr
- $473 – $860
Fire risk 2/10 · Minimal
- Est. fire insurance / yr
- $829 – $1,539
Heat risk 4/10 · Minor
- Hot days now (above 93°F)
- 8 days/yr
- Hot days in 30 yrs
- 18 days/yr
Wind risk 5/10 · Moderate
- Chance of severe wind over 30 yrs
- 24.0%
Air-quality risk 2/10 · Minimal
- Unhealthy air days now
- 1 days/yr
- Unhealthy air days in 30 yrs
- 1 days/yr
Risk factors via First Street. Map © Google.
Why this score? — see what drove the C grade
The composite is a weighted blend of 9 inputs, each scored 0–100. Each bar is that input's sub-score; the figure is the points it added to the 100-point composite (weight × sub-score).
- Cash flow +23.3/30.0
- DSCR +7.5/10.0
- ARV discount +7.5/15.0
- 1% rule +5.8/10.0
- Rent growth +4.0/5.0
- Livability +3.8/5.0
- Schools +2.7/10.0
- Condition / age +2.5/5.0
- Appreciation +0.0/10.0
$315,000
🖨 Deal sheet (PDF) 📄 Offer letter ✓ Due diligence
Multi-family units
County records classify this as Multi-Family (2-4 Unit). Listing-text estimate: 2 units. confirmed
Listing remarks
OFFERS DUE BY MONDAY 12PM. A Versatile two-family property offering owner-occupant flexibility, income potential, and an unbeatable location close to everyday conveniences. Situated just minutes from local schools, Charlotte Hungerford Hospital, and a neighborhood park at the end of the road, this property combines convenience with lifestyle. This well-maintained multi-family features two separate entrances, making each unit feel private and functional. Inside, you'll find a blend of tile and hardwood flooring, two separate washer and dryer hookups (one for each floor), and a new stove in the second-floor unit. Recent improvements and highlights include upgraded separate electrical, a new o
Key facts
- Income potential
- Two family property
- Separate entrances
Tags
Property features AI
Finance
- Other: Located in Litchfield County, Connecticut; Nearby amenities include library, medical facilities, park, private schools, public pool, and public transportation
Exterior
- Parking: Detached 2-car garage
- Utilities: Public water connected; Public sewer connected; Domestic hot water
- Home design: Multi-family (2-family) property
- Construction: Frame construction; Asphalt shingle roof; Concrete foundation
- Exterior features: Lightly wooded lot; Above-ground swimming pool
Interior
- Bedrooms: 3 bedrooms
- Bathrooms: 2 full bathrooms
- Heating & cooling: Hot air heating; Oil-fired heat; Oil tank located in basement
- Interior features: Ceiling fans; Wall unit cooling; Full basement
Neighborhood map
What this means for you Summary
Snapshot
- This is a 2 × 3-bed/2.0-bath units multifamily listed at $315k.
Deal economics
- At list price, monthly cash flow is $577 ($7k/yr) — positive. Per door: $289/mo.
- The deal already cash-flows at list — no discount required.
- Meets the 1% rule at list price ($3k rent vs $315k).
- Cap rate 8.5% vs local median 4.0% in Torrington — top-decile yield for the area; either an underpriced asset or a hidden risk that comps aren't pricing in. Stress-test before assuming the spread holds.
Location & tenants
- Location reads 76/100 on livability (#53 in CT, #3,449 nationally) — a middle-class / working-renter tenant base. Strengths: crime A+, cost of living A+, housing A+; Watch: commute F.
- Torrington School District (town): math 22% / reading 39% proficiency, ranked #125 of 153 in CT (top 82%) — families likely to look elsewhere, expect single-tenant / working-renter base with shorter leases.
- Zoned schools: Southwest School (math 21% / reading 45%, grade F, #354 of 553 statewide, top 64%, 292 students, 69% FRL); Torrington Middle School (math 18% / reading 39%, grade F, #146 of 175 statewide, top 84%, 975 students, 61% FRL); Torrington High School (math 22% / reading 47%, grade F, #121 of 194 statewide, top 64%, 1,010 students, 57% FRL) — zoned schools average 62% FRL vs 40% district-wide (23 pts higher); higher-poverty schools than district average — tighter screening recommended.
- Market conditions: Rents rising fast (+5.9%/yr); 189 active listings in the ZIP; 18 comparable units currently listed for rent nearby; rentals lingering (median 46d on market — plan ~5-8 weeks vacancy on turnover, expect pricing pressure); 83% of comp listings sitting > 30 days — soft ceiling on asking rent; 154 units permitted in Northwest Hills Planning Region in 2024 (6 in 5+ unit buildings).
- At $3,399/mo this rent would consume 58% of the median local household income ($71k/yr) (locally 1401% of renters already pay >50% of income on rent) — very limited rent-growth headroom before tenants either downsize or default.
Forward outlook
- Local home prices are declining (-3.0%/yr); year-one equity from $2k of loan paydown is wiped out by about $9k of value loss. Plan a longer hold.
- At projected returns (-3.0% appreciation + 5.9% rent growth), your $88k cash investment doubles in ~10 years — after that, you're playing with house money.
Negotiation context
- Only 5 days on market — expect competitive offers; lowballing is unlikely to land.
- 2 sale attempts with the ask held roughly flat each time — persistent listings suggest the price (not the market) is what's stuck; bring a comps-based counter.
Risks & watch-outs
- Watch-outs: built in 1900 — expect roof / HVAC / electrical / plumbing capex.
- Climate carrying-cost: moderate wind risk, 24% chance of damaging wind over 30y — expect insurance premiums to compound above CPI over the hold.
Questions for the listing agent
- Can we see the unit-by-unit rent roll, current vacancy, and any below-market leases? What's the average tenancy length?
- What capital expenditures (roof, boiler, parking lot, exteriors) have been made in the last 5 years, and what's planned in the next 2?
- Built in 1900 — when were the roof, HVAC, electrical panel, plumbing, and water heater last replaced?
- Is there a deadline driving the sale (1031 exchange, divorce, estate, relocation)? That informs how much negotiation room exists.
- Schools are D-rated, which usually means shorter tenancies and higher turnover. Who's the typical renter profile here, and what's been the actual vacancy rate?
- What's the average days-on-market for RENTAL listings here right now (not sales)? A rising rental-DOM trend means longer vacancies and softer asking-rent achievability than the comps imply.
- What's the recent tenant-quality profile in this submarket — average credit score on applications, eviction rate, late-payment / NSF rate, and stable-employment percentage? A property-management company in the area should have these aggregated.
- How much new apartment / multifamily construction is in the pipeline within 1–3 miles? Heavy new supply (>2% of stock underway) typically softens rents 12–24 months out; light construction supports rent growth.
Investment metrics
- 1% rule
- 1.08% ✓
- Cap rate
- 8.49%
- Cash-on-cash
- 7.85%
- DSCR
- 1.35
- GRM
- 7.7
CMA / ARV
- ARV (median comp)
- $315,189
- List price
- $315,000
- Delta
- -0.06%
- Verdict
- FAIR
- Comps
- 20 within 1.0 mi
Show comp detail 10 sales within ~0.75 mi
| Address | Dist | Beds/Ba | Sqft | Sold | Price | $/sf | Match |
|---|---|---|---|---|---|---|---|
| 108 New Litchfield St | 0.29mi | 3/2.0 | 1,610 (-5%) | 9mo | $275,000 | $171 | 70 |
| 18 Iowa St | 0.26mi | 4/2.0 (+1) | 1,709 (+0%) | 16mo | $260,000 | $152 | 69 |
| 121 Culvert St | 0.35mi | 4/3.0 (+1) | 1,733 (+2%) | 4mo | $260,000 | $150 | 68 |
| 86 Belleview Ave | 0.51mi | 4/2.0 (+1) | 1,634 (-4%) | 3mo | $355,000 | $217 | 62 |
| 27 Washington Ave | 0.59mi | 4/2.0 (+1) | 1,745 (+3%) | 4mo | $225,000 | $129 | 59 |
| 59 Lincoln Ave | 0.68mi | 4/2.0 (+1) | 1,674 (-2%) | 7mo | $255,000 | $152 | 55 |
| 54 Iowa St | 0.22mi | 4/2.0 (+1) | 1,838 (+8%) | 20mo | $250,000 | $136 | 55 |
| 192 High St | 0.35mi | 4/2.0 (+1) | 1,854 (+9%) | 16mo | $280,000 | $151 | 50 |
| 80 Washington Ave | 0.52mi | 4/2.0 (+1) | 1,918 (+13%) | 2mo | $335,000 | $175 | 48 |
| 40 Maplewood Ave | 0.61mi | 4/2.0 (+1) | 1,944 (+14%) | 19mo | $260,000 | $134 | 27 |
Match score weights: distance 35% · size 25% · config 20% · recency 20%. Top-matched comps best support the ARV.
Projected returns pro-forma
-3.0% appreciation · 5.89% rent growth · sell at horizon
- IRR
- -1.2%
- Equity multiple
- 0.95×
- Total profit
- $-4,107
- Equity at exit
- $46,968
- IRR
- 11.3%
- Equity multiple
- 2.00×
- Total profit
- $88,074
- Equity at exit
- $27,235
Cash invested: $88,200 (down + closing). Projections, not guarantees.
Landlord ↔ Tenant lean methodology
- Overall (STATE)
- 27 Tenant-Leaning
- State Connecticut
- 27 Tenant-Leaning · D+7
- County
- — inherits STATE
- City
- — inherits STATE
ZIP-level market 06790
- Rents YoY
- 5.9%
- Active inventory
- 189
- Price-to-rent
- 15.4×
Monthly cashflow live
- Estimated rent
- $3,399 high interval (Pro) →
- Mortgage (P&I)
- −$1,652
- Tax from tax record
- −$325 /mo · $3,899/yr
- Insurance
- −$131
- HOA
- −$0
- Vacancy / Maint / Mgmt
- −$714
- Net cashflow
- $577
Break-even live
Sensitivity live
| Price | -10% $755 | -5% $666 | +0% $577 | +5% $488 | +10% $399 |
|---|---|---|---|---|---|
| Rent | -10% $309 | -5% $443 | +0% $577 | +5% $711 | +10% $846 |
| Rate | -1.0pp $736 | -0.5pp $657 | base $577 | +0.5pp $496 | +1.0pp $412 |
2-unit breakdown (identical units grouped — click to expand)
| Units | Beds | Baths | Est. rent |
|---|---|---|---|
| 2× units | 3 | 2 | $3,398 |
| #1 | 3 | 2 | $1,699 |
| #2 | 3 | 2 | $1,699 |
| Total (2 units) | $3,399 | ||
UW: 25.0% down · 7.5% · 30yr · 1.5% tax · 5.0% vac · 8.0% maint · 8.0% mgmt
Financing live
Cash to close
- Down payment
- $78,750
- Closing costs
- $9,450
- Reserves months
- —
- Total cash needed
- —
Loan-product check · same deal, 3 products live
Conventional
25% down · 7.5% · 30yr
- Down + closing
- —
- Monthly P&I
- —
- Monthly cashflow
- —
- DSCR
- —
- Eligible?
- —
Personal DTI + credit; lowest rate.
DSCR
20% down · 8.5% · 30yr
- Down + closing
- —
- Monthly P&I
- —
- Monthly cashflow
- —
- DSCR
- —
- Eligible?
- —
No personal income docs; deal must DSCR.
Hard money
10% down · 12.0% · 12mo
- Down + closing
- —
- Monthly P&I
- —
- Monthly cashflow
- —
- DSCR
- —
- Eligible?
- —
Short-term bridge; refi at stabilization.
Rent comps 18 comps
| Address | Beds | Baths | Sqft | Rent | $/sqft | DOM | Units | Dist |
|---|---|---|---|---|---|---|---|---|
| 152 Turner Ave #2 Torrington, CT | 2.0 | 1.0 | 1200 | $1,550 | $1.29 | 45d | 1 | 0.15mi |
| 53 Prospect St Unit 2 Torrington, CT | 3.0 | 1.5 | 1100 | $2,100 | $1.91 | 45d | 1 | 0.37mi |
| 101 Culvert St Unit 101 Torrington, CT | 3.0 | 1.0 | 1200 | $1,600 | $1.33 | 45d | 1 | 0.38mi |
| 14 Culvert St Unit 2 Torrington, CT | 4.0 | 1.0 | 1638 | $1,695 | $1.03 | 45d | 1 | 0.43mi |
| 163 Beechwood Ave Torrington, CT | 4.0 | 2.0 | 1896 | $2,800 | $1.48 | 45d | 1 | 0.45mi |
| 71 Arthur St #1 Torrington, CT | 2.0 | 1.5 | 1326 | $1,800 | $1.36 | 25d | 1 | 0.71mi |
| 42 Pulver St Torrington, CT | 3.0 | 1.0 | 1443 | $1,800 | $1.25 | 45d | 1 | 0.76mi |
| 63 Smith St Torrington, CT | 3.0 | 1.5 | 1392 | $2,200 | $1.58 | 45d | 1 | 0.80mi |
| 199 Migeon Ave Unit 2 Torrington, CT | 3.0 | 1.0 | 1500 | $2,350 | $1.57 | 45d | 1 | 0.82mi |
| 17 Woodbine St Torrington, CT | 3.0 | 1.5 | 1430 | $2,200 | $1.54 | 45d | 1 | 0.91mi |
| 21 Woodbine St Torrington, CT | 2.0 | 1.0 | 1516 | $1,850 | $1.22 | 45d | 1 | 0.92mi |
| 261 Hillside Ave Unit 2 Torrington, CT | 2.0 | 1.0 | 1344 | $1,300 | $0.97 | 25d | 1 | 1.15mi |
| 93 E Elm St Unit U2 Torrington, CT | 3.0 | 1.0 | 1100 | $1,550 | $1.41 | 45d | 1 | 1.23mi |
| 375 N Elm St Unit 2 Torrington, CT | 2.0 | 1.0 | 1100 | $1,700 | $1.55 | 45d | 1 | 1.24mi |
| 5 Winthrop St Torrington, CT | 3.0 | 1.5 | 1072 | $2,350 | $2.19 | 45d | 1 | 1.25mi |
| 84 Wilmot St Torrington, CT | 2.0 | 1.5 | 1768 | $1,850 | $1.05 | 25d | 1 | 1.27mi |
| 696 Main St Unit 2 Torrington, CT | 2.0 | 1.0 | 1117 | $1,350 | $1.21 | 45d | 1 | 1.43mi |
| 340 Brightwood Ave Unit 2 Torrington, CT | 3.0 | 1.0 | 1080 | $1,900 | $1.76 | 45d | 1 | 1.46mi |
Listing history 4 events
-
2026-05-05status Under Contract 1267-char remark
-
2026-04-29status Active 1267-char remark
-
2026-04-29historical 1267-char remark
-
2026-04-28$315,000 Active 1267-char remark
ⓘ Source: listings_history table (triggers on properties + properties_extension) + one-shot
backfill from property_details.listing_events for pre-trigger history.
Tax reassessment forecast CT · Partial reset (capped growth)
- Current annual tax
- $3,899 · $325/mo
- Projected year-2 tax
- $5,320 · $443/mo
- Expected delta
- +$1,421/yr (+$118/mo · 36.4%)
ⓘ Screening estimate from a state-policy table — verify with the county assessor before closing.
Climate risk First Street
- Flood 1/10 Low FEMA zone X · 0% chance over 30 yrs
- Wildfire 2/10 Low
- Heat 4/10 Moderate 8 d/yr ≥93°F today · 18 d/yr by 30 yrs out
- Wind 5/10 Major 24% chance of damaging wind over 30 yrs
- Air quality 2/10 Low 1 unhealthy d/yr today · 1 by 30 yrs out
Nearby sold comps map
Loading sold comps map…
Walkable amenities ~0.75 mi
Loading nearby amenities…
Taxation est. · year 1
- Rental income
- $40,788
- − Mortgage interest
- −$17,645
- − Property taxes
- −$3,899
- − Insurance
- −$1,575
- − Repairs & maintenance
- −$3,263
- − Management
- −$3,263
- − Depreciation
- −$9,164
- Taxable income
- $1,979
- Est. tax owed @ 24.0%
- −$475
- After-tax cash flow
- $6,451/yr
For passive investors: Depreciation is non-cash, so a rental often shows a tax loss while cash-flowing — sheltering income. Rental losses are passive: they offset passive income freely, and up to $25,000/yr can offset ordinary (W-2) income if you actively participate and your MAGI is under $100k (phasing out to $0 by $150k); unused losses carry forward. On sale, claimed depreciation is recaptured at up to 25%, and gains may owe capital-gains tax (a 1031 exchange can defer both). Figures are a year-1 estimate at your 24.0% rate — not tax advice; consult a CPA.
Schools (NCES district)
- District
- Torrington School District
- NCES district ID
- 0904590
- Math proficiency
- 22% ▼ -8.00%
- Reading proficiency
- 39% ▼ -6.00%
- Median HH income
- $53,647
- Composite
- 26.9/100
- National rank
- #7087
- State rank
- #125 of 153 in CT
Livability — Torrington
- Score
- 76/100
- State rank
- #53
- US rank
- #3449
Category grades
Schools grade is shown separately in the Schools card above.
Census & demographics
- Census place
- Torrington, CT
- County
- Litchfield County · 81,203 people
- City population
- 35,566
- Metro
- Torrington, CT
- Population (ZIP)
- 35,566
- Household income
- $70,912
- Rent vs Own
- Severe rent burden
- 1401.0
Population outlook (Northwest Hills County) Hauer SSP2
- By 2040
- 118,998
Race, ethnicity, and origin ACS 2023
- Neighborhood character
- Predominantly White (73%)
- Race & ethnicity
- White 73% Hispanic / Latino 14% Two or more races 8% Black 6% Asian 3%
- Hispanic origin (detail)
- Puerto Rican 5% Dominican 2%
- Common ancestry
- Romanian 8% Lithuanian 5% Slovak 2%
- Foreign-born
- 12% · Canada, South Korea, Jamaica
- Languages at home
- 86% English-only · Spanish 8% Other Indo-European 2% Russian/Polish/Slavic 1%
Political lean MEDSL · Northwest Hills
- 2024 margin
- Toss-up / Even · D 48.6% · R 49.9% · Other 1.6%
- All cycles
- 2024: R+1.3
Not yet ingested
- Civics
- —
Market trends
- HPI YoY
- ▼ -122.78%
- Current HPI
- 208.4818
- Rent YoY
- ▲ 5.89%
- Metro
- Torrington, CT
- State GDP YoY
- ▲ 1.06%
- F500 in state
- 38
Industry mix (Fortune 500 HQ in CT)
| Industry | F500 HQs | Revenue |
|---|---|---|
| Industrial Machinery | 4 | $38B |
|
||
| Insurance | 3 | $71B |
|
||
| Financial Services | 2 | $25B |
|
||
| Transportation / Logistics | 2 | $18B |
|
||
| Healthcare | 1 | $247B |
|
||
| Telecommunications | 1 | $55B |
|
||
Price history
4 events — show timeline
- 2026-05-05 Pending — Smart MLS
- 2026-04-29 Relisted — Smart MLS
- 2026-04-29 Listing Removed — Smart MLS
- 2026-04-28 Listed $315,000 Smart MLS
Property tax history
+0.5%/yrLatest (2023): $3,899 · +1.7% YoY. Source: county tax records.
Cash-flow waterfall
monthlySold comps — $/sqft
last 12 mo · ≤1 miLoading sold comps…