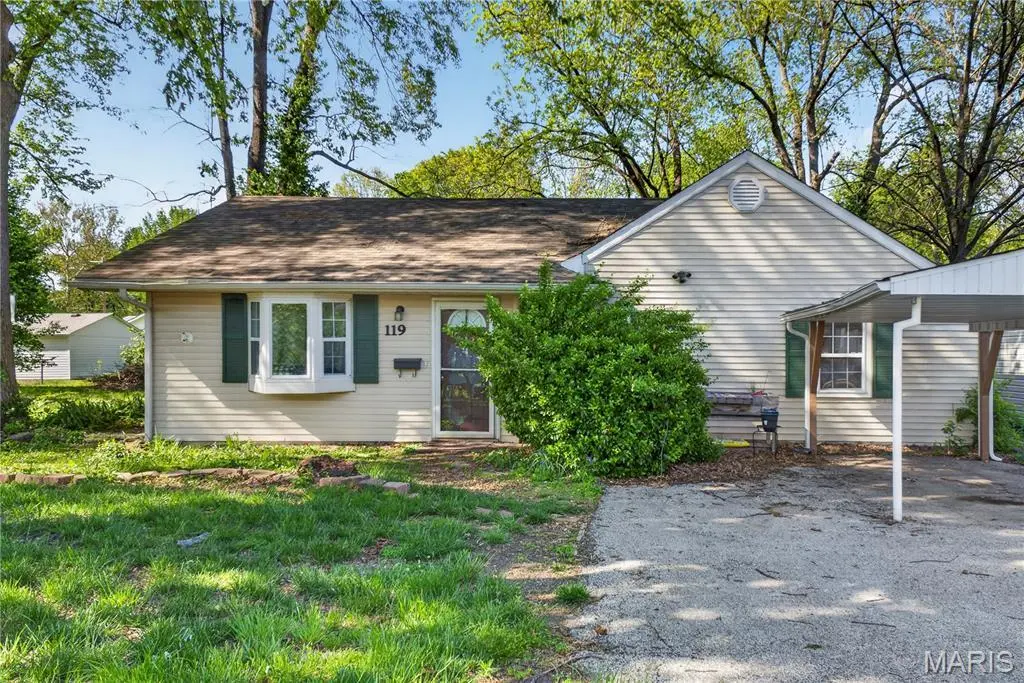
119 S 37th St · Belleville, IL
Flood risk 1/10 · Minimal
- FEMA flood zone
- —
- Chance of flooding over 30 yrs
- 0.0%
- Est. flood insurance / yr
- —
Fire risk 1/10 · Minimal
- Est. fire insurance / yr
- $804 – $1,492
Heat risk 5/10 · Moderate
- Hot days now (above 107°F)
- 7 days/yr
- Hot days in 30 yrs
- 21 days/yr
Wind risk 2/10 · Minimal
- Chance of severe wind over 30 yrs
- 1.0%
Air-quality risk 4/10 · Minor
- Unhealthy air days now
- 3 days/yr
- Unhealthy air days in 30 yrs
- 6 days/yr
Risk factors via First Street. Map © Google.
Why this score? — see what drove the C grade
The composite is a weighted blend of 9 inputs, each scored 0–100. Each bar is that input's sub-score; the figure is the points it added to the 100-point composite (weight × sub-score).
- Cash flow +20.4/30.0
- ARV discount +12.4/15.0
- DSCR +6.5/10.0
- 1% rule +6.0/10.0
- Livability +3.9/5.0
- Rent growth +3.6/5.0
- Condition / age +2.5/5.0
- Schools +2.2/10.0
- Appreciation +0.0/10.0
$113,999
🖨 Deal sheet (PDF) 📄 Offer letter ✓ Due diligence
Listing remarks
Exceptional Investment Opportunity – in Belleville! Property is being sold as is. This is your opportunity to acquire a portfolio of single-family residential investment properties. The one listed here is a Three Bedroom, One Bath, with a covered patio. All currently tenant occupied and producing income. This package offers immediate cash flow with established tenants already in place, making it an ideal addition for investors seeking stable rental assets and portfolio growth. Properties are located within Belleville and provide long-term investment potential in a strong rental market. Whether expanding an existing portfolio or entering the investment space, this package presents the
Key facts
- 9,147 sq ft lot
- Built 1947
- Listed 27 days
Property features AI
Finance
- Other: Property type: Residential (Single Family Residence)
- Financial info: Lease not considered
Exterior
- Parking: Driveway
- Utilities: Public water; Public sewer; Electric service by Ameren; Electricity available; Sewer available; Water available and connected
- Home design: Single-family residence; One-level home; Entry with panel door(s)
- Construction: Vinyl siding; Shingle roof; Slab foundation; Built (year source: Assessor)
- Exterior features: Covered porch/patio; Back yard
Interior
- Bedrooms: 3 bedrooms (all on the main level)
- Flooring: Vinyl flooring
- Bathrooms: 1 full bathroom (on the main level)
- Heating & cooling: Forced air heating; Central air conditioning
- Interior features: Ceiling fan(s); Display window(s)
- Laundry & utility: Laundry located inside
Neighborhood map
What this means for you Summary
Snapshot
- This is a 3-bed/3.0-bath single-family listed at $114k.
Deal economics
- At list price, monthly cash flow is $148 ($2k/yr) — positive.
- The deal already cash-flows at list — no discount required.
- Meets the 1% rule at list price ($1k rent vs $114k).
- Recommended offer: $112k (1.5% below list) — sets the bar for market timing.
- Cap rate 7.9% vs local median 5.6% in Belleville — top-decile yield for the area; either an underpriced asset or a hidden risk that comps aren't pricing in. Stress-test before assuming the spread holds.
Location & tenants
- Location reads 78/100 on livability (#142 in IL, #2,604 nationally) — a middle-class / working-renter tenant base. Strengths: commute A+, cost of living A+, housing A+; Watch: crime F, amenities D-.
- Belleville Twp Hsd 201 (suburban): math 21% / reading 28% proficiency, ranked #308 of 620 in IL (top 50%) — low school quality limits family demand, transient renter base, plan for 1-2y turnover.
- Zoned schools: Belleville High School-West (math 19% / reading 26%, grade F, #317 of 693 statewide, top 46%, 2,234 students, 0% FRL).
- Market conditions: Rents rising fast (+4.6%/yr); 190 active listings in the ZIP; 13 comparable units currently listed for rent nearby; rentals at typical pace (median 25d on market — plan ~3-4 weeks tenant-placement turnaround); 783 units permitted in St. Clair County in 2024 (378 in 5+ unit buildings).
Forward outlook
- Local home prices are declining (-3.0%/yr); year-one equity from $788 of loan paydown is wiped out by about $3k of value loss. Plan a longer hold.
- St. Clair County population projected at -23% by 2050 — secular population decline; favor cash flow + early exit over multi-decade hold.
Negotiation context
- It's been on market 28 days — a 2% lower offer ($112k) is reasonable based on typical stale-listing flexibility.
- 4 sale attempts since 11y ago with the ask held roughly flat each time — persistent listings suggest the price (not the market) is what's stuck; bring a comps-based counter.
Risks & watch-outs
- Watch-outs: built in 1947 — expect roof / HVAC / electrical / plumbing capex.
- Climate carrying-cost: extreme-heat days projected 7→21/yr by 2055 (HVAC capex compounding) — expect insurance premiums to compound above CPI over the hold.
Questions for the listing agent
- Built in 1947 — when were the roof, HVAC, electrical panel, plumbing, and water heater last replaced?
- Is there a deadline driving the sale (1031 exchange, divorce, estate, relocation)? That informs how much negotiation room exists.
- Crime grade is F in this area — have there been break-ins, vandalism, or insurance claims at this property in the last 3 years? What carrier currently insures it and at what premium?
- What's the average days-on-market for RENTAL listings here right now (not sales)? A rising rental-DOM trend means longer vacancies and softer asking-rent achievability than the comps imply.
- What's the recent tenant-quality profile in this submarket — average credit score on applications, eviction rate, late-payment / NSF rate, and stable-employment percentage? A property-management company in the area should have these aggregated.
- How much new for-sale + rental construction is in the pipeline within 1–3 miles? Heavy new supply typically softens prices + rents 12–24 months out; constrained supply supports both.
Investment metrics
- 1% rule
- 1.10% ✓
- Cap rate
- 7.85%
- Cash-on-cash
- 5.57%
- DSCR
- 1.25
- GRM
- 7.6
CMA / ARV
- ARV (on-the-fly)
- $127,832
- Comps found
- 12
Show comp detail 12 sales within ~0.75 mi
| Address | Dist | Beds/Ba | Sqft | Sold | Price | $/sf | Match |
|---|---|---|---|---|---|---|---|
| 141 S 35th St | 0.08mi | 3/1.0 | 1,150 (+4%) | 3mo | $133,000 | $116 | 78 |
| 3700 Michelle Dr | 0.06mi | 2/1.0 (-1) | 1,034 (-6%) | 0mo | $139,900 | $135 | 74 |
| 145 S 34th St | 0.15mi | 2/1.0 (-1) | 1,066 (-3%) | 2mo | $159,900 | $150 | 73 |
| 301 N 37th St | 0.35mi | 2/1.5 (-1) | 1,090 (-1%) | 3mo | $139,900 | $128 | 69 |
| 2932 Godfrey St | 0.38mi | 3/2.0 | 1,008 (-8%) | 2mo | $199,900 | $198 | 62 |
| 2932 Otto St | 0.39mi | 3/1.5 | 1,008 (-8%) | 2mo | $150,000 | $149 | 60 |
| 600 S 29th St | 0.49mi | 3/1.0 | 1,194 (+8%) | 1mo | $79,900 | $67 | 54 |
| 435 N 38th St | 0.46mi | 2/1.0 (-1) | 997 (-10%) | 1mo | $50,000 | $50 | 48 |
| 120 N 46th St | 0.59mi | 2/1.0 (-1) | 1,028 (-7%) | 0mo | $40,000 | $39 | 48 |
| 128 Freedom Dr | 0.52mi | 3/1.0 | 968 (-12%) | 0mo | $75,000 | $77 | 47 |
| 2709 Sassy Ln | 0.57mi | 2/1.0 (-1) | 1,008 (-8%) | 3mo | $103,000 | $102 | 44 |
| 3705 Little Flower Ln | 0.60mi | 4/1.0 (+1) | 1,228 (+11%) | 3mo | $120,000 | $98 | 38 |
Match score weights: distance 35% · size 25% · config 20% · recency 20%. Top-matched comps best support the ARV.
Projected returns pro-forma
-3.0% appreciation · 4.56% rent growth · sell at horizon
- IRR
- -5.8%
- Equity multiple
- 0.78×
- Total profit
- $-6,984
- Equity at exit
- $16,998
- IRR
- 5.8%
- Equity multiple
- 1.46×
- Total profit
- $14,759
- Equity at exit
- $9,857
Cash invested: $31,920 (down + closing). Projections, not guarantees.
Landlord ↔ Tenant lean methodology
- Overall (STATE)
- 43 Moderately Tenant-Leaning
- State Illinois
- 43 Moderately Tenant-Leaning · D+7
- County
- — inherits STATE
- City
- — inherits STATE
ZIP-level market 62226
- Rents YoY
- 4.6%
- Active inventory
- 190
- Price-to-rent
- 7.6×
Monthly cashflow live
- Estimated rent
- $1,255 high interval (Pro) →
- Mortgage (P&I)
- −$598
- Tax from tax record
- −$198 /mo · $2,378/yr
- Insurance
- −$47
- HOA
- −$0
- Vacancy / Maint / Mgmt
- −$264
- Net cashflow
- $148
Break-even live
Sensitivity live
| Price | -10% $213 | -5% $180 | +0% $148 | +5% $116 | +10% $84 |
|---|---|---|---|---|---|
| Rent | -10% $49 | -5% $99 | +0% $148 | +5% $198 | +10% $247 |
| Rate | -1.0pp $206 | -0.5pp $177 | base $148 | +0.5pp $119 | +1.0pp $89 |
UW: 25.0% down · 7.5% · 30yr · 1.5% tax · 5.0% vac · 8.0% maint · 8.0% mgmt
Financing live
Cash to close
- Down payment
- $28,500
- Closing costs
- $3,420
- Reserves months
- —
- Total cash needed
- —
Loan-product check · same deal, 3 products live
Conventional
25% down · 7.5% · 30yr
- Down + closing
- —
- Monthly P&I
- —
- Monthly cashflow
- —
- DSCR
- —
- Eligible?
- —
Personal DTI + credit; lowest rate.
DSCR
20% down · 8.5% · 30yr
- Down + closing
- —
- Monthly P&I
- —
- Monthly cashflow
- —
- DSCR
- —
- Eligible?
- —
No personal income docs; deal must DSCR.
Hard money
10% down · 12.0% · 12mo
- Down + closing
- —
- Monthly P&I
- —
- Monthly cashflow
- —
- DSCR
- —
- Eligible?
- —
Short-term bridge; refi at stabilization.
Rent comps 13 comps
| Address | Beds | Baths | Sqft | Rent | $/sqft | DOM | Units | Dist |
|---|---|---|---|---|---|---|---|---|
| 56 Friendly Dr Belleville, IL | 2.0 | 1.0 | 1000 | $1,550 | $1.55 | 25d | 1 | 0.47mi |
| 213 Columbus Dr Belleville, IL | 3.0 | 1.0 | 1040 | $1,650 | $1.59 | 25d | 1 | 0.59mi |
| 31 S 27th St Belleville, IL | 2.0 | 1.0 | 1000 | $915 | $0.92 | 25d | 1 | 0.66mi |
| 219 Freedom Dr Unit 228-P Belleville, IL | 2.0 | 1.0 | 936 | $970 | $1.04 | 25d | 1 | 0.68mi |
| 219 Freedom Dr Unit 232-B Belleville, IL | 2.0 | 1.0 | 936 | $895 | $0.96 | 25d | 1 | 0.68mi |
| 219 Freedom Dr Unit 228-G Belleville, IL | 2.0 | 1.0 | 936 | $895 | $0.96 | 5d | 1 | 0.68mi |
| 219 Freedom Dr Unit 238-I Belleville, IL | 2.0 | 1.0 | 936 | $895 | $0.96 | 0d | 1 | 0.68mi |
| 219 Freedom Dr Unit 232-Q Belleville, IL | 2.0 | 1.0 | 936 | $895 | $0.96 | 19d | 1 | 0.68mi |
| 654 N 39th St Belleville, IL | 3.0 | 1.0 | 984 | $1,400 | $1.42 | 19d | 1 | 0.80mi |
| 4824 Bier St Belleville, IL | 4.0 | 1.0 | 1200 | $1,350 | $1.12 | 4d | 1 | 0.80mi |
| 1912 N 17th St Swansea, IL | 2.0 | 1.0 | 1414 | $1,500 | $1.06 | 19d | 1 | 1.08mi |
| 1000 Royal Heights Rd Belleville, IL | 2.0 | 1.5 | 1100 | $1,345 | $1.22 | 25d | 1 | 1.14mi |
| 54 Ben Louis Dr Belleville, IL | 2.0 | 1.0 | 900 | $1,145 | $1.27 | 25d | 1 | 1.23mi |
Listing history 24 events
-
2026-06-21days on market $113,999 Active 28 DOM
-
2026-06-18days on market $113,999 Active 25 DOM
-
2026-06-17days on market $113,999 Active 24 DOM
-
2026-06-16days on market $113,999 Active 23 DOM
-
2026-06-15days on market $113,999 Active 22 DOM
-
2026-06-13days on market $113,999 Active 20 DOM
-
2026-06-09days on market $113,999 Active 16 DOM
-
2026-06-08days on market $113,999 Active 15 DOM
-
2026-06-07days on market $113,999 Active 14 DOM
-
2026-06-03days on market $113,999 Active 10 DOM
-
2026-06-02days on market $113,999 Active 9 DOM
-
2026-06-01days on market $113,999 Active 8 DOM
-
2026-05-31days on market $113,999 Active 7 DOM
-
2026-05-22historical $113,999
-
2025-09-15$114,999 Active
-
2025-05-19status Active
-
2025-02-10$130,000 Active
-
2023-07-17soldstatus $115,000
-
2023-07-17soldstatus $1,369,000
-
2023-03-16soldstatus $47,500
-
2015-10-20soldstatus
-
2015-05-20$44,900
-
2007-04-30soldstatus $78,000
-
1998-06-15soldstatus $57,000
ⓘ Source: listings_history table (triggers on properties + properties_extension) + one-shot
backfill from property_details.listing_events for pre-trigger history.
Tax reassessment forecast IL · Partial reset (capped growth)
- Current annual tax
- $2,378 · $198/mo
- Projected year-2 tax
- $2,483 · $207/mo
- Expected delta
- +$105/yr (+$9/mo · 4.4%)
ⓘ Screening estimate from a state-policy table — verify with the county assessor before closing.
Climate risk First Street
- Flood 1/10 Low 0% chance over 30 yrs
- Wildfire 1/10 Low
- Heat 5/10 Major 7 d/yr ≥107°F today · 21 d/yr by 30 yrs out
- Wind 2/10 Low 100% chance of damaging wind over 30 yrs
- Air quality 4/10 Moderate 3 unhealthy d/yr today · 6 by 30 yrs out
Nearby sold comps map
Loading sold comps map…
Walkable amenities ~0.75 mi
Loading nearby amenities…
Taxation est. · year 1
- Rental income
- $15,063
- − Mortgage interest
- −$6,386
- − Property taxes
- −$2,378
- − Insurance
- −$570
- − Repairs & maintenance
- −$1,205
- − Management
- −$1,205
- − Depreciation
- −$3,316
- Taxable income
- $3
- Est. tax owed @ 24.0%
- −$1
- After-tax cash flow
- $1,777/yr
For passive investors: Depreciation is non-cash, so a rental often shows a tax loss while cash-flowing — sheltering income. Rental losses are passive: they offset passive income freely, and up to $25,000/yr can offset ordinary (W-2) income if you actively participate and your MAGI is under $100k (phasing out to $0 by $150k); unused losses carry forward. On sale, claimed depreciation is recaptured at up to 25%, and gains may owe capital-gains tax (a 1031 exchange can defer both). Figures are a year-1 estimate at your 24.0% rate — not tax advice; consult a CPA.
Schools (NCES district)
- District
- Belleville Twp Hsd 201
- NCES district ID
- 1705640
- Math proficiency
- 21% ▼ -8.00%
- Reading proficiency
- 28% ▼ -3.00%
- Median HH income
- $58,064
- Composite
- 22.39/100
- National rank
- #8115
- State rank
- #308 of 620 in IL
Livability — Belleville
- Score
- 78/100
- State rank
- #142
- US rank
- #2604
Category grades
Schools grade is shown separately in the Schools card above.
Census & demographics
- Census place
- Belleville, IL
- County
- Saint Clair County · 169,691 people
- City population
- 47,407
- Metro
- St. Louis, MO-IL
- Population (ZIP)
- 28,255
- Household income
- $70,797
- Rent vs Own
- Severe rent burden
- 824.0
Population outlook (St. Clair County) Hauer SSP2
- Today (2025)
- 250,366 people
- By 2030
- 240,511 · -3.9%
- By 2040
- 217,391 · -13.2%
- By 2050
- 192,699 · -23.0%
- By 2075
- 140,637 · -43.8%
- By 2100
- 100,499 · -59.9%
Race, ethnicity, and origin ACS 2023
- Neighborhood character
- Majority White (64%)
- Race & ethnicity
- White 64% Black 24% Two or more races 7% Hispanic / Latino 3% Asian 2%
- Common ancestry
- Romanian 4% Lithuanian 2% Slovak 2%
- Foreign-born
- 4% · Canada, China
- Languages at home
- 96% English-only · Chinese 1% Spanish 1%
Political lean MEDSL · St. Clair
- 2024 margin
- Lean D (+7.9) · D 53.0% · R 45.1% · Other 1.8%
- 2008→2024 swing
- -14.6pp toward R · 2008: 22.4pp · 2024: 7.9pp
- All cycles
- 2024: D+7.9 2020: D+8.7 2016: D+5.6 2012: D+14.5 2008: D+22.4
Not yet ingested
- Civics
- —
Market trends
- HPI YoY
- ▼ -83.57%
- Current HPI
- 133.9028
- Rent YoY
- ▲ 4.56%
- Metro
- St. Louis, MO-IL
- State GDP YoY
- ▲ 1.59%
- F500 in state
- 60
Industry mix (Fortune 500 HQ in IL)
| Industry | F500 HQs | Revenue |
|---|---|---|
| Insurance | 4 | $201B |
|
||
| Consumer Goods | 4 | $87B |
|
||
| Industrial Machinery | 3 | $64B |
|
||
| Healthcare | 2 | $55B |
|
||
| Retail / Pharmacy | 1 | $148B |
|
||
| Agriculture / Food | 1 | $86B |
|
||
Price history
+100.0% since first listed11 events — show timeline
- 2026-05-22 Coming Soon $113,999 MARIS as Distributed by MLS Grid
- 2025-09-15 Listed $114,999 MARIS as Distributed by MLS Grid
- 2025-05-19 Relisted — MARIS as Distributed by MLS Grid
- 2025-02-10 Listed $130,000 MARIS as Distributed by MLS Grid
- 2023-07-17 Sold (Public Records) $1,369,000 Public Records
- 2023-07-17 Sold (Public Records) $115,000 Public Records
- 2023-03-16 Sold (Public Records) $47,500 Public Records
- 2015-10-20 Sold (MLS) — MARIS as Distributed by MLS Grid
- 2015-05-20 Listed $44,900 MARIS as Distributed by MLS Grid
- 2007-04-30 Sold (Public Records) $78,000 Public Records
- 1998-06-15 Sold (Public Records) $57,000 Public Records
Property tax history
+3.9%/yrLatest (2024): $2,378 · +2.5% YoY. Source: county tax records.
Cash-flow waterfall
monthlySold comps — $/sqft
last 12 mo · ≤1 miLoading sold comps…