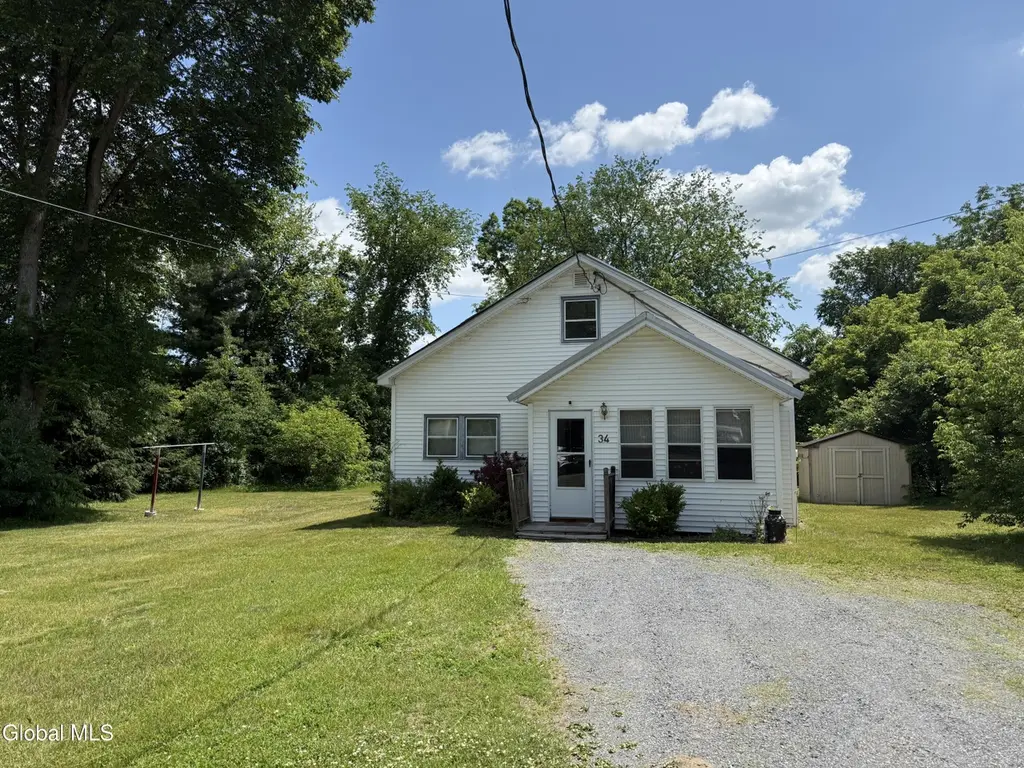
34 Mallory Ave · West Glens Falls, NY
Flood risk 1/10 · Minimal
- FEMA flood zone
- X
- Chance of flooding over 30 yrs
- 0.0%
- Est. flood insurance / yr
- $507 – $1,088
Fire risk 3/10 · Minor
- Est. fire insurance / yr
- $691 – $1,283
Heat risk 3/10 · Minor
- Hot days now (above 96°F)
- 7 days/yr
- Hot days in 30 yrs
- 16 days/yr
Wind risk 2/10 · Minimal
- Chance of severe wind over 30 yrs
- 3.0%
Air-quality risk 1/10 · Minimal
- Unhealthy air days now
- 0 days/yr
- Unhealthy air days in 30 yrs
- 0 days/yr
Risk factors via First Street. Map © Google.
Why this score? — see what drove the B grade
The composite is a weighted blend of 9 inputs, each scored 0–100. Each bar is that input's sub-score; the figure is the points it added to the 100-point composite (weight × sub-score).
- Cash flow +30.0/30.0
- 1% rule +10.0/10.0
- DSCR +10.0/10.0
- ARV discount +7.5/15.0
- Schools +4.1/10.0
- Livability +3.6/5.0
- Rent growth +2.5/5.0
- Condition / age +2.5/5.0
- Appreciation +0.0/10.0
$115,000
🖨 Deal sheet 📄 Offer letter ✓ Due diligence
Listing remarks
Calling all investors, flippers, and handy homeowners! This is an opportunity you won't want to miss. Conveniently located between Queensbury and Glens Falls with easy access to I-87, this charming home is full of potential and ready for its next chapter. Whether you're looking for a renovation project to live in while you build equity or your next investment flip, this property offers endless possibilities. Situated on a spacious 0.68-acre lot, the home features a first-floor bedroom and full bath with new walk-in shower (bathroom is somewhat updated but needs some finishing touches), along with beautiful original parquet hardwood floors that could truly shine with restoration. The kitchen
Key facts
- First-floor bedroom
- Full laundry room
- 0.68 acre lot
Tags
Property features AI
Exterior
- Parking: Space for 6 vehicles; Stone driveway
- Utilities: Public water; Septic tank
- Home design: Single-family residence; Fixer condition
- Construction: Vinyl siding; Metal roof
- Exterior features: Enclosed front porch; Shed(s) on the property
Interior
- Kitchen: Microwave; Range; Range hood; Refrigerator
- Bedrooms: First-floor bedroom; Two second-floor bedrooms
- Flooring: Vinyl; Carpet; Ceramic tile; Hardwood; Linoleum
- Bathrooms: 1 full bathroom on the first floor
- Heating & cooling: Baseboard heating; Electric heating
- Interior features: 8 total rooms; Crawl space basement with interior entry (unfinished)
- Laundry & utility: Main level laundry room; Washer/Dryer included
Neighborhood map
What this means for you Summary
Snapshot
- This is a 4-bed/1.0-bath single-family listed at $115k.
Deal economics
- At list price, monthly cash flow is $545 ($7k/yr) — positive.
- The deal already cash-flows at list — no discount required.
- Meets the 1% rule at list price ($2k rent vs $115k).
- Cap rate 12.0% vs local median 2.4% in West Glens Falls — top-decile yield for the area; either an underpriced asset or a hidden risk that comps aren't pricing in. Stress-test before assuming the spread holds.
Location & tenants
- Location reads 71/100 on livability (#388 in NY) — a middle-class / working-renter tenant base. Strengths: employment A+, housing A+, health & safety A+; Watch: crime C-, cost of living C-, amenities F.
- Glens Falls City School District (urban): math 44% / reading 53% proficiency, ranked #416 of 590 in NY (top 70%) — families likely to look elsewhere, expect single-tenant / working-renter base with shorter leases.
- Zoned schools: Glens Falls Senior High School (math 98% / reading 64%, grade A, #485 of 1,100 statewide, top 45%, 601 students, 41% FRL).
- Zoned-school proficiency averages 81% at this address vs 48% district-wide (+32 pts) — the actual schools serving this property are materially stronger than the Glens Falls City School District average implies; a family-tenant draw the district grade alone would hide.
- Market conditions: 160 active listings in the ZIP; 1 comparable units currently listed for rent nearby; 180 units permitted in Warren County in 2024 (40 in 5+ unit buildings).
Forward outlook
- Local home prices are declining (-3.0%/yr); year-one equity from $795 of loan paydown is wiped out by about $3k of value loss. Plan a longer hold.
- Warren County population projected at -19% by 2050 — secular population decline; favor cash flow + early exit over multi-decade hold.
- At projected returns (-3.0% appreciation + 3.0% rent growth), your $32k cash investment doubles in ~6 years — after that, you're playing with house money.
Negotiation context
- Only 4 days on market — expect competitive offers; lowballing is unlikely to land.
Risks & watch-outs
- Watch-outs: built in 1940 — expect roof / HVAC / electrical / plumbing capex.
Questions for the listing agent
- Built in 1940 — when were the roof, HVAC, electrical panel, plumbing, and water heater last replaced?
- Is there a deadline driving the sale (1031 exchange, divorce, estate, relocation)? That informs how much negotiation room exists.
- Schools are F-rated, which usually means shorter tenancies and higher turnover. Who's the typical renter profile here, and what's been the actual vacancy rate?
- What's the average days-on-market for RENTAL listings here right now (not sales)? A rising rental-DOM trend means longer vacancies and softer asking-rent achievability than the comps imply.
- What's the recent tenant-quality profile in this submarket — average credit score on applications, eviction rate, late-payment / NSF rate, and stable-employment percentage? A property-management company in the area should have these aggregated.
- How much new for-sale + rental construction is in the pipeline within 1–3 miles? Heavy new supply typically softens prices + rents 12–24 months out; constrained supply supports both.
Investment metrics
- 1% rule
- 1.56% ✓
- Cap rate
- 11.98%
- Cash-on-cash
- 20.30%
- DSCR
- 1.90
- GRM
- 5.3
CMA / ARV
- ARV (on-the-fly)
- $233,610
- Comps found
- 12
Show comp detail 12 sales within ~0.75 mi
| Address | Dist | Beds/Ba | Sqft | Sold | Price | $/sf | Match |
|---|---|---|---|---|---|---|---|
| 30 Mallory Ave | 0.03mi | 3/1.0 (-1) | 1,224 (+2%) | 11mo | $205,000 | $167 | 81 |
| 174 Upper Sherman Ave | 0.07mi | 3/2.5 (-1) | 1,298 (+8%) | 8mo | $270,000 | $208 | 65 |
| 26 Holden Ave | 0.14mi | 3/1.0 (-1) | 1,040 (-13%) | 2mo | $322,000 | $310 | 65 |
| 5 Quade St | 0.40mi | 3/1.0 (-1) | 1,237 (+3%) | 8mo | $234,000 | $189 | 64 |
| 68 1st St | 0.52mi | 3/1.0 (-1) | 1,266 (+6%) | 1mo | $252,000 | $199 | 60 |
| 59 First St | 0.53mi | 3/1.5 (-1) | 1,249 (+4%) | 8mo | $90,000 | $72 | 54 |
| 52 Staple St | 0.69mi | 4/1.0 | 1,138 (-5%) | 8mo | $251,500 | $221 | 53 |
| 10 Caroline St | 0.49mi | 3/1.5 (-1) | 1,296 (+8%) | 5mo | $265,000 | $204 | 52 |
| 1 Thomas St | 0.44mi | 3/1.0 (-1) | 1,056 (-12%) | 6mo | $200,000 | $189 | 50 |
| 69 Knight St | 0.74mi | 3/1.0 (-1) | 1,280 (+7%) | 6mo | $250,000 | $195 | 44 |
| 2 New St | 0.73mi | 3/1.5 (-1) | 1,059 (-12%) | 1mo | $195,000 | $184 | 39 |
| 31 2nd Street St | 0.69mi | 3/1.5 (-1) | 1,352 (+13%) | 12mo | $247,450 | $183 | 30 |
Match score weights: distance 35% · size 25% · config 20% · recency 20%. Top-matched comps best support the ARV.
Projected returns pro-forma
-3.0% appreciation · 3.0% rent growth · sell at horizon
- IRR
- 12.6%
- Equity multiple
- 1.50×
- Total profit
- $16,139
- Equity at exit
- $17,147
- IRR
- 21.5%
- Equity multiple
- 2.83×
- Total profit
- $59,039
- Equity at exit
- $9,943
Cash invested: $32,200 (down + closing). Projections, not guarantees.
Landlord ↔ Tenant lean methodology
- Overall (STATE)
- 15 Strongly Tenant-Friendly
- State New York
- 15 Strongly Tenant-Friendly · D+10
- County
- — inherits STATE
- City
- — inherits STATE
ZIP-level market 12804
- Home prices YoY
- -9.0%
- Active inventory
- 160
- Price-to-rent
- 5.3×
Monthly cashflow live
- Estimated rent
- $1,795 medium interval (Pro) →
- Mortgage (P&I)
- −$603
- Tax from tax record
- −$222 /mo · $2,667/yr
- Insurance
- −$48
- HOA
- −$0
- Vacancy / Maint / Mgmt
- −$377
- Net cashflow
- $545
Break-even live
UW: 25.0% down · 7.5% · 30yr · 1.5% tax · 5.0% vac · 8.0% maint · 8.0% mgmt
Financing live
Cash to close
- Down payment
- $28,750
- Closing costs
- $3,450
- Reserves months
- —
- Total cash needed
- —
Loan-product check · same deal, 3 products live
Conventional
25% down · 7.5% · 30yr
- Down + closing
- —
- Monthly P&I
- —
- Monthly cashflow
- —
- DSCR
- —
- Eligible?
- —
Personal DTI + credit; lowest rate.
DSCR
20% down · 8.5% · 30yr
- Down + closing
- —
- Monthly P&I
- —
- Monthly cashflow
- —
- DSCR
- —
- Eligible?
- —
No personal income docs; deal must DSCR.
Hard money
10% down · 12.0% · 12mo
- Down + closing
- —
- Monthly P&I
- —
- Monthly cashflow
- —
- DSCR
- —
- Eligible?
- —
Short-term bridge; refi at stabilization.
Rent comps 1 comps
| Address | Beds | Baths | Sqft | Rent | $/sqft | DOM | Units | Dist |
|---|---|---|---|---|---|---|---|---|
| 173 Bay St Glens Falls, NY | 3.0 | 1.0 | 1200 | $1,795 | $1.50 | 43d | 1 | 1.22mi |
Listing history 5 events
-
2026-06-17status $115,000 Pending 4 DOM
-
2026-06-16days on market $115,000 Active 4 DOM
-
2026-06-15days on market $115,000 Active 3 DOM
-
2026-06-12remarks 699-char remark
-
2026-06-12$115,000 Active 1 DOM
ⓘ Source: listings_history table (triggers on properties + properties_extension) + one-shot
backfill from property_details.listing_events for pre-trigger history.
Tax reassessment forecast NY · Partial reset (capped growth)
- Current annual tax
- $2,667 · $222/mo
- Projected year-2 tax
- $2,667 · $222/mo
- Expected delta
- $0/yr ($0/mo · 0.0%)
ⓘ Screening estimate from a state-policy table — verify with the county assessor before closing.
Climate risk First Street
- Flood 1/10 Low FEMA zone X · 0% chance over 30 yrs
- Wildfire 3/10 Moderate
- Heat 3/10 Moderate 7 d/yr ≥96°F today · 16 d/yr by 30 yrs out
- Wind 2/10 Low 3% chance of damaging wind over 30 yrs
- Air quality 1/10 Low 0 unhealthy d/yr today · 0 by 30 yrs out
Nearby sold comps map
Loading sold comps map…
Walkable amenities ~0.75 mi
Loading nearby amenities…
Taxation est. · year 1
- Rental income
- $21,540
- − Mortgage interest
- −$6,442
- − Property taxes
- −$2,667
- − Insurance
- −$575
- − Repairs & maintenance
- −$1,723
- − Management
- −$1,723
- − Depreciation
- −$3,345
- Taxable income
- $5,064
- Est. tax owed @ 24.0%
- −$1,215
- After-tax cash flow
- $5,322/yr
For passive investors: Depreciation is non-cash, so a rental often shows a tax loss while cash-flowing — sheltering income. Rental losses are passive: they offset passive income freely, and up to $25,000/yr can offset ordinary (W-2) income if you actively participate and your MAGI is under $100k (phasing out to $0 by $150k); unused losses carry forward. On sale, claimed depreciation is recaptured at up to 25%, and gains may owe capital-gains tax (a 1031 exchange can defer both). Figures are a year-1 estimate at your 24.0% rate — not tax advice; consult a CPA.
Schools (NCES district)
- District
- Glens Falls City School District
- NCES district ID
- 3612240
- Math proficiency
- 44% ▼ -8.00%
- Reading proficiency
- 53% ▲ 6.00%
- Median HH income
- $48,216
- Composite
- 41.34/100
- National rank
- #3499
- State rank
- #416 of 590 in NY
Livability — West Glens Falls
- Score
- 71/100
- State rank
- #388
- US rank
- #6663
Category grades
Schools grade is shown separately in the Schools card above.
Census & demographics
- Census place
- West Glens Falls, NY
- Population (ZIP)
- 28,175
Population outlook (Warren County) Hauer SSP2
- Today (2025)
- 62,372 people
- By 2030
- 60,491 · -3.0%
- By 2040
- 55,616 · -10.8%
- By 2050
- 50,437 · -19.1%
- By 2075
- 40,843 · -34.5%
- By 2100
- 31,159 · -50.0%
Race, ethnicity, and origin ACS 2023
- Neighborhood character
- Predominantly White (92%)
- Race & ethnicity
- White 92% Two or more races 4% Hispanic / Latino 3%
- Common ancestry
- Lithuanian 8% Romanian 6% Slovak 4%
- Foreign-born
- 4% · Canada
- Languages at home
- 96% English-only · Spanish 2% French/Haitian/Cajun 1% German/W. Germanic 1%
Political lean MEDSL · Warren
- 2024 margin
- Toss-up / Even · D 47.9% · R 52.1%
- 2008→2024 swing
- -6.9pp toward R · 2008: 2.6pp · 2024: -4.2pp
- All cycles
- 2024: R+4.2 2020: R+0.2 2016: R+10.6 2012: D+2.1 2008: D+2.6
Not yet ingested
- Civics
- —
Market trends
- HPI YoY
- ▼ -33.40%
- Current HPI
- 337.1909
- Rent YoY
- —
- Metro
- —
- State GDP YoY
- ▲ 2.60%
- F500 in state
- 92
Industry mix (Fortune 500 HQ in NY)
| Industry | F500 HQs | Revenue |
|---|---|---|
| Financial Services | 10 | $950B |
|
||
| Consumer Goods | 9 | $162B |
|
||
| Insurance | 4 | $225B |
|
||
| Telecommunications | 2 | $144B |
|
||
| Pharmaceuticals | 2 | $112B |
|
||
| Media / Entertainment | 2 | $69B |
|
||
Price history
1 event — show timeline
- 2026-06-12 Listed $115,000 Global MLS
Property tax history
+5.1%/yrLatest (2025): $2,667 · +7.3% YoY. Source: county tax records.
Cash-flow waterfall
monthlySold comps — $/sqft
last 12 mo · ≤1 miLoading sold comps…