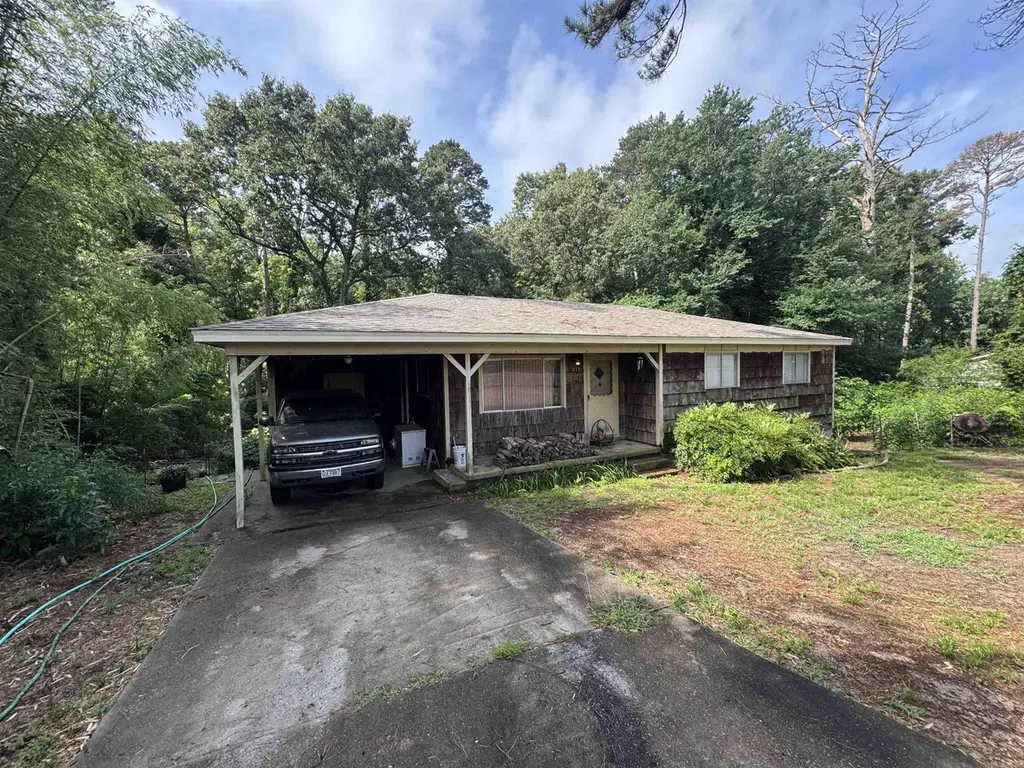
3115 Garniece Dr · Landmark, AR
Flood risk 1/10 · Minimal
- FEMA flood zone
- X (unshaded)
- Chance of flooding over 30 yrs
- 0.0%
- Est. flood insurance / yr
- $507 – $1,088
Fire risk 4/10 · Minor
- Est. fire insurance / yr
- $1,499 – $2,785
Heat risk 6/10 · Moderate
- Hot days now (above 110°F)
- 7 days/yr
- Hot days in 30 yrs
- 19 days/yr
Wind risk 4/10 · Minor
- Chance of severe wind over 30 yrs
- 12.0%
Air-quality risk 2/10 · Minimal
- Unhealthy air days now
- 0 days/yr
- Unhealthy air days in 30 yrs
- 1 days/yr
Risk factors via First Street. Map © Google.
Why this score? — see what drove the B grade
The composite is a weighted blend of 9 inputs, each scored 0–100. Each bar is that input's sub-score; the figure is the points it added to the 100-point composite (weight × sub-score).
- Cash flow +30.0/30.0
- ARV discount +15.0/15.0
- DSCR +10.0/10.0
- 1% rule +8.0/10.0
- Rent growth +3.3/5.0
- Livability +2.9/5.0
- Schools +2.6/10.0
- Condition / age +2.5/5.0
- Appreciation +0.0/10.0
$110,000
🖨 Deal sheet 📄 Offer letter ✓ Due diligence
Listing remarks
Quiet home offering room to grow and endless potential! This 4-bedroom, 2-bath property features multiple living areas, including a large den with a wood-burning stove (may not be functioning), built-in shelving, and plenty of space for gathering with family and friends. Enjoy the convenience of a 2-car garage, dedicated laundry room, and abundant storage throughout. Step outside to a screened-in porch overlooking the fenced backyard—perfect for relaxing, entertaining, or enjoying Arkansas evenings. Situated on a half acre in an established neighborhood, this home is ready for updates and priced for buyers looking to add their own style and value. Whether you're an owner-occupant seek
Key facts
- Screened in porch
- Large den
- Built in shelving
Tags
Property features AI
Finance
- Financial info: Financing options may include conventional new loan, cash, or in-house financing
Exterior
- Parking: Carport
- Utilities: Public water; Municipal electric service (Entergy available)
- Home design: Single-family property; Approximately 1,056 square feet; Lot approximately 0.54 acre
- Construction: Composition roof; Piers foundation
- Exterior features: Shaker exterior; Paved road access; Lot is sloped with level areas
Interior
- Kitchen: Free-standing stove; Electric range; Dishwasher
- Flooring: Carpet; Wood; Vinyl
- Bathrooms: 2 full bathrooms
- Heating & cooling: Central electric heat; Central electric cooling
- Interior features: Great room; Den / family room; Game room; Sun room; Bonus room; Wood-burning stove fireplace; Additional fireplace features as noted in remarks
Neighborhood map
What this means for you Summary
Snapshot
- This is a 4-bed/1.0-bath single-family listed at $110k.
Deal economics
- At list price, monthly cash flow is $449 ($5k/yr) — positive.
- The deal already cash-flows at list — no discount required.
- Meets the 1% rule at list price ($1k rent vs $110k).
- Recommended offer: $108k (1.5% below list) — sets the bar for market timing.
Location & tenants
- Location reads 57/100 on livability (#356 in AR) — a working-class tenant base; expect higher turnover. Strengths: cost of living A+, housing A-; Watch: amenities F, commute F, employment F.
- Pulaski County Spec. School District (rural): math 27% / reading 31% proficiency, ranked #150 of 238 in AR (top 63%) — low school quality limits family demand, transient renter base, plan for 1-2y turnover.
- Zoned schools: Landmark Elementary School (math 17% / reading 17%, grade F, #398 of 454 statewide, top 89%, 260 students, 100% FRL); Wilbur D. Mills High School (math 6% / reading 15%, grade F, #271 of 292 statewide, top 93%, 640 students, 99% FRL) — zoned schools average 99% FRL vs 48% district-wide (52 pts higher); higher-poverty schools than district average — tighter screening recommended.
- Zoned-school proficiency averages 14% at this address vs 29% district-wide (-15 pts) — the specific schools serving this property underperform the Pulaski County Spec. School District average; the district grade overstates school quality for this exact location.
- Market conditions: Rents rising (+3.4%/yr); 125 active listings in the ZIP; 1,006 units permitted in Pulaski County in 2024 (0 in 5+ unit buildings).
- This rent runs 33% of the median local income ($52k/yr) — at the standard rent-burdened threshold; future hikes will face affordability resistance.
Forward outlook
- Local home prices are declining (-3.0%/yr); year-one equity from $761 of loan paydown is wiped out by about $3k of value loss. Plan a longer hold.
- Pulaski County population projected at +6% by 2050 — modest demand growth; plan on rents tracking national, not racing it.
- At projected returns (-3.0% appreciation + 3.4% rent growth), your $31k cash investment doubles in ~7 years — after that, you're playing with house money.
Negotiation context
- It's been on market 16 days — a 2% lower offer ($108k) is reasonable based on typical stale-listing flexibility.
Risks & watch-outs
- Climate carrying-cost: extreme-heat days projected 7→19/yr by 2055 (HVAC capex compounding) — expect insurance premiums to compound above CPI over the hold.
Questions for the listing agent
- Built in 1964 — when were the roof, HVAC, electrical panel, plumbing, and water heater last replaced?
- Is there a deadline driving the sale (1031 exchange, divorce, estate, relocation)? That informs how much negotiation room exists.
- Schools are F-rated, which usually means shorter tenancies and higher turnover. Who's the typical renter profile here, and what's been the actual vacancy rate?
- What's the average days-on-market for RENTAL listings here right now (not sales)? A rising rental-DOM trend means longer vacancies and softer asking-rent achievability than the comps imply.
- What's the recent tenant-quality profile in this submarket — average credit score on applications, eviction rate, late-payment / NSF rate, and stable-employment percentage? A property-management company in the area should have these aggregated.
- How much new for-sale + rental construction is in the pipeline within 1–3 miles? Heavy new supply typically softens prices + rents 12–24 months out; constrained supply supports both.
Investment metrics
- 1% rule
- 1.30% ✓
- Cap rate
- 11.19%
- Cash-on-cash
- 17.48%
- DSCR
- 1.78
- GRM
- 6.4
CMA / ARV
- ARV (on-the-fly)
- $161,568
- Comps found
- 2
Show comp detail 2 sales within ~0.75 mi
| Address | Dist | Beds/Ba | Sqft | Sold | Price | $/sf | Match |
|---|---|---|---|---|---|---|---|
| 16710 Bernice Dr | 0.13mi | 3/1.5 (-1) | 1,056 (0%) | 14mo | $122,735 | $116 | 76 |
| 16706 Arch St | 0.47mi | 3/2.0 (-1) | 1,142 (+8%) | 11mo | $175,000 | $153 | 46 |
Match score weights: distance 35% · size 25% · config 20% · recency 20%. Top-matched comps best support the ARV.
Projected returns pro-forma
-3.0% appreciation · 3.36% rent growth · sell at horizon
- IRR
- 9.2%
- Equity multiple
- 1.36×
- Total profit
- $11,235
- Equity at exit
- $16,401
- IRR
- 18.7%
- Equity multiple
- 2.58×
- Total profit
- $48,595
- Equity at exit
- $9,511
Cash invested: $30,800 (down + closing). Projections, not guarantees.
Landlord ↔ Tenant lean methodology
- Overall (STATE)
- 92 Strongly Landlord-Friendly
- State Arkansas
- 92 Strongly Landlord-Friendly · R+14
- County
- — inherits STATE
- City
- — inherits STATE
ZIP-level market 72206
- Rents YoY
- 3.4%
- Active inventory
- 125
- Price-to-rent
- 6.4×
Monthly cashflow live
- Estimated rent
- $1,425 medium interval (Pro) →
- Mortgage (P&I)
- −$577
- Tax from tax record
- −$54 /mo · $651/yr
- Insurance
- −$46
- HOA
- −$0
- Vacancy / Maint / Mgmt
- −$299
- Net cashflow
- $449
Break-even live
UW: 25.0% down · 7.5% · 30yr · 1.5% tax · 5.0% vac · 8.0% maint · 8.0% mgmt
Financing live
Cash to close
- Down payment
- $27,500
- Closing costs
- $3,300
- Reserves months
- —
- Total cash needed
- —
Loan-product check · same deal, 3 products live
Conventional
25% down · 7.5% · 30yr
- Down + closing
- —
- Monthly P&I
- —
- Monthly cashflow
- —
- DSCR
- —
- Eligible?
- —
Personal DTI + credit; lowest rate.
DSCR
20% down · 8.5% · 30yr
- Down + closing
- —
- Monthly P&I
- —
- Monthly cashflow
- —
- DSCR
- —
- Eligible?
- —
No personal income docs; deal must DSCR.
Hard money
10% down · 12.0% · 12mo
- Down + closing
- —
- Monthly P&I
- —
- Monthly cashflow
- —
- DSCR
- —
- Eligible?
- —
Short-term bridge; refi at stabilization.
Listing history 13 events
-
2026-06-18days on market $110,000 Active 16 DOM
-
2026-06-17days on market $110,000 Active 15 DOM
-
2026-06-16days on market $110,000 Active 14 DOM
-
2026-06-15days on market $110,000 Active 13 DOM
-
2026-06-14days on market $110,000 Active 11 DOM
-
2026-06-13days on market $110,000 Active 10 DOM
-
2026-06-10days on market $110,000 Active 8 DOM
-
2026-06-09statusdays on market $110,000 Active 7 DOM
-
2026-06-08days on market $110,000 New Listing 6 DOM
-
2026-06-07days on market $110,000 New Listing 5 DOM
-
2026-06-05days on market $110,000 New Listing 2 DOM
-
2026-06-03remarks 693-char remark
-
2026-06-03$110,000 New Listing 1 DOM
ⓘ Source: listings_history table (triggers on properties + properties_extension) + one-shot
backfill from property_details.listing_events for pre-trigger history.
Tax reassessment forecast AR · Resets to sale price
- Current annual tax
- $651 · $54/mo
- Projected year-2 tax
- $704 · $59/mo
- Expected delta
- +$53/yr (+$4/mo · 8.2%)
ⓘ Screening estimate from a state-policy table — verify with the county assessor before closing.
Climate risk First Street
- Flood 1/10 Low FEMA zone X (unshaded) · 0% chance over 30 yrs
- Wildfire 4/10 Moderate
- Heat 6/10 Major 7 d/yr ≥110°F today · 19 d/yr by 30 yrs out
- Wind 4/10 Moderate 12% chance of damaging wind over 30 yrs
- Air quality 2/10 Low 0 unhealthy d/yr today · 1 by 30 yrs out
Nearby sold comps map
Loading sold comps map…
Walkable amenities ~0.75 mi
Loading nearby amenities…
Taxation est. · year 1
- Rental income
- $17,097
- − Mortgage interest
- −$6,162
- − Property taxes
- −$651
- − Insurance
- −$550
- − Repairs & maintenance
- −$1,368
- − Management
- −$1,368
- − Depreciation
- −$3,200
- Taxable income
- $3,799
- Est. tax owed @ 24.0%
- −$912
- After-tax cash flow
- $4,472/yr
For passive investors: Depreciation is non-cash, so a rental often shows a tax loss while cash-flowing — sheltering income. Rental losses are passive: they offset passive income freely, and up to $25,000/yr can offset ordinary (W-2) income if you actively participate and your MAGI is under $100k (phasing out to $0 by $150k); unused losses carry forward. On sale, claimed depreciation is recaptured at up to 25%, and gains may owe capital-gains tax (a 1031 exchange can defer both). Figures are a year-1 estimate at your 24.0% rate — not tax advice; consult a CPA.
Schools (NCES district)
- District
- Pulaski County Spec. School District
- NCES district ID
- 0511850
- Math proficiency
- 27% ▼ -13.00%
- Reading proficiency
- 31% ▼ -10.00%
- Median HH income
- $53,218
- Composite
- 25.67/100
- National rank
- #7394
- State rank
- #150 of 238 in AR
Livability — Landmark
- Score
- 57/100
- State rank
- #356
- US rank
- #22007
Category grades
Schools grade is shown separately in the Schools card above.
Census & demographics
- Census place
- Landmark, AR
- County
- Pulaski County · 372,764 people
- Metro
- Little Rock-North Little Rock-Conway, AR
- Population (ZIP)
- 22,667
- Household income
- $52,132
- Rent vs Own
- Severe rent burden
- 623.0
Population outlook (Pulaski County) Hauer SSP2
- Today (2025)
- 415,378 people
- By 2030
- 423,720 · +2.0%
- By 2040
- 435,182 · +4.8%
- By 2050
- 440,904 · +6.1%
- By 2075
- 445,521 · +7.3%
- By 2100
- 419,173 · +0.9%
Race, ethnicity, and origin ACS 2023
- Neighborhood character
- Diverse neighborhood (Simpson 0.59)
- Race & ethnicity
- Black 48% White 43% Two or more races 6% Hispanic / Latino 5%
- Hispanic origin (detail)
- Mexican 4%
- Common ancestry
- Iranian 1% Italian 1% Lithuanian 1%
- Foreign-born
- 1% · Canada
- Languages at home
- 94% English-only · Spanish 5%
Political lean MEDSL · Pulaski
- 2024 margin
- Strong D (+22.1) · D 59.8% · R 37.7% · Other 2.5%
- 2008→2024 swing
- +10.6pp toward D · 2008: 11.6pp · 2024: 22.1pp
- All cycles
- 2024: D+22.1 2020: D+22.5 2016: D+17.9 2012: D+11.4 2008: D+11.6
Not yet ingested
- Civics
- —
Market trends
- HPI YoY
- ▼ -88.64%
- Current HPI
- 158.3601
- Rent YoY
- ▲ 3.36%
- Metro
- Little Rock-North Little Rock-Conway, AR
- State GDP YoY
- ▲ 3.80%
- F500 in state
- 10
Industry mix (Fortune 500 HQ in AR)
| Industry | F500 HQs | Revenue |
|---|---|---|
| Retail | 1 | $681B |
|
||
| Food / Agriculture | 1 | $53B |
|
||
| Retail / Energy | 1 | $22B |
|
||
| Transportation / Logistics | 1 | $12B |
|
||
| Energy | 1 | $4B |
|
||
Price history
1 event — show timeline
- 2026-06-02 Listed $110,000 CARMLS
Property tax history
+1.2%/yrLatest (2025): $651 · +4.6% YoY. Source: county tax records.
Cash-flow waterfall
monthlySold comps — $/sqft
last 12 mo · ≤1 miLoading sold comps…