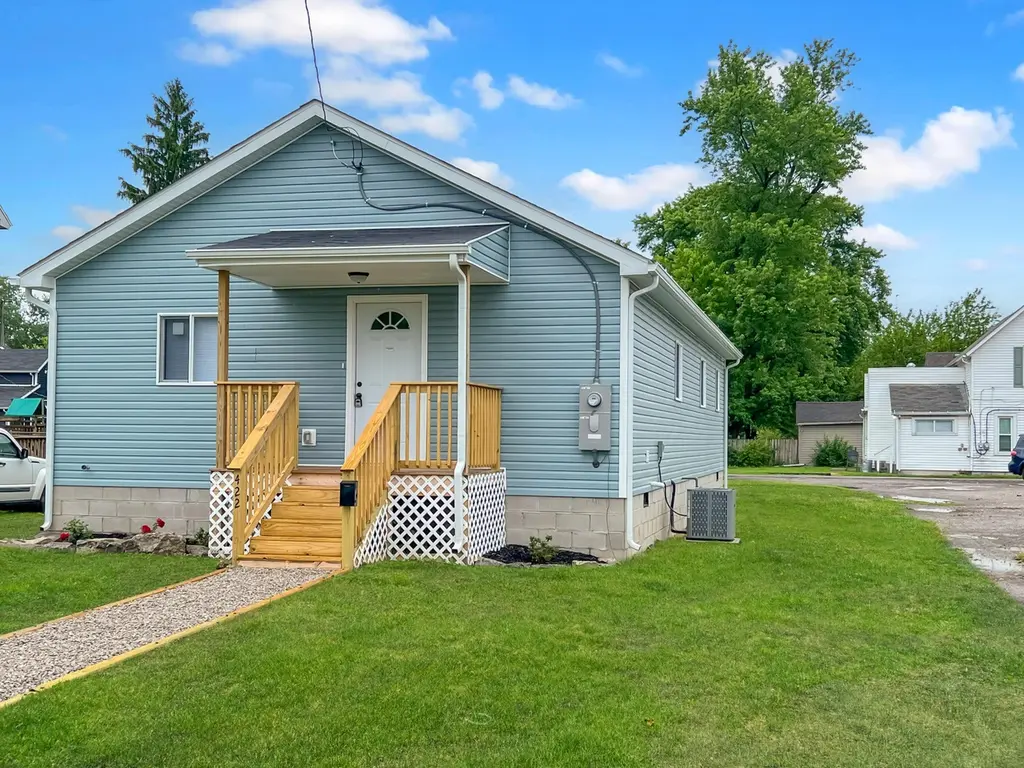
422 Silver St · Marion, OH
Flood risk 1/10 · Minimal
- FEMA flood zone
- X (unshaded)
- Chance of flooding over 30 yrs
- 0.0%
- Est. flood insurance / yr
- $507 – $1,088
Fire risk 1/10 · Minimal
- Est. fire insurance / yr
- $713 – $1,323
Heat risk 3/10 · Minor
- Hot days now (above 100°F)
- 7 days/yr
- Hot days in 30 yrs
- 18 days/yr
Wind risk 2/10 · Minimal
- Chance of severe wind over 30 yrs
- —
Air-quality risk 2/10 · Minimal
- Unhealthy air days now
- 1 days/yr
- Unhealthy air days in 30 yrs
- 1 days/yr
Risk factors via First Street. Map © Google.
Why this score? — see what drove the F grade
The composite is a weighted blend of 9 inputs, each scored 0–100. Each bar is that input's sub-score; the figure is the points it added to the 100-point composite (weight × sub-score).
- Cash flow +9.7/30.0
- ARV discount +7.5/15.0
- Livability +3.2/5.0
- 1% rule +2.9/10.0
- DSCR +2.7/10.0
- Rent growth +2.5/5.0
- Condition / age +2.5/5.0
- Schools +2.2/10.0
- Appreciation +0.0/10.0
$175,000
🖨 Deal sheet (PDF) 📄 Offer letter ✓ Due diligence
Listing remarks MLS
412 & 422 Silver Street. Two parcels for sale on the corner of Silver and Leader St. Would prefer to sell as one and total acreage is just under . 40 with both combined. Zoned R-2 and both parcels have water/sewer accessibility to connect into. Reach out for more details.
Key facts
- 8,276 sq ft lot
- Built 2026
- Listed 30 days
Property features AI
Exterior
- Utilities: Public water; Public sewer
- Home design: Single-family home; One story; New construction (2026); No shared/common walls
- Construction: Block foundation
- Exterior features: Deck
Interior
- Bedrooms: Three main-level bedrooms
- Bathrooms: Two full bathrooms
- Heating & cooling: Forced-air heating; Central air conditioning
- Interior features: Insulated windows
Neighborhood map
What this means for you Summary
Snapshot
- This is a 3-bed/2.0-bath land listed at $175k.
Deal economics
- At list price, monthly cash flow is $-116 ($-1k/yr) — negative.
- To cash-flow at today's rent, offer at most $158k (9.6% below list).
- To meet the 1% rule (rent ≥ 1% of price), the offer needs to be $138k (20.9% below list).
- Recommended offer: $138k (20.9% below list) — sets the bar for 1% rule.
- Cap rate 5.5% vs local median 6.9% in Marion — below-typical yield; the buyer is paying a premium for something (appreciation thesis, condition, location) that the cap rate doesn't capture.
Location & tenants
- Location reads 65/100 on livability (#704 in OH) — a middle-class / working-renter tenant base. Strengths: cost of living A+, housing A+; Watch: schools D+, crime D+, amenities F.
- Marion City (town): math 22% / reading 31% proficiency, ranked #600 of 656 in OH (top 92%) — low school quality limits family demand, transient renter base, plan for 1-2y turnover; 67% free/reduced lunch — lower-income household profile, screen leases tightly.
- Market conditions: 208 active listings in the ZIP; 1 comparable units currently listed for rent nearby; 53 units permitted in Marion County in 2024 (0 in 5+ unit buildings).
- This rent runs 30% of the median local income ($55k/yr) — at the standard rent-burdened threshold; future hikes will face affordability resistance.
Forward outlook
- Local home prices are declining (-3.0%/yr); year-one equity from $1k of loan paydown is wiped out by about $5k of value loss. Plan a longer hold.
- Marion County population projected at -18% by 2050 — secular population decline; favor cash flow + early exit over multi-decade hold.
Negotiation context
- It's been on market 31 days — a 3% lower offer ($170k) is reasonable based on typical stale-listing flexibility.
- 2 sale attempts since 2y ago with the ask held roughly flat each time — persistent listings suggest the price (not the market) is what's stuck; bring a comps-based counter.
- Current owner paid $16k; list at $175k implies a 977% gain — meaningful room to come down on a strong offer.
Questions for the listing agent
- What do current leases actually rent for vs. the listed asking? Can we see a recent rent roll and the last 12 months of T-12 income?
- It's been on market 31 days. Have you received any prior offers? Is the seller open to a 21% concession, seller financing, or rate buy-down credit?
- Is there a deadline driving the sale (1031 exchange, divorce, estate, relocation)? That informs how much negotiation room exists.
- Schools are D-rated, which usually means shorter tenancies and higher turnover. Who's the typical renter profile here, and what's been the actual vacancy rate?
- Crime grade is D in this area — have there been break-ins, vandalism, or insurance claims at this property in the last 3 years? What carrier currently insures it and at what premium?
- The area grade is low — what's the realistic commute time and amenity access for the typical tenant pool here? Any planned neighborhood developments (good or bad) we should know about?
- What's the average days-on-market for RENTAL listings here right now (not sales)? A rising rental-DOM trend means longer vacancies and softer asking-rent achievability than the comps imply.
- What's the recent tenant-quality profile in this submarket — average credit score on applications, eviction rate, late-payment / NSF rate, and stable-employment percentage? A property-management company in the area should have these aggregated.
- How much new for-sale + rental construction is in the pipeline within 1–3 miles? Heavy new supply typically softens prices + rents 12–24 months out; constrained supply supports both.
Investment metrics
- 1% rule
- 0.79% ✗
- Cap rate
- 5.50%
- Cash-on-cash
- -2.84%
- DSCR
- 0.87
- GRM
- 10.5
CMA / ARV
No comps found within radius.
Projected returns pro-forma
-3.0% appreciation · 3.0% rent growth · sell at horizon
- IRR
- -21.0%
- Equity multiple
- 0.27×
- Total profit
- $-35,711
- Equity at exit
- $26,093
- IRR
- -14.4%
- Equity multiple
- 0.17×
- Total profit
- $-40,508
- Equity at exit
- $15,131
Cash invested: $49,000 (down + closing). Projections, not guarantees.
Landlord ↔ Tenant lean methodology
- Overall (STATE)
- 73 Landlord-Friendly
- State Ohio
- 73 Landlord-Friendly · R+6
- County
- — inherits STATE
- City
- — inherits STATE
ZIP-level market 43302
- Home prices YoY
- -33.9%
- Active inventory
- 208
- Price-to-rent
- 10.5×
Monthly cashflow live
- Estimated rent
- $1,384 medium interval (Pro) →
- Mortgage (P&I)
- −$918
- Tax est. 1.5%
- −$219 /mo · $2,625/yr
- Insurance
- −$73
- HOA
- −$0
- Vacancy / Maint / Mgmt
- −$291
- Net cashflow
- $-116
Break-even live
Sensitivity live
| Price | -10% $5 | -5% $-55 | +0% $-116 | +5% $-176 | +10% $-237 |
|---|---|---|---|---|---|
| Rent | -10% $-225 | -5% $-170 | +0% $-116 | +5% $-61 | +10% $-6 |
| Rate | -1.0pp $-28 | -0.5pp $-71 | base $-116 | +0.5pp $-161 | +1.0pp $-207 |
UW: 25.0% down · 7.5% · 30yr · 1.5% tax · 5.0% vac · 8.0% maint · 8.0% mgmt
Financing live
Cash to close
- Down payment
- $43,750
- Closing costs
- $5,250
- Reserves months
- —
- Total cash needed
- —
Loan-product check · same deal, 3 products live
Conventional
25% down · 7.5% · 30yr
- Down + closing
- —
- Monthly P&I
- —
- Monthly cashflow
- —
- DSCR
- —
- Eligible?
- —
Personal DTI + credit; lowest rate.
DSCR
20% down · 8.5% · 30yr
- Down + closing
- —
- Monthly P&I
- —
- Monthly cashflow
- —
- DSCR
- —
- Eligible?
- —
No personal income docs; deal must DSCR.
Hard money
10% down · 12.0% · 12mo
- Down + closing
- —
- Monthly P&I
- —
- Monthly cashflow
- —
- DSCR
- —
- Eligible?
- —
Short-term bridge; refi at stabilization.
Rent comps 1 comps
| Address | Beds | Baths | Sqft | Rent | $/sqft | DOM | Units | Dist |
|---|---|---|---|---|---|---|---|---|
| 133 Garden St Unit 131 Marion, OH | 2.0 | 1.0 | 752 | $900 | $1.20 | 45d | 1 | 0.35mi |
Listing history 22 events
-
2026-06-21days on market $175,000 Active 31 DOM
-
2026-06-19days on market $175,000 Active 29 DOM
-
2026-06-18days on market $175,000 Active 28 DOM
-
2026-06-17days on market $175,000 Active 27 DOM
-
2026-06-16days on market $175,000 Active 26 DOM
-
2026-06-15days on market $175,000 Active 25 DOM
-
2026-06-14days on market $175,000 Active 23 DOM
-
2026-06-12days on market $175,000 Active 22 DOM
-
2026-06-09days on market $175,000 Active 19 DOM
-
2026-06-08days on market $175,000 Active 18 DOM
-
2026-06-07days on market $175,000 Active 17 DOM
-
2026-06-05days on market $175,000 Active 14 DOM
-
2026-06-03days on market $175,000 Active 13 DOM
-
2026-06-02days on market $175,000 Active 12 DOM
-
2026-06-01days on market $175,000 Active 11 DOM
-
2026-05-31days on market $175,000 Active 10 DOM
-
2026-05-30days on market $175,000 Active 9 DOM
-
2026-05-21$175,000 Active
-
2024-09-17soldstatus $16,250 Closed 278-char remark
Show marketing remark (278 chars)
412 & 422 Silver Street. Two parcels for sale on the corner of Silver and Leader St. Would prefer to sell as one and total acreage is just under . 40 with both combined. Zoned R-2 and both parcels have water/sewer accessibility to connect into. Reach out for more details.
-
2024-09-06status Pending 278-char remark
Show marketing remark (278 chars)
412 & 422 Silver Street. Two parcels for sale on the corner of Silver and Leader St. Would prefer to sell as one and total acreage is just under . 40 with both combined. Zoned R-2 and both parcels have water/sewer accessibility to connect into. Reach out for more details.
-
2024-08-23$20,000 Active 278-char remark
Show marketing remark (278 chars)
412 & 422 Silver Street. Two parcels for sale on the corner of Silver and Leader St. Would prefer to sell as one and total acreage is just under . 40 with both combined. Zoned R-2 and both parcels have water/sewer accessibility to connect into. Reach out for more details.
-
1996-05-03soldstatus $35,000
ⓘ Source: listings_history table (triggers on properties + properties_extension) + one-shot
backfill from property_details.listing_events for pre-trigger history.
Climate risk First Street
- Flood 1/10 Low FEMA zone X (unshaded) · 0% chance over 30 yrs
- Wildfire 1/10 Low
- Heat 3/10 Moderate 7 d/yr ≥100°F today · 18 d/yr by 30 yrs out
- Wind 2/10 Low
- Air quality 2/10 Low 1 unhealthy d/yr today · 1 by 30 yrs out
Nearby sold comps map
Loading sold comps map…
Walkable amenities ~0.75 mi
Loading nearby amenities…
Taxation est. · year 1
- Rental income
- $16,612
- − Mortgage interest
- −$9,803
- − Property taxes
- −$2,625
- − Insurance
- −$875
- − Repairs & maintenance
- −$1,329
- − Management
- −$1,329
- − Depreciation
- −$5,091
- Taxable loss
- −$4,440
- Est. tax savings @ 24.0%
- +$1,066
- After-tax cash flow
- $-324/yr
For passive investors: Depreciation is non-cash, so a rental often shows a tax loss while cash-flowing — sheltering income. Rental losses are passive: they offset passive income freely, and up to $25,000/yr can offset ordinary (W-2) income if you actively participate and your MAGI is under $100k (phasing out to $0 by $150k); unused losses carry forward. On sale, claimed depreciation is recaptured at up to 25%, and gains may owe capital-gains tax (a 1031 exchange can defer both). Figures are a year-1 estimate at your 24.0% rate — not tax advice; consult a CPA.
Schools (NCES district)
- District
- Marion City
- NCES district ID
- 3904433
- Math proficiency
- 22% ▼ -17.00%
- Reading proficiency
- 31% ▼ -8.00%
- Median HH income
- $32,327
- Composite
- 21.58/100
- National rank
- #8306
- State rank
- #600 of 656 in OH
Livability — Marion
- Score
- 65/100
- State rank
- #704
- US rank
- #12605
Category grades
Schools grade is shown separately in the Schools card above.
Census & demographics
- Census place
- Marion, OH
- County
- Marion County · 53,702 people
- City population
- 53,702
- Metro
- Marion, OH
- Population (ZIP)
- 53,702
- Household income
- $55,057
- Rent vs Own
- Severe rent burden
- 1554.0
Population outlook (Marion County) Hauer SSP2
- Today (2025)
- 62,078 people
- By 2030
- 60,049 · -3.3%
- By 2040
- 55,413 · -10.7%
- By 2050
- 50,604 · -18.5%
- By 2075
- 40,162 · -35.3%
- By 2100
- 29,105 · -53.1%
Race, ethnicity, and origin ACS 2023
- Neighborhood character
- Predominantly White (85%)
- Race & ethnicity
- White 85% Black 6% Two or more races 6% Hispanic / Latino 3%
- Common ancestry
- Slovak 2% Romanian 2% Lithuanian 2%
- Foreign-born
- 2% · Canada
- Languages at home
- 96% English-only · Spanish 2% Arabic 1%
Political lean MEDSL · Marion
- 2024 margin
- Solid R (+41.4) · D 28.9% · R 70.3%
- 2008→2024 swing
- -32.5pp toward R · 2008: -8.9pp · 2024: -41.4pp
- All cycles
- 2024: R+41.4 2020: R+38.6 2016: R+34.4 2012: R+7.6 2008: R+8.9
Not yet ingested
- Civics
- —
Market trends
- HPI YoY
- ▼ -114.52%
- Current HPI
- 223.5344
- Rent YoY
- —
- Metro
- Marion, OH
- State GDP YoY
- ▲ 1.98%
- F500 in state
- 48
Industry mix (Fortune 500 HQ in OH)
| Industry | F500 HQs | Revenue |
|---|---|---|
| Insurance | 3 | $145B |
|
||
| Industrial Machinery | 3 | $49B |
|
||
| Financial Services | 3 | $24B |
|
||
| Consumer Goods | 2 | $93B |
|
||
| Aerospace / Defense | 2 | $47B |
|
||
| Utilities | 2 | $33B |
|
||
Price history
+400.0% since first listed5 events — show timeline
- 2026-05-21 Listed $175,000 CBRMLS
- 2024-09-17 Sold (MLS) $16,250 CBRMLS
- 2024-09-06 Pending — CBRMLS
- 2024-08-23 Listed $20,000 CBRMLS
- 1996-05-03 Sold (Public Records) $35,000 Public Records
Property tax history
+1.7%/yrLatest (2025): $58 · +0.0% YoY. Source: county tax records.
Cash-flow waterfall
monthlySold comps — $/sqft
last 12 mo · ≤1 miLoading sold comps…