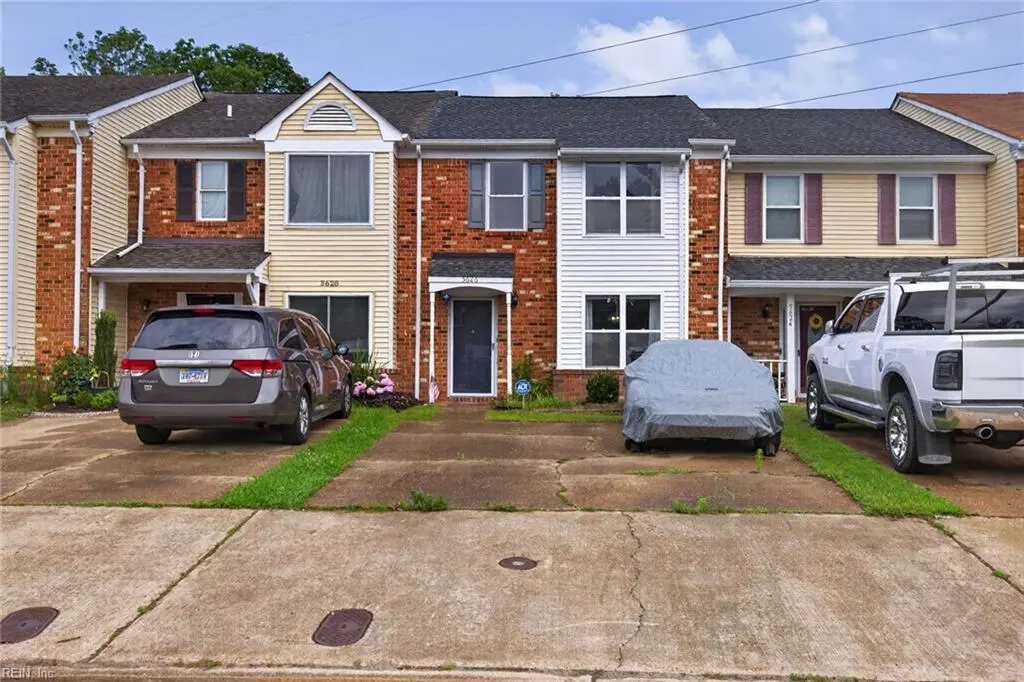
5626 Gates Landing Rd · Virginia Beach, VA
Flood risk 1/10 · Minimal
- FEMA flood zone
- X (unshaded)
- Chance of flooding over 30 yrs
- 0.0%
- Est. flood insurance / yr
- $507 – $1,088
Fire risk 1/10 · Minimal
- Est. fire insurance / yr
- $666 – $1,236
Heat risk 9/10 · Severe
- Hot days now (above 105°F)
- 7 days/yr
- Hot days in 30 yrs
- 15 days/yr
Wind risk 8/10 · Major
- Chance of severe wind over 30 yrs
- 80.0%
Air-quality risk 5/10 · Moderate
- Unhealthy air days now
- 7 days/yr
- Unhealthy air days in 30 yrs
- 7 days/yr
Risk factors via First Street. Map © Google.
Why this score? — see what drove the D grade
The composite is a weighted blend of 9 inputs, each scored 0–100. Each bar is that input's sub-score; the figure is the points it added to the 100-point composite (weight × sub-score).
- Cash flow +10.4/30.0
- ARV discount +7.5/15.0
- Schools +6.4/10.0
- Livability +4.2/5.0
- Rent growth +4.1/5.0
- DSCR +3.0/10.0
- Condition / age +2.5/5.0
- 1% rule +2.4/10.0
- Appreciation +0.0/10.0
$270,000
🖨 Deal sheet (PDF) 📄 Offer letter ✓ Due diligence
Listing remarks
Welcome to 5626 Gates Landing Rd! This beautifully updated townhouse offers the perfect blend of comfort, convenience, and scenic charm in Virginia Beach, with easy access to I-64 for effortless commuting. Inside, you'll find stylish LVP and tile flooring throughout, along with major updates that provide peace of mind, including an HVAC system replaced in 2018, a new roof in 2022, and a refrigerator installed in 2023. Featuring two spacious bedrooms and an expansive living room for entertaining family and friends, this home is designed for both relaxation and everyday living. Step outside to your private backyard retreat, where tranquil creek views and abundant wildlife create a picturesque
Key facts
- Updated townhouse
- Hvac system replaced
- Easy access to i-64
Tags
Property features AI
Finance
- HOA & community: No HOA fees
Exterior
- Parking: 2 parking spaces; Street parking
- Utilities: City/County water; City/County sewer; Electric water heater; Electric power
- Home design: Attached townhouse; 2 stories; Slab foundation; Simple ownership
- Construction: Brick and vinyl exterior; Slab foundation; Asphalt shingle roof
- Exterior features: Back yard fenced; Brick and vinyl siding; Asphalt shingle roof
Interior
- Kitchen: Electric range; Dishwasher; Refrigerator
- Bedrooms: No bedroom and full bathroom on the first floor
- Flooring: Ceramic flooring; Laminate flooring
- Bathrooms: 1 full bath; 1 half bath
- Heating & cooling: Heat pump and electric heating; Central air conditioning
- Interior features: One fireplace; Ceramic and laminate flooring; 6 total rooms
- Laundry & utility: Washer; Dryer
Neighborhood map
What this means for you Summary
Snapshot
- This is a 2-bed/1.5-bath townhouse listed at $270k.
Deal economics
- At list price, monthly cash flow is $-143 ($-2k/yr) — negative.
- To cash-flow at today's rent, offer at most $245k (9.4% below list).
- To meet the 1% rule (rent ≥ 1% of price), the offer needs to be $199k (26.3% below list).
- Recommended offer: $199k (26.3% below list) — sets the bar for 1% rule.
- Cap rate 5.7% vs local median 3.5% in Virginia Beach — top-decile yield for the area; either an underpriced asset or a hidden risk that comps aren't pricing in. Stress-test before assuming the spread holds.
Location & tenants
- Location reads 83/100 on livability (#38 in VA, #880 nationally) — a professional / high-income tenant draw. Strengths: amenities A+, employment A+, housing A+; Watch: cost of living C-, commute F.
- Va Beach City Public School District (urban): math 69% / reading 78% proficiency, ranked #10 of 131 in VA (top 8%) — strong family-tenant draw, lease renewals of 3-5y typical.
- Zoned schools: Woodstock Elementary (math 57% / reading 70%, grade B, #460 of 1,108 statewide, top 42%, 664 students, 50% FRL); Kempsville High (math 73% / reading 78%, grade A-, #105 of 319 statewide, top 33%, 2,006 students, 42% FRL) — zoned schools average 46% FRL vs 28% district-wide (18 pts higher); higher-poverty schools than district average — tighter screening recommended.
- Market conditions: Rents rising fast (+6.4%/yr); 235 active listings in the ZIP; 10 comparable units currently listed for rent nearby; rentals at typical pace (median 25d on market — plan ~3-4 weeks tenant-placement turnaround); solid renter incomes; 666 units permitted in Virginia Beach city in 2024 (347 in 5+ unit buildings).
Forward outlook
- Local home prices are declining (-3.0%/yr); year-one equity from $2k of loan paydown is wiped out by about $8k of value loss. Plan a longer hold.
- Virginia Beach County population projected at +6% by 2050 — modest demand growth; plan on rents tracking national, not racing it.
Negotiation context
- Only 7 days on market — expect competitive offers; lowballing is unlikely to land.
- 2 sale attempts since 2y ago with the ask held roughly flat each time — persistent listings suggest the price (not the market) is what's stuck; bring a comps-based counter.
Risks & watch-outs
- Climate carrying-cost: severe wind risk, 80% chance of damaging wind over 30y; extreme-heat days projected 7→15/yr by 2055 (HVAC capex compounding) — expect insurance premiums to compound above CPI over the hold.
Questions for the listing agent
- What do current leases actually rent for vs. the listed asking? Can we see a recent rent roll and the last 12 months of T-12 income?
- Is there a deadline driving the sale (1031 exchange, divorce, estate, relocation)? That informs how much negotiation room exists.
- Schools are A-rated — typically a magnet for longer-tenancy family renters. What's the average tenant stay here, and is there a school-zone premium baked into asking?
- The area grade is low — what's the realistic commute time and amenity access for the typical tenant pool here? Any planned neighborhood developments (good or bad) we should know about?
- What's the average days-on-market for RENTAL listings here right now (not sales)? A rising rental-DOM trend means longer vacancies and softer asking-rent achievability than the comps imply.
- What's the recent tenant-quality profile in this submarket — average credit score on applications, eviction rate, late-payment / NSF rate, and stable-employment percentage? A property-management company in the area should have these aggregated.
- How much new for-sale + rental construction is in the pipeline within 1–3 miles? Heavy new supply typically softens prices + rents 12–24 months out; constrained supply supports both.
Investment metrics
- 1% rule
- 0.74% ✗
- Cap rate
- 5.66%
- Cash-on-cash
- -2.27%
- DSCR
- 0.90
- GRM
- 11.3
CMA / ARV
- ARV (on-the-fly)
- $270,255
- Comps found
- 2
Show comp detail 2 sales within ~0.75 mi
| Address | Dist | Beds/Ba | Sqft | Sold | Price | $/sf | Match |
|---|---|---|---|---|---|---|---|
| 5645 Gates Landing Rd | 0.06mi | 2/1.5 | 1,257 (0%) | 8mo | $270,000 | $215 | 90 |
| 5630 Gates Landing Rd | 0.01mi | 2/1.5 | 1,377 (+10%) | 7mo | $205,000 | $149 | 78 |
Match score weights: distance 35% · size 25% · config 20% · recency 20%. Top-matched comps best support the ARV.
Projected returns pro-forma
-3.0% appreciation · 6.36% rent growth · sell at horizon
- IRR
- -16.7%
- Equity multiple
- 0.39×
- Total profit
- $-45,968
- Equity at exit
- $40,258
- IRR
- -3.8%
- Equity multiple
- 0.72×
- Total profit
- $-21,449
- Equity at exit
- $23,345
Cash invested: $75,600 (down + closing). Projections, not guarantees.
Landlord ↔ Tenant lean methodology
- Overall (STATE)
- 55 Moderately Landlord-Leaning
- State Virginia
- 55 Moderately Landlord-Leaning · D+2
- County
- — inherits STATE
- City
- — inherits STATE
ZIP-level market 23464
- Rents YoY
- 6.4%
- Active inventory
- 235
- Price-to-rent
- 11.3×
Monthly cashflow live
- Estimated rent
- $1,989 high interval (Pro) →
- Mortgage (P&I)
- −$1,416
- Tax from tax record
- −$186 /mo · $2,226/yr
- Insurance
- −$112
- HOA
- −$0
- Vacancy / Maint / Mgmt
- −$418
- Net cashflow
- $-143
Break-even live
Sensitivity live
| Price | -10% $10 | -5% $-66 | +0% $-143 | +5% $-219 | +10% $-296 |
|---|---|---|---|---|---|
| Rent | -10% $-300 | -5% $-221 | +0% $-143 | +5% $-64 | +10% $14 |
| Rate | -1.0pp $-7 | -0.5pp $-74 | base $-143 | +0.5pp $-213 | +1.0pp $-284 |
UW: 25.0% down · 7.5% · 30yr · 1.5% tax · 5.0% vac · 8.0% maint · 8.0% mgmt
Financing live
Cash to close
- Down payment
- $67,500
- Closing costs
- $8,100
- Reserves months
- —
- Total cash needed
- —
Loan-product check · same deal, 3 products live
Conventional
25% down · 7.5% · 30yr
- Down + closing
- —
- Monthly P&I
- —
- Monthly cashflow
- —
- DSCR
- —
- Eligible?
- —
Personal DTI + credit; lowest rate.
DSCR
20% down · 8.5% · 30yr
- Down + closing
- —
- Monthly P&I
- —
- Monthly cashflow
- —
- DSCR
- —
- Eligible?
- —
No personal income docs; deal must DSCR.
Hard money
10% down · 12.0% · 12mo
- Down + closing
- —
- Monthly P&I
- —
- Monthly cashflow
- —
- DSCR
- —
- Eligible?
- —
Short-term bridge; refi at stabilization.
Rent comps 10 comps
| Address | Beds | Baths | Sqft | Rent | $/sqft | DOM | Units | Dist |
|---|---|---|---|---|---|---|---|---|
| 806 Jamestowne Dr Virginia Beach, VA | 3.0 | 2.5 | 1700 | $2,000 | $1.18 | 22d | 1 | 0.13mi |
| 5519 New Colony Dr Virginia Beach, VA | 3.0 | 2.5 | 1470 | $1,795 | $1.22 | 24d | 1 | 0.20mi |
| 658 Oleander Cir Virginia Beach, VA | 2.0 | 2.5 | 1254 | $2,050 | $1.63 | 24d | 1 | 0.89mi |
| 611 Oleander Cir Virginia Beach, VA | 2.0 | 2.0 | 1250 | $1,900 | $1.52 | 15d | 1 | 1.01mi |
| 5485 Glenville Cir Virginia Beach, VA | 3.0 | 2.5 | 1588 | $2,500 | $1.57 | 24d | 1 | 1.03mi |
| 5313 Sir Barton Dr Virginia Beach, VA | 3.0 | 2.0 | 1556 | $2,750 | $1.77 | 24d | 1 | 1.18mi |
| 1048 Commonwealth Pl Virginia Beach, VA | 3.0 | 1.5 | 1242 | $2,150 | $1.73 | 24d | 1 | 1.19mi |
| 1102 Clear Springs Rd Virginia Beach, VA | 3.0 | 1.5 | 1280 | $1,695 | $1.32 | 24d | 1 | 1.28mi |
| 6308 Blakely Sq Virginia Beach, VA | 1.0–3.0 | 1.0–2.0 | 1036 | $2,164 | $2.09 | 4d | 17 | 1.38mi |
| 1101 Craftsman Dr Virginia Beach, VA | 1.0–2.0 | 1.0–2.0 | 1014 | $1,909 | $1.88 | 3d | 22 | 1.41mi |
Listing history 6 events
-
2026-06-10status $270,000 Under Contract 7 DOM
-
2026-06-09days on market $270,000 Active 7 DOM
-
2026-06-08days on market $270,000 Active 6 DOM
-
2026-06-07days on market $270,000 Active 5 DOM
-
2026-06-02remarks 699-char remark
-
2026-06-02$270,000 Active 1 DOM
ⓘ Source: listings_history table (triggers on properties + properties_extension) + one-shot
backfill from property_details.listing_events for pre-trigger history.
Tax reassessment forecast VA · Resets to sale price
- Current annual tax
- $2,226 · $186/mo
- Projected year-2 tax
- $2,226 · $186/mo
- Expected delta
- $0/yr ($0/mo · 0.0%)
ⓘ Screening estimate from a state-policy table — verify with the county assessor before closing.
Climate risk First Street
- Flood 1/10 Low FEMA zone X (unshaded) · 0% chance over 30 yrs
- Wildfire 1/10 Low
- Heat 9/10 Extreme 7 d/yr ≥105°F today · 15 d/yr by 30 yrs out
- Wind 8/10 Severe 80% chance of damaging wind over 30 yrs
- Air quality 5/10 Major 7 unhealthy d/yr today · 7 by 30 yrs out
Nearby sold comps map
Loading sold comps map…
Walkable amenities ~0.75 mi
Loading nearby amenities…
Taxation est. · year 1
- Rental income
- $23,863
- − Mortgage interest
- −$15,124
- − Property taxes
- −$2,226
- − Insurance
- −$1,350
- − Repairs & maintenance
- −$1,909
- − Management
- −$1,909
- − Depreciation
- −$7,855
- Taxable loss
- −$6,510
- Est. tax savings @ 24.0%
- +$1,562
- After-tax cash flow
- $-153/yr
For passive investors: Depreciation is non-cash, so a rental often shows a tax loss while cash-flowing — sheltering income. Rental losses are passive: they offset passive income freely, and up to $25,000/yr can offset ordinary (W-2) income if you actively participate and your MAGI is under $100k (phasing out to $0 by $150k); unused losses carry forward. On sale, claimed depreciation is recaptured at up to 25%, and gains may owe capital-gains tax (a 1031 exchange can defer both). Figures are a year-1 estimate at your 24.0% rate — not tax advice; consult a CPA.
Schools (NCES district)
- District
- Va Beach City Public School District
- NCES district ID
- 5103840
- Math proficiency
- 69% ▼ -19.00%
- Reading proficiency
- 78% ▼ -7.00%
- Median HH income
- $66,452
- Composite
- 63.81/100
- National rank
- #594
- State rank
- #10 of 131 in VA
Livability — Virginia Beach
- Score
- 83/100
- State rank
- #38
- US rank
- #880
Category grades
Schools grade is shown separately in the Schools card above.
Census & demographics
- Census place
- Virginia Beach, VA
- County
- Virginia Beach City · 448,227 people
- City population
- 448,227
- Metro
- Virginia Beach-Norfolk-Newport News, VA-NC
- Population (ZIP)
- 75,061
- Household income
- $92,468
- Rent vs Own
- Severe rent burden
- 1929.0
Population outlook (Virginia Beach County) Hauer SSP2
- Today (2025)
- 480,401 people
- By 2030
- 491,221 · +2.3%
- By 2040
- 504,882 · +5.1%
- By 2050
- 508,847 · +5.9%
- By 2075
- 504,831 · +5.1%
- By 2100
- 465,867 · -3.0%
Race, ethnicity, and origin ACS 2023
- Neighborhood character
- Diverse neighborhood (Simpson 0.68)
- Race & ethnicity
- White 50% Black 23% Asian 10% Two or more races 9% Hispanic / Latino 9%
- Hispanic origin (detail)
- Mexican 2% Puerto Rican 3%
- Common ancestry
- Slovak 2% Lithuanian 2% Italian 2%
- Foreign-born
- 11% · Canada, Vietnam, China
- Languages at home
- 85% English-only · Tagalog/Filipino 5% Spanish 5% Other Asian/Pacific 1%
Political lean MEDSL · Virginia Beach
- 2024 margin
- Toss-up / Even · D 50.7% · R 48.0% · Other 1.3%
- 2008→2024 swing
- +3.4pp toward D · 2008: -0.7pp · 2024: 2.6pp
- All cycles
- 2024: D+2.6 2020: D+5.4 2016: R+4.5 2012: R+2.5 2008: R+0.7
Not yet ingested
- Civics
- —
Market trends
- HPI YoY
- ▼ -271.27%
- Current HPI
- 324.1854
- Rent YoY
- ▲ 6.36%
- Metro
- Virginia Beach-Norfolk-Newport News, VA-NC
- State GDP YoY
- ▲ 2.40%
- F500 in state
- 50
Industry mix (Fortune 500 HQ in VA)
| Industry | F500 HQs | Revenue |
|---|---|---|
| Aerospace / Defense | 4 | $236B |
|
||
| Technology / Defense | 3 | $32B |
|
||
| Financial Services | 2 | $176B |
|
||
| Utilities | 2 | $27B |
|
||
| Insurance | 2 | $25B |
|
||
| Technology | 2 | $15B |
|
||
Price history
+206.8% since first listed10 events — show timeline
- 2026-06-02 Listed $270,000 REINMLS
- 2024-04-24 Sold (Public Records) $256,000 Public Records
- 2024-03-26 Pending — REINMLS
- 2024-03-25 Contingent — REINMLS
- 2024-03-22 Listed $234,999 REINMLS
- 2015-10-05 Sold (Public Records) $144,000 Public Records
- 2015-09-01 Sold (Public Records) $144,000 Public Records
- 2006-01-06 Sold (Public Records) $157,000 Public Records
- 2006-01-06 Sold (Public Records) $157,000 Public Records
- 2002-10-03 Sold (Public Records) $88,000 Public Records
Property tax history
+4.5%/yrLatest (2025): $2,226 · +4.1% YoY. Source: county tax records.
Cash-flow waterfall
monthlySold comps — $/sqft
last 12 mo · ≤1 miLoading sold comps…